. 2021 Dec;10(1):8-18.
doi: 10.1080/22221751.2020.1858176.

Blood transcriptomics to characterize key biological pathways and identify biomarkers for predicting mortality in melioidosis

Affiliations

Blood transcriptomics to characterize key biological pathways and identify biomarkers for predicting mortality in melioidosis

Thatcha Yimthin et al. Emerg Microbes Infect. 2021 Dec.

Abstract

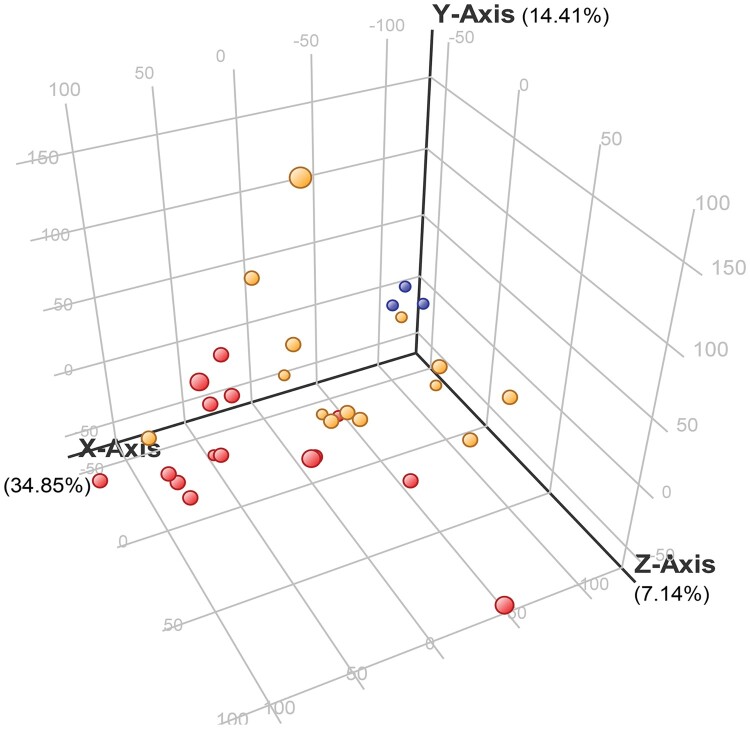
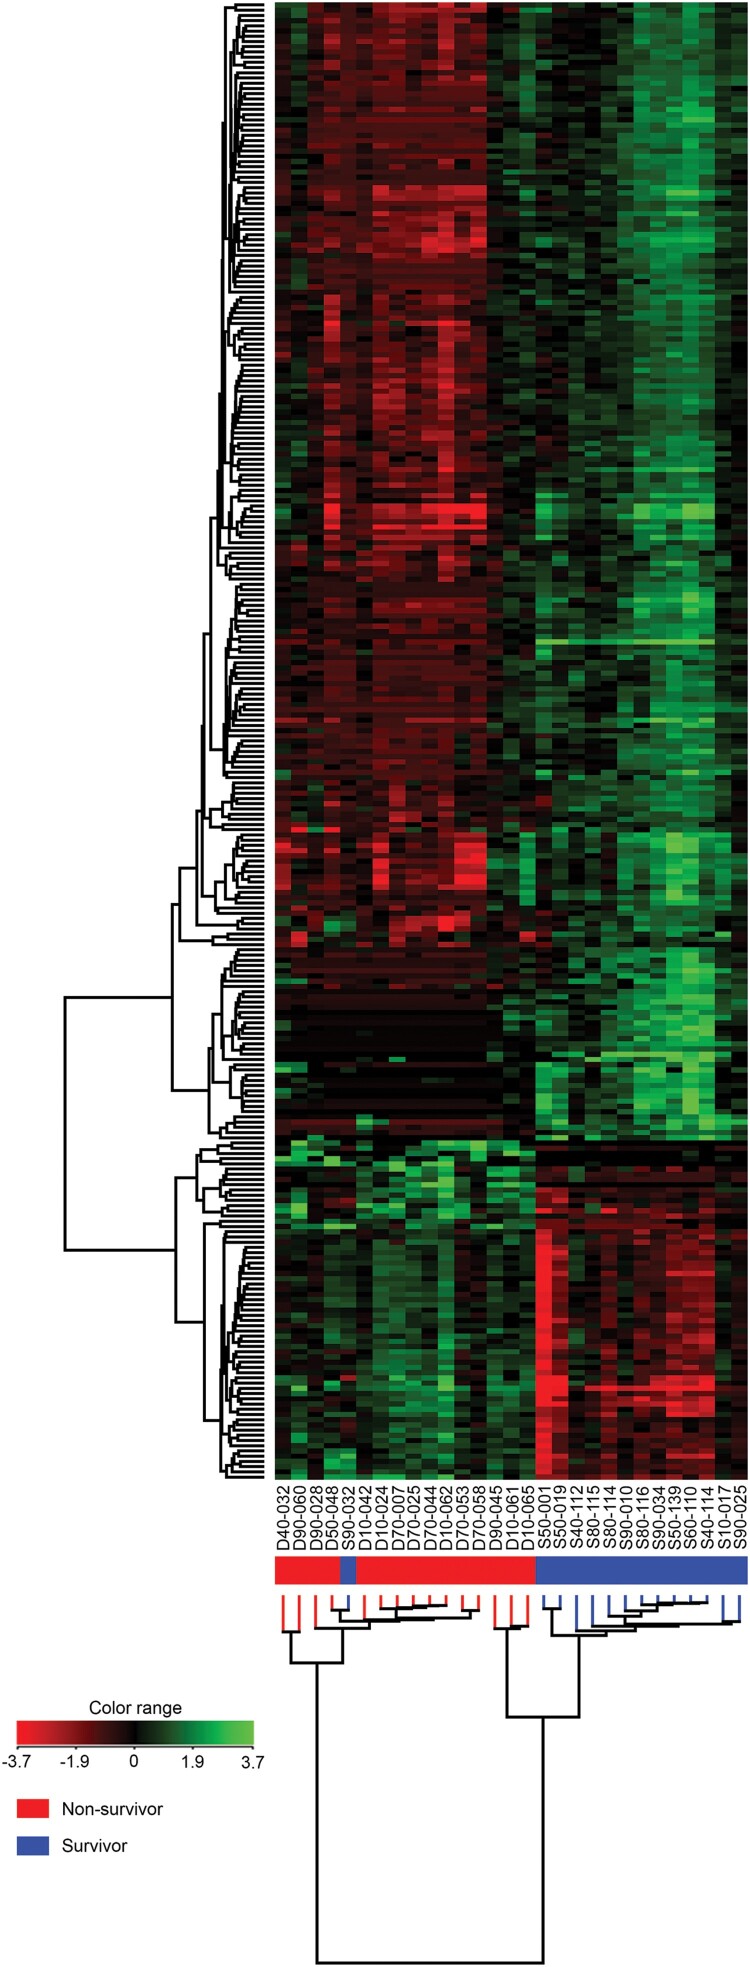
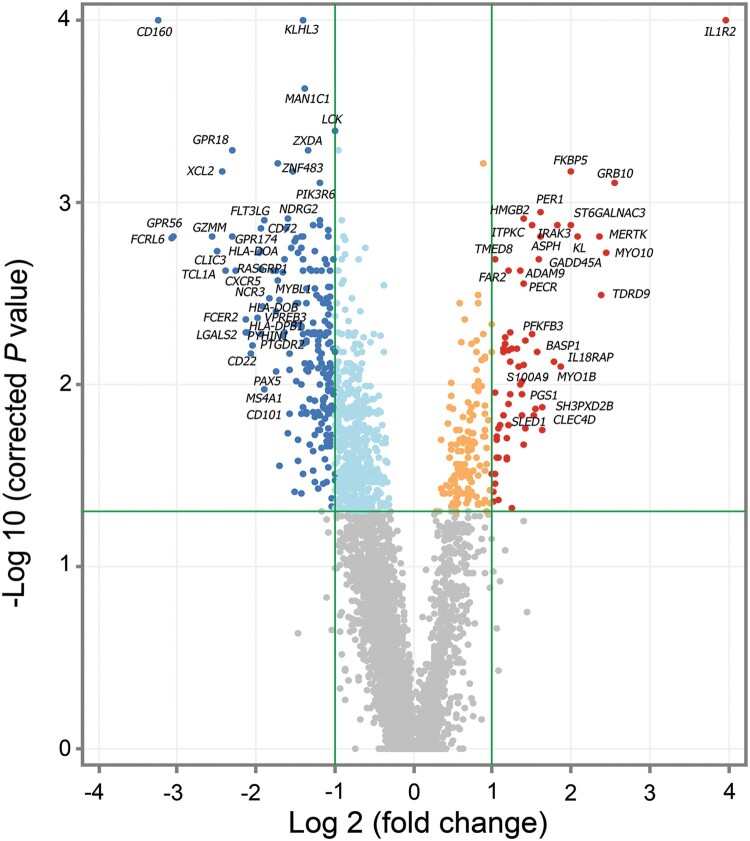
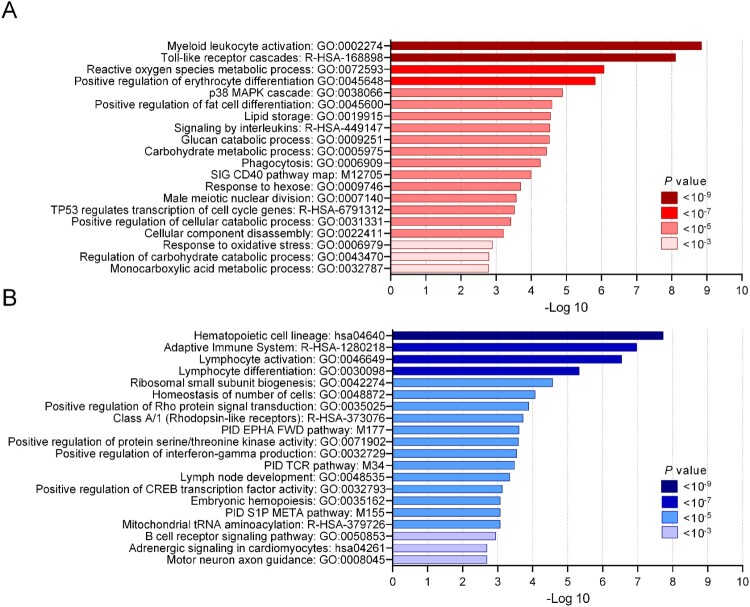
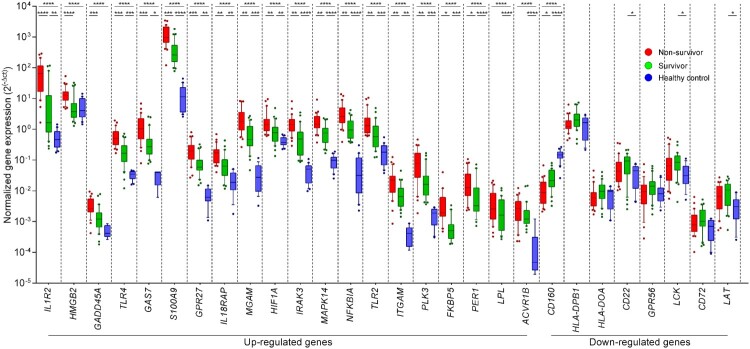
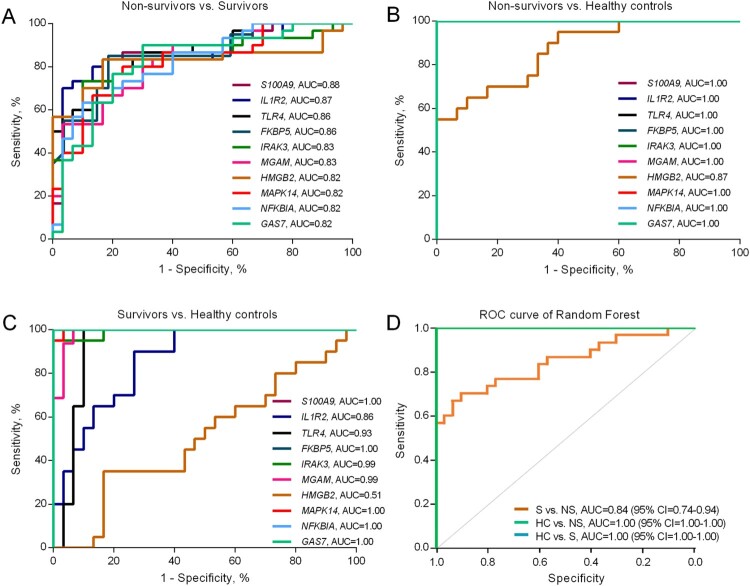
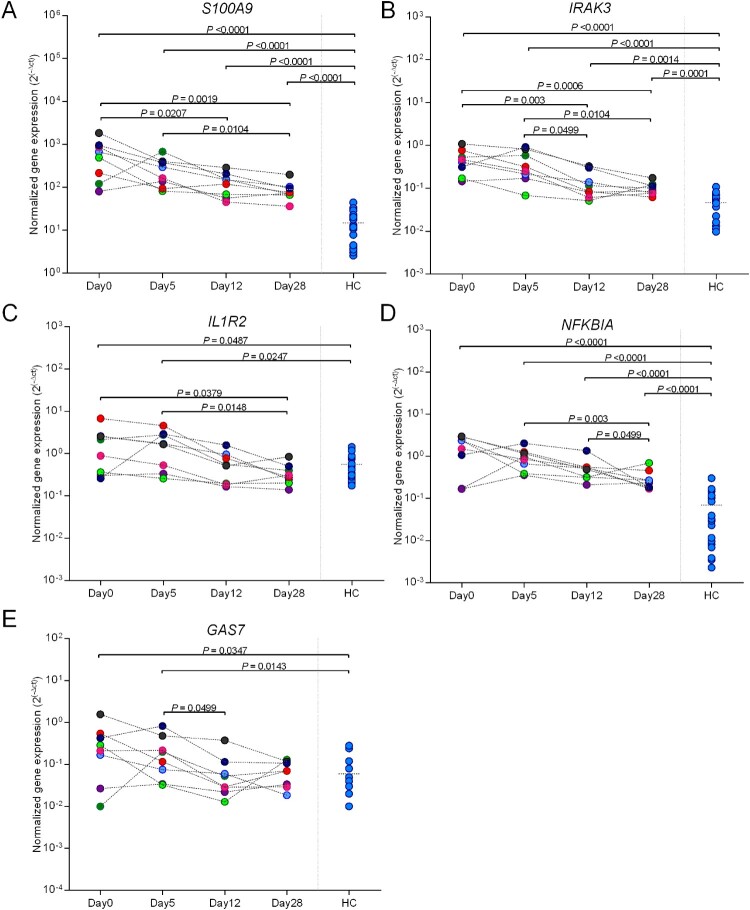
Melioidosis is an often lethal tropical disease caused by the Gram-negative bacillus, Burkholderia pseudomallei. The study objective was to characterize transcriptomes in melioidosis patients and identify genes associated with outcome. Whole blood RNA-seq was performed in a discovery set of 29 melioidosis patients and 3 healthy controls. Transcriptomic profiles of patients who did not survive to 28 days were compared with patients who survived and healthy controls, showing 65 genes were significantly up-regulated and 218 were down-regulated in non-survivors compared to survivors. Up-regulated genes were involved in myeloid leukocyte activation, Toll-like receptor cascades and reactive oxygen species metabolic processes. Down-regulated genes were hematopoietic cell lineage, adaptive immune system and lymphocyte activation pathways. RT-qPCR was performed for 28 genes in a validation set of 60 melioidosis patients and 20 healthy controls, confirming differential expression. IL1R2, GAS7, S100A9, IRAK3, and NFKBIA were significantly higher in non-survivors compared with survivors (P < 0.005) and healthy controls (P < 0.0001). The AUROCC of these genes for mortality discrimination ranged from 0.80-0.88. In survivors, expression of IL1R2, S100A9 and IRAK3 genes decreased significantly over 28 days (P < 0.05). These findings augment our understanding of this severe infection, showing expression levels of specific genes are potential biomarkers to predict melioidosis outcomes.

Keywords: Burkholderia pseudomallei; RNA-sequencing; biomarkers; immune response; melioidosis; outcome; transcriptomics.


Conflict of interest statement

No potential conflict of interest was reported by the author(s).

Figures

Figure 1.
Figure 1.
Three-dimensional principal component analysis (3D-PCA) of differentially expressed genes among non-survivors and survivors and healthy controls. One point per subject in yellow, red, and light blue, represents groups of melioidosis patients who survived (n = 14) and did not survive (n = 15), and healthy controls (n = 3), respectively. Each axis shows percent variation explained by each group.
Figure 2.
Figure 2.
Hierarchical clustering analysis of 283 differentially expressed genes (DEGs) in whole blood of surviving and non-surviving melioidosis patients. High expression of genes is shown in green whereas low expression of genes is shown in red. Each column represents individual subjects and each row in the figure represents one altered gene that significantly expressed at P ≤ 0.05 and fold change ≥ 2. Subjects from our study are melioidosis survivors (n = 14), melioidosis non-survivors (n = 15).
Figure 3.
Figure 3.
Differential expression analysis of survivors compared to non-survivors at the time of diagnosis (day 0). Gene expression profile of patients with melioidosis that survived after 28 days (n = 14) compared to patients that did not survive (n = 15). Color indicates statistically significant genes (adjusted P value ≤ 0.05, correction method = Benjamini-Hochberg), dark blue: down-regulated genes ≥ 2 fold change, dark red: up-regulated genes ≥ 2 fold change with grey corresponding to genes showing no expression change.
Figure 4.
Figure 4.
Functional enrichment analysis of DEGs in non-surviving melioidosis patients compared with patients that survived. (A) Top 20 enriched terms of 65 up-regulated genes in non-surviving melioidosis patients. (B) Top 20 enriched terms of 218 down-regulated genes in non-surviving melioidosis. Saturation of color corresponds to P values.
Figure 5.
Figure 5.
Validation of the differential expression analysis of 28 DEGs in whole blood from melioidosis patients. Genes that were found to be differentially expressed in patients with melioidosis that did not survive and survived were validated with real-time qPCR. The Kruskal–Wallis test was performed for comparing three groups. Subjects from our study were melioidosis survivors (n = 30), melioidosis non-survivors (n = 30), and healthy controls (n = 20). *P ≤ 0.05, **P ≤ 0.01, ***P ≤ 0.005, ****P ≤ 0.0001.
Figure 6.
Figure 6.
Area under the receiver operating characteristic curve (AUROCC) of DEGs in discrimination among non-survivors, survivors and healthy controls. (A) AUROCC of 10 DEGs between non-survivors versus survivors. (B) AUROCC of 10 DEGs between non-survivors versus healthy controls. (C) AUROCC of 10 DEGs between survivors versus healthy controls. (D). Random Forest model of a combined gene signature discriminates survivors and non-survivors. The 12 genes which individually discriminated clinical groups with AUROCC > 0.80 in qRT-PCR were combined to create a single model, which was used to classify the separation between survivors (S), non-survivors (NS) and healthy controls (HC) in the qRT-PCR dataset.
Figure 7.
Figure 7.
One month follow-up of S100A9, IRAK3, IL1R2, GAP7, and NFKBIA in surviving melioidosis patients over the course of illness. Whole blood samples from melioidosis survivors (n = 8) were collected at the various times from diagnosis (day 0, day 5, day 12, and day 28). The P-values were calculated by Mann–Whitney test. Data of healthy individuals were plotted as the controls.

References

    1. Mukhopadhyay C, Shaw T, Varghese GM, et al. . Melioidosis in South Asia (India, Nepal, Pakistan, Bhutan and Afghanistan). Trop Med Infect Dis. 2018 May 22;3(2):51. doi:10.3390/tropicalmed3020051 - DOI - PMC - PubMed
    1. Chin CY, Monack DM, Nathan S.. Genome wide transcriptome profiling of a murine acute melioidosis model reveals new insights into how Burkholderia pseudomallei overcomes host innate immunity. BMC Genom. 2010 Nov 27;11:672. doi:10.1186/1471-2164-11-672 - DOI - PMC - PubMed
    1. Wiersinga WJ, Virk HS, Torres AG, et al. . Melioidosis [Review]. Nat Rev Dis Prim. 2018 Feb 1;4:17107. doi:10.1038/nrdp.2017.107 - DOI - PMC - PubMed
    1. Cheng AC, Dance DA, Currie BJ.. Bioterrorism, glanders and melioidosis. Euro Surveill. 2005 Mar;10(3):11–12. doi:10.2807/esm.10.03.00528-en - DOI - PubMed
    1. Cheng AC, Currie BJ.. Melioidosis: epidemiology, pathophysiology, and management. Clin Microbiol Rev. 2005 Apr;18(2):383–416. doi:10.1128/CMR.18.2.383-416.2005 - DOI - PMC - PubMed