. 2020 Nov 30;21(1):548.
doi: 10.1186/s12859-020-03866-y.

Increased biological relevance of transcriptome analyses in human skeletal muscle using a model-specific pipeline

Affiliations

Increased biological relevance of transcriptome analyses in human skeletal muscle using a model-specific pipeline

Yusuf Khan et al. BMC Bioinformatics. .

Abstract

Background: Human skeletal muscle responds to weight-bearing exercise with significant inter-individual differences. Investigation of transcriptome responses could improve our understanding of this variation. However, this requires bioinformatic pipelines to be established and evaluated in study-specific contexts. Skeletal muscle subjected to mechanical stress, such as through resistance training (RT), accumulates RNA due to increased ribosomal biogenesis. When a fixed amount of total-RNA is used for RNA-seq library preparations, mRNA counts are thus assessed in different amounts of tissue, potentially invalidating subsequent conclusions. The purpose of this study was to establish a bioinformatic pipeline specific for analysis of RNA-seq data from skeletal muscles, to explore the effects of different normalization strategies and to identify genes responding to RT in a volume-dependent manner (moderate vs. low volume). To this end, we analyzed RNA-seq data derived from a twelve-week RT intervention, wherein 25 participants performed both low- and moderate-volume leg RT, allocated to the two legs in a randomized manner. Bilateral muscle biopsies were sampled from m. vastus lateralis before and after the intervention, as well as before and after the fifth training session (Week 2).

Result: Bioinformatic tools were selected based on read quality, observed gene counts, methodological variation between paired observations, and correlations between mRNA abundance and protein expression of myosin heavy chain family proteins. Different normalization strategies were compared to account for global changes in RNA to tissue ratio. After accounting for the amounts of muscle tissue used in library preparation, global mRNA expression increased by 43-53%. At Week 2, this was accompanied by dose-dependent increases for 21 genes in rested-state muscle, most of which were related to the extracellular matrix. In contrast, at Week 12, no readily explainable dose-dependencies were observed. Instead, traditional normalization and non-normalized models resulted in counterintuitive reverse dose-dependency for many genes. Overall, training led to robust transcriptome changes, with the number of differentially expressed genes ranging from 603 to 5110, varying with time point and normalization strategy.

Conclusion: Optimized selection of bioinformatic tools increases the biological relevance of transcriptome analyses from resistance-trained skeletal muscle. Moreover, normalization procedures need to account for global changes in rRNA and mRNA abundance.

Keywords: Bioinformatics pipeline; Normalization; RNA-seq; Skeletal muscle.


Conflict of interest statement

The authors declare no competing interests.

Figures

Fig. 1
Fig. 1
Study overview and RNA-seq analysis pipeline. Forty-one participants performed twelve weeks of resistance training with low- (one set per exercise, LOW) and moderate-volume (three sets per exercise, MOD) in a contralateral manner (2–3 sessions week-1) (a). Pre- and post-training testing included strength and muscle lean-mass assessments. Muscle biopsies were collected from m. vastus lateralis at four time-points, prior to and after the intervention (Week 0 and 12) and before and after the fifth training session (Week 2). Biopsies from participants who completed > 85% of prescribed sessions were used for RNA extraction (n = 34; A). RNA quality was assessed (b), and participants with RNA quality indicator (RQI) scores > 7 were submitted for RNA-seq (n = 25). RNA quality was not associated with muscle tissue weight (c), and participants included in RNA-seq experiments did not differ from excluded in terms of limb lean-mass gains (d). Higher training volume led to greater gains in limb lean mass (e) and strength (f) in the lower extremities (n = 25). RNA-seq data were quality filtered using trimgalore and trimmomatic and reads were compared to unfiltered reads (g). Read alignment was performed using five tools of which RSEM, kallisto, and Salmon showed greater fractions of genes with robust expression after removing low-abundance genes (expression filtering; H) compared to HISAT2 and STAR. RSEM, kallisto and Salmon also showed less Log2-differences between biological replicates in a subset of genes with known robust expression (see text for details, i)
Fig. 2
Fig. 2
Correlations between myosin heavy chain mRNA and protein abundance. mRNA abundances of myosin-heavy chains in m. vastus lateralis estimated using RSEM, kallisto, and Salmon showed stronger correlations with immunohistochemistry-determined protein expression than HISAT2 and STAR (a, b). mRNA and protein abundances of MYH7/Type I, MYH2/Type IIA, and MYH1/Type IIX were calculated as percentages of overall myosin-heavy chain mRNA and protein expression, analyses unbiased by normalization [34, 46]
Fig. 3
Fig. 3
Global mRNA expression and transcriptome profiles in response to low and moderate volume resistance training. The amounts of muscle tissue used during cDNA synthesis varied over the course of the study and between volume conditions (a low-volume, LOW; moderate-volume, MOD). Library sizes increased during the course of the intervention, with a tendency towards a greater increase in the low-volume condition (b). Difference in library sizes between volume conditions when expressed per-unit tissue weight were diminished, though increases from baseline were maintained (c). The tissue offset-normalized model identified 21 genes with higher expression in the moderate volume condition (d, e), ten of which was shared with the effective library-size normalized model at week 2 (e), and none of which was shared with the naïve model. No volume-dependent differences were found at Week 12 using the tissue-offset model. At this time point, library-size and naïve models both showed a marked skew towards augmented expression in the low-volume condition. At Week 2, functional annotation identified gene sets relating to extracellular matrix in response to higher training volume (tissue-offset model, orange and purple circles, f), all of which were more highly expressed in MOD, indicated by the positive enrichment score. Orange circles denote gene sets that were identified from rank-based enrichment tests based on the full data set. Purple circles denote gene categories that were also identified using over-representation analysis (ORA). Normalization strategies had global effects on enrichment analyses using rank tests, assessed using fold-changes and minimum significant differences scores (not shown), illustrated with the tissue-offset model leading to marked increases in genes associated with the “Collagen containing extracellular matrix” gene set (g) as well as a shift in the full distribution of Log2 fold-changes between volume conditions towards MOD (shown as density curves). Black bars represent genes that belong to the gene set identified as enriched (g). Genes symbols indicate genes identified as differentially expressed in each normalization scenario
Fig. 4
Fig. 4
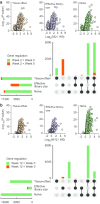
Comparing the effects of resistance training per se on transcriptome profiles using different normalization models. Volcano plot identifies differentially expressed genes at Week 2 (a) and Week 12 (b) (adjusted P-values < 0.05 and Log2 fold-changes >|0.5|, filled circles). Bar-plots shows the total number of DE genes (horizontal bars) and sets exclusively found in each model or shared among models (vertical bars). The majority of differentially expressed genes were identified by all three normalization models, though the effective library-size model identified a larger number of genes with decreased expression (a)
Fig. 5
Fig. 5
Comparing the effects of an acute bout of resistance training with low and moderate volume on transcriptome profiles in muscle biopsies. Overall, an acute bout of resistance training led to large-scale alterations in gene expression (volume-conditions combined) (a). Comparing differentially expressed events between volume conditions (low-volume, LOW; moderate-volume, MOD) identified one gene with volume-dependent changes in expression (RFT1, b). Three gene ontology categories were identified as significantly enriched using a rank-based test (minimum significant difference, MSD as the rank metric) as well as containing genes with unadjusted P-values < 0.05 (MSD > 0). Traces from the rank test are displayed in c

References

    1. Egan B, Zierath JR. Exercise metabolism and the molecular regulation of skeletal muscle adaptation. Cell Metab. 2013;17:162–184. doi: 10.1016/j.cmet.2012.12.012. - DOI - PubMed
    1. Dirks ML, Wall BT, van de Valk B, Holloway TM, Holloway GP, Chabowski A, et al. One week of bed rest leads to substantial muscle atrophy and induces whole-body insulin resistance in the absence of skeletal muscle lipid accumulation. Diabetes. 2016;65:2862–2875. doi: 10.2337/db15-1661. - DOI - PubMed
    1. Hammarström D, Øfsteng S, Koll L, Hanestadhaugen M, Hollan I, Apró W, et al. Benefits of higher resistance-training volume are related to ribosome biogenesis. J Physiol. 2020;598:543–565. doi: 10.1113/JP278455. - DOI - PubMed
    1. Hubal MJ, Gordish-Dressman H, Thompson PD, Price TB, Hoffman EP, Angelopoulos TJ, et al. Variability in muscle size and strength gain after unilateral resistance training. Med Sci Sports Exerc. 2005;37:964–972. doi: 10.1097/00005768-200505001-00881. - DOI - PubMed
    1. Ahtiainen JP, Walker S, Peltonen H, Holviala J, Sillanpaa E, Karavirta L, et al. Heterogeneity in resistance training-induced muscle strength and mass responses in men and women of different ages. Age (Dordr) 2016;38:10. doi: 10.1007/s11357-015-9870-1. - DOI - PMC - PubMed

LinkOut - more resources