

Reprogramming of synovial macrophage metabolism by synovial fibroblasts under inflammatory conditions
- PMID: 33256735
- PMCID: PMC7708128
- DOI: 10.1186/s12964-020-00678-8
Reprogramming of synovial macrophage metabolism by synovial fibroblasts under inflammatory conditions
Abstract
Background: Macrophages adapt to microenvironments, and change metabolic status and functions to regulate inflammation and/or maintain homeostasis. In joint cavities, synovial macrophages (SM) and synovial fibroblasts (SF) maintain homeostasis. However, under inflammatory conditions such as rheumatoid arthritis (RA), crosstalk between SM and SF remains largely unclear.
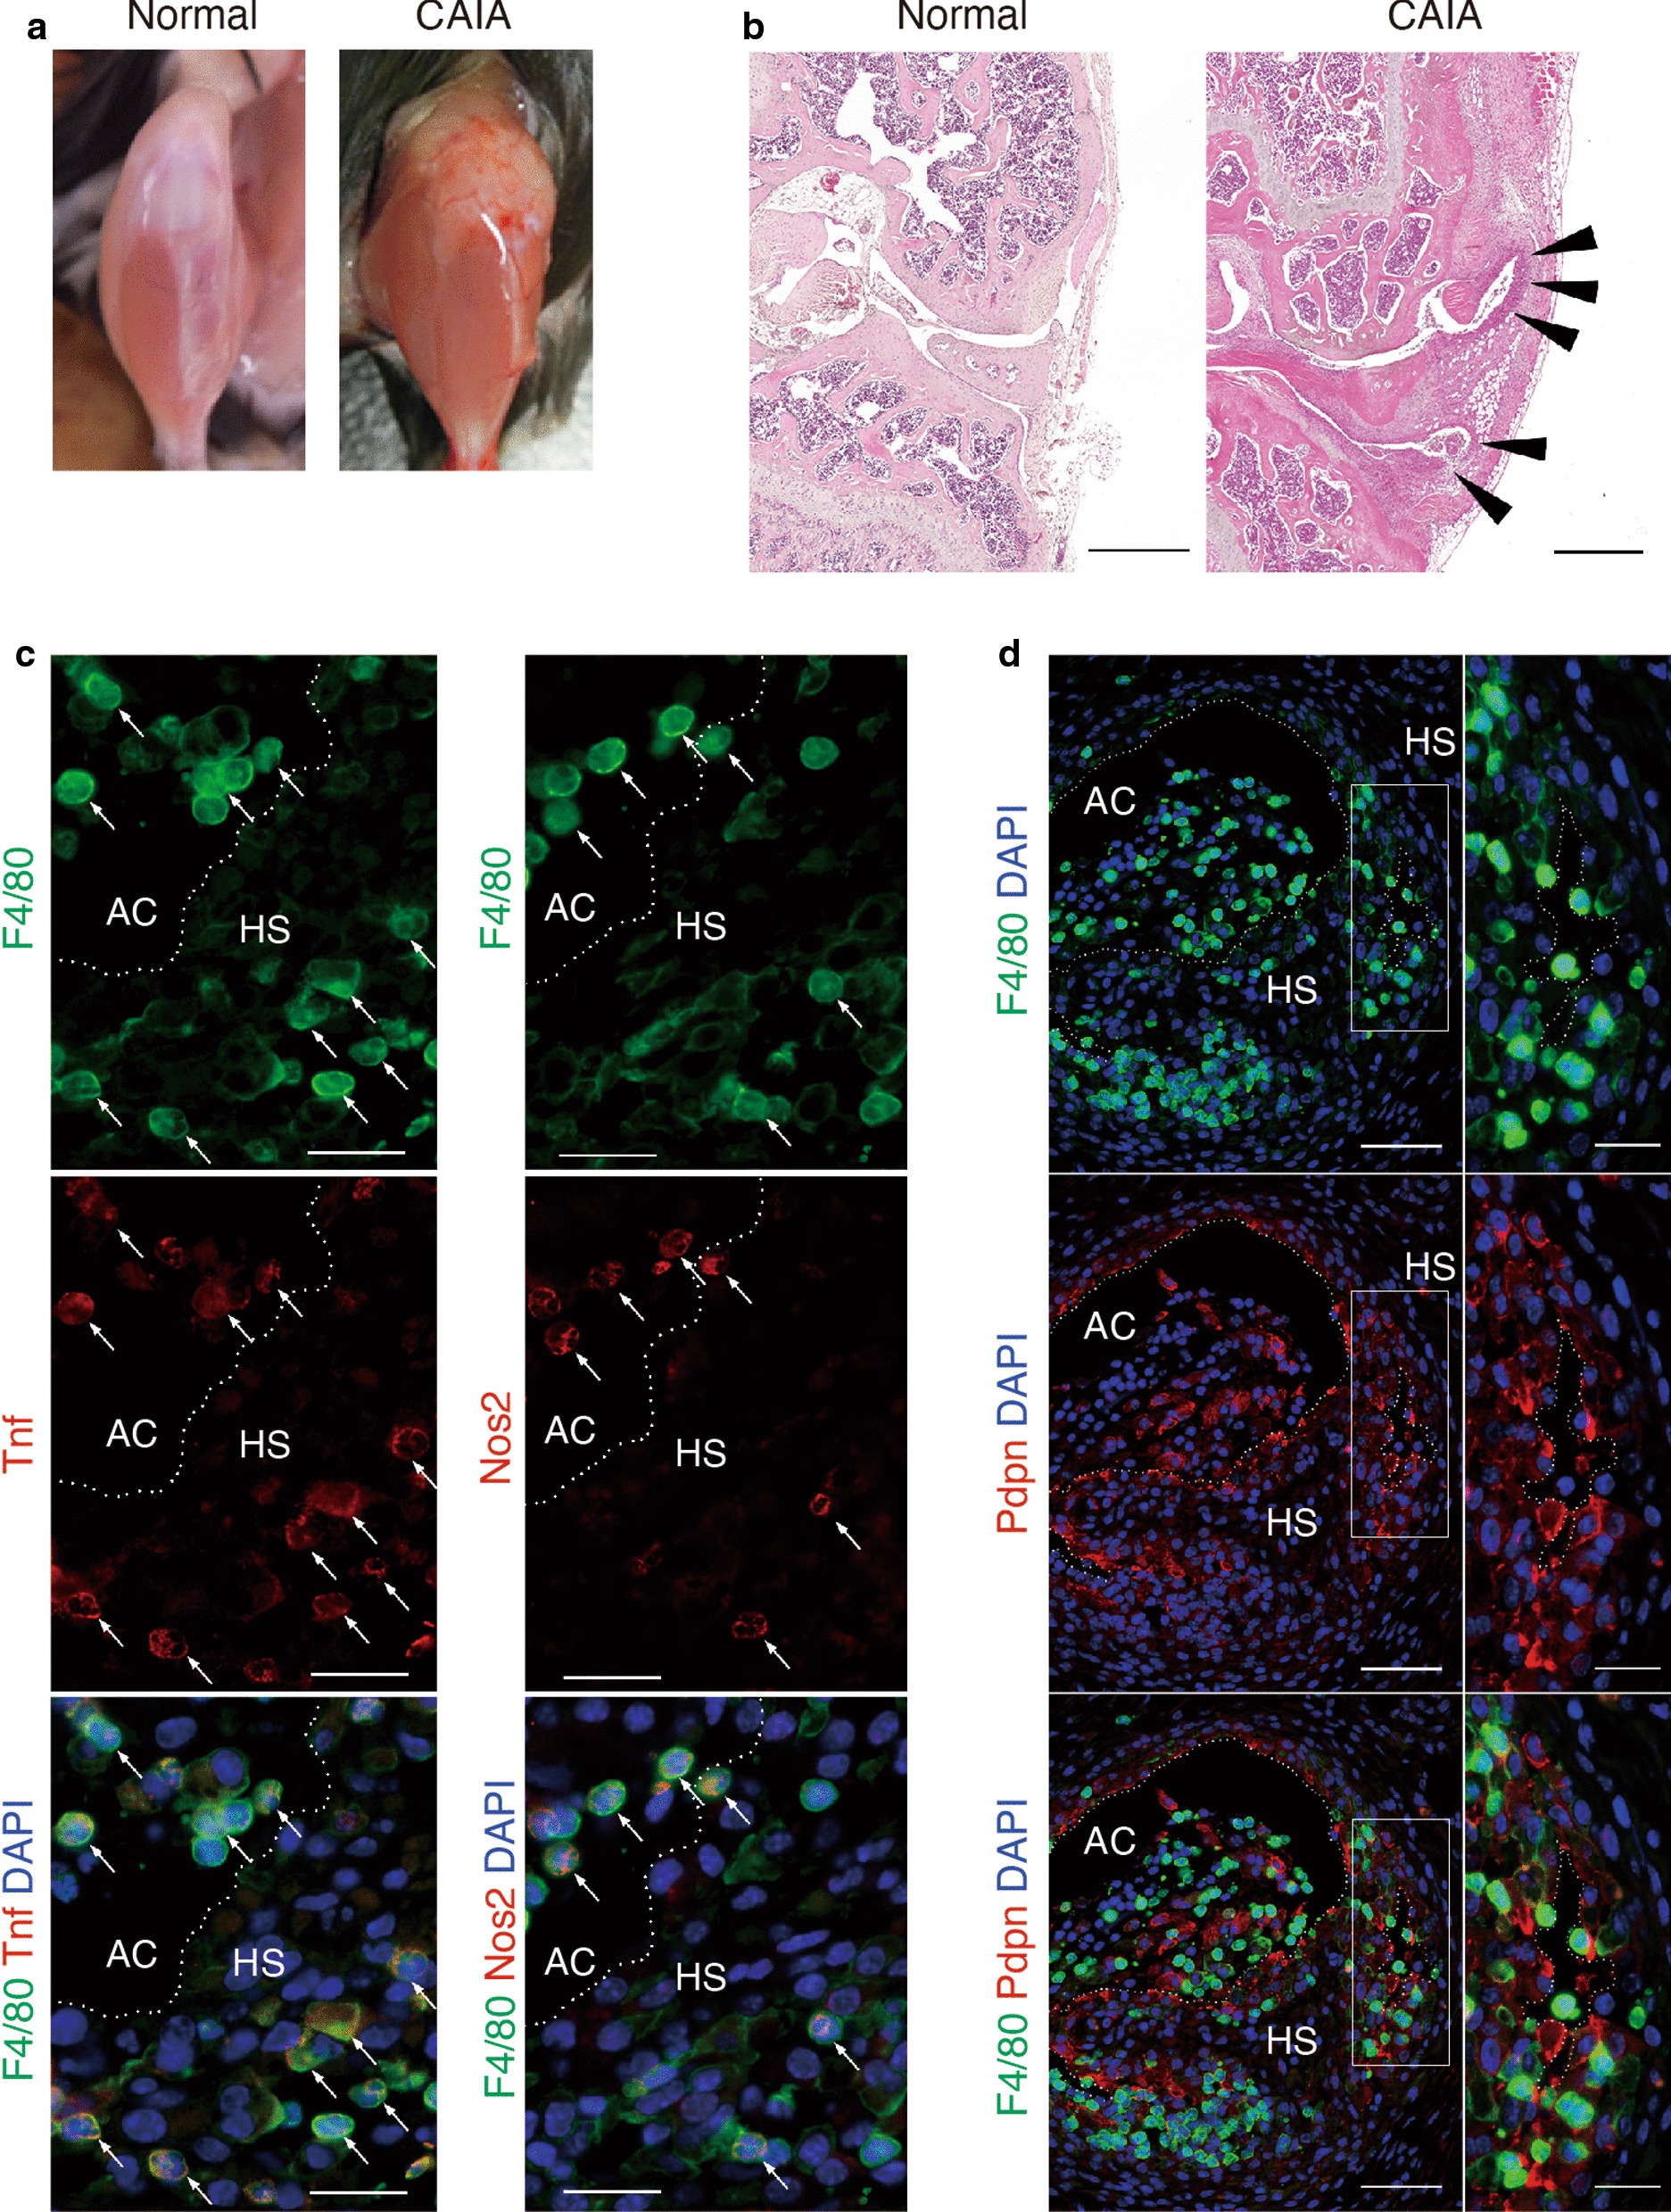
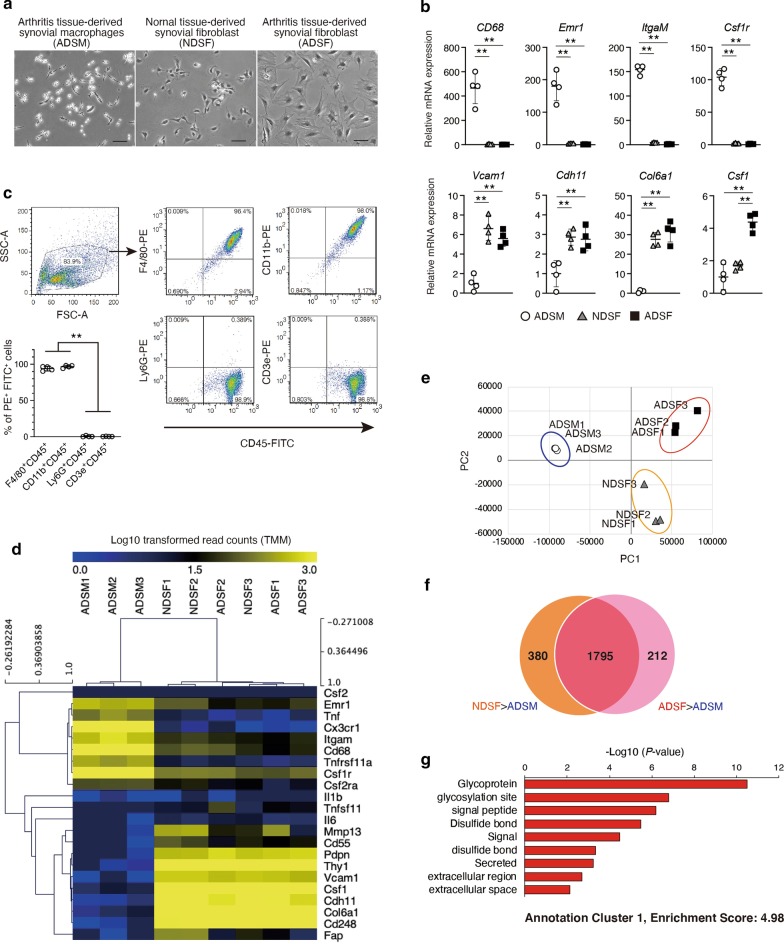
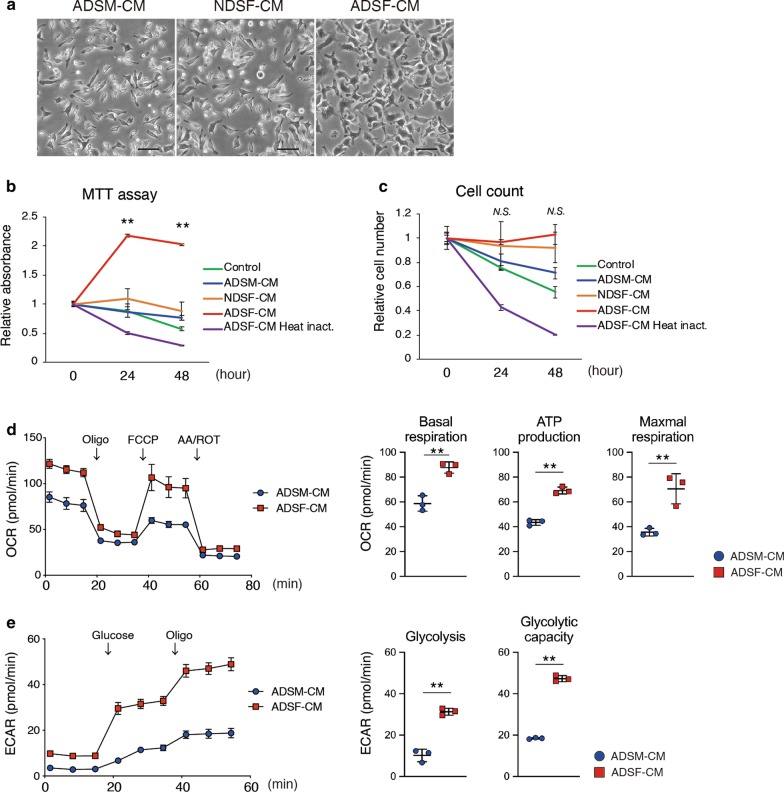
Methods: Immunofluorescent staining was performed to identify localization of SM and SF in synovium of collagen antibody induced arthritis (CAIA) model mice and normal mice. Murine arthritis tissue-derived SM (ADSM), arthritis tissue-derived SF (ADSF) and normal tissue-derived SF (NDSF) were isolated and the purity of isolated cells was examined by RT-qPCR and flow cytometry analysis. RNA-seq was conducted to reveal gene expression profile in ADSM, NDSF and ADSF. Cellular metabolic status and expression levels of metabolic genes and inflammatory genes were analyzed in ADSM treated with ADSM-conditioned medium (ADSM-CM), NDSF-CM and ADSF-CM.
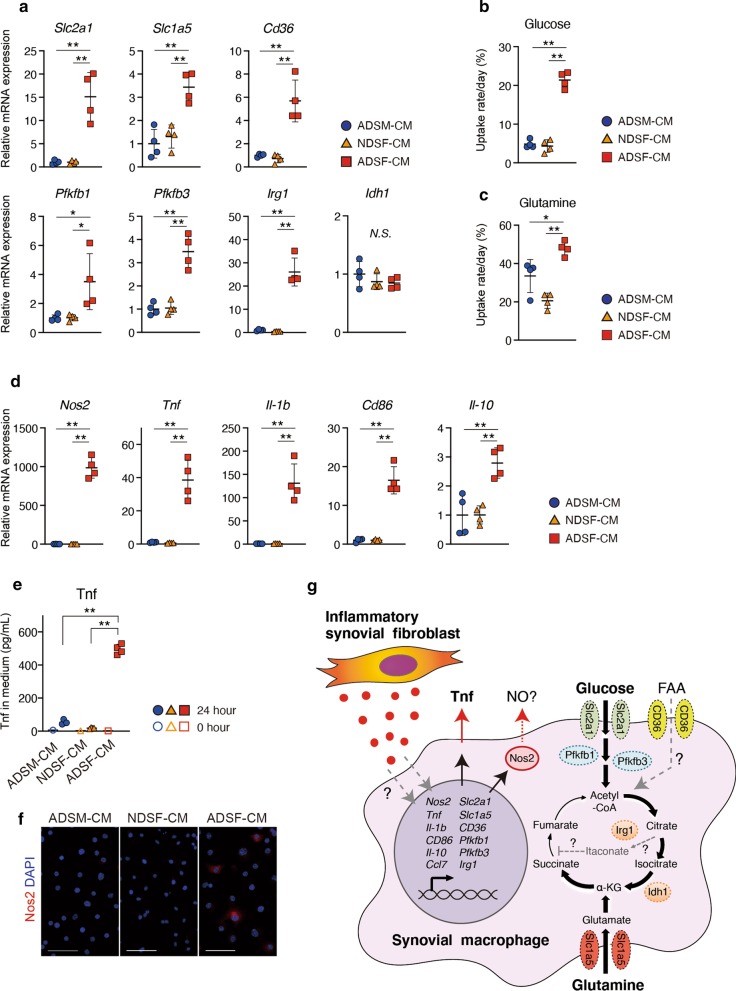
Results: SM and SF were dispersed in murine hyperplastic synovium. Isolations of ADSM, NDSF and ADSF to analyze the crosstalk were successful with high purity. From gene expression profiles by RNA-seq, we focused on secretory factors in ADSF-CM, which can affect metabolism and inflammatory activity of ADSM. ADSM exposed to ADSF-CM showed significantly upregulated glycolysis and mitochondrial respiration as well as glucose and glutamine uptake relative to ADSM exposed to ADSM-CM and NDSF-CM. Furthermore, mRNA expression levels of metabolic genes, such as Slc2a1, Slc1a5, CD36, Pfkfb1, Pfkfb3 and Irg1, were significantly upregulated in ADSM treated with ADSF-CM. Inflammation marker genes, including Nos2, Tnf, Il-1b and CD86, and the anti-inflammatory marker gene, Il-10, were also substantially upregulated by ADSF-CM. On the other hand, NDSF-CM did not affect metabolism and gene expression in ADSM.
Conclusions: These findings suggest that crosstalk between SM and SF under inflammatory conditions can induce metabolic reprogramming and extend SM viability that together can contribute to chronic inflammation in RA. Video Abstract.
Keywords: Chronic inflammation; Metabolic reprogramming; Rheumatoid arthritis; Synovial fibroblast; Synovial macrophage.
Conflict of interest statement
The authors declare that they have no competing interests.
Figures
Similar articles
-
Macrophages from the synovium of active rheumatoid arthritis exhibit an activin A-dependent pro-inflammatory profile.J Pathol. 2015 Feb;235(3):515-26. doi: 10.1002/path.4466. Epub 2014 Dec 18. J Pathol. 2015. PMID: 25319955
-
Guizhi-Shaoyao-Zhimu decoction possesses anti-arthritic effects on type II collagen-induced arthritis in rats via suppression of inflammatory reactions, inhibition of invasion & migration and induction of apoptosis in synovial fibroblasts.Biomed Pharmacother. 2019 Oct;118:109367. doi: 10.1016/j.biopha.2019.109367. Epub 2019 Aug 21. Biomed Pharmacother. 2019. PMID: 31545276
-
Promotion of macrophage activation by Tie2 in the context of the inflamed synovia of rheumatoid arthritis and psoriatic arthritis patients.Rheumatology (Oxford). 2020 Feb 1;59(2):426-438. doi: 10.1093/rheumatology/kez315. Rheumatology (Oxford). 2020. PMID: 31377797 Free PMC article.
-
[Rheumatoid arthritis: new developments in the pathogenesis with special reference to synovial fibroblasts].Z Rheumatol. 2001 Oct;60(5):309-18. doi: 10.1007/s003930170030. Z Rheumatol. 2001. PMID: 11759230 Review. German.
-
Macrophage polarization in rheumatoid arthritis: signaling pathways, metabolic reprogramming, and crosstalk with synovial fibroblasts.Front Immunol. 2024 May 10;15:1394108. doi: 10.3389/fimmu.2024.1394108. eCollection 2024. Front Immunol. 2024. PMID: 38799455 Free PMC article. Review.
Cited by
-
Calcium-Permeable Channels Cooperation for Rheumatoid Arthritis: Therapeutic Opportunities.Biomolecules. 2022 Sep 27;12(10):1383. doi: 10.3390/biom12101383. Biomolecules. 2022. PMID: 36291594 Free PMC article. Review.
-
Inside the Joint of Inflammatory Arthritis Patients: Handling and Processing of Synovial Tissue Biopsies for High Throughput Analysis.Front Med (Lausanne). 2022 Mar 14;9:830998. doi: 10.3389/fmed.2022.830998. eCollection 2022. Front Med (Lausanne). 2022. PMID: 35372383 Free PMC article. Review.
-
Development and validation of cuproptosis-related genes in synovitis during osteoarthritis progress.Front Immunol. 2023 Feb 2;14:1090596. doi: 10.3389/fimmu.2023.1090596. eCollection 2023. Front Immunol. 2023. PMID: 36817415 Free PMC article.
-
Mitochondrial ACOD1/IRG1 in infection and sterile inflammation.J Intensive Med. 2022 Feb 12;2(2):78-88. doi: 10.1016/j.jointm.2022.01.001. eCollection 2022 Apr. J Intensive Med. 2022. PMID: 36789185 Free PMC article. Review.
-
Crosstalk between synovial macrophages and fibroblasts in rheumatoid arthritis.Histol Histopathol. 2023 Nov;38(11):1231-1238. doi: 10.14670/HH-18-628. Epub 2023 May 12. Histol Histopathol. 2023. PMID: 37219031 Review.
References
-
- Mondor I, Baratin M, Lagueyrie M, Saro L, Henri S, Gentek R, Suerinck D, Kastenmuller W, Jiang JX, Bajenoff M. Lymphatic endothelial cells are essential components of the subcapsular sinus macrophage niche. Immunity. 2019;50(6):1453–1466 e1454. doi: 10.1016/j.immuni.2019.04.002. - DOI - PMC - PubMed
Publication types
MeSH terms
Substances
LinkOut - more resources
Full Text Sources
Molecular Biology Databases
Miscellaneous
