. 2020 Dec 1;12(1):108.
doi: 10.1186/s13073-020-00802-w.

Pervasive generation of non-canonical subgenomic RNAs by SARS-CoV-2

Affiliations

Pervasive generation of non-canonical subgenomic RNAs by SARS-CoV-2

Jason Nomburg et al. Genome Med. .

Abstract

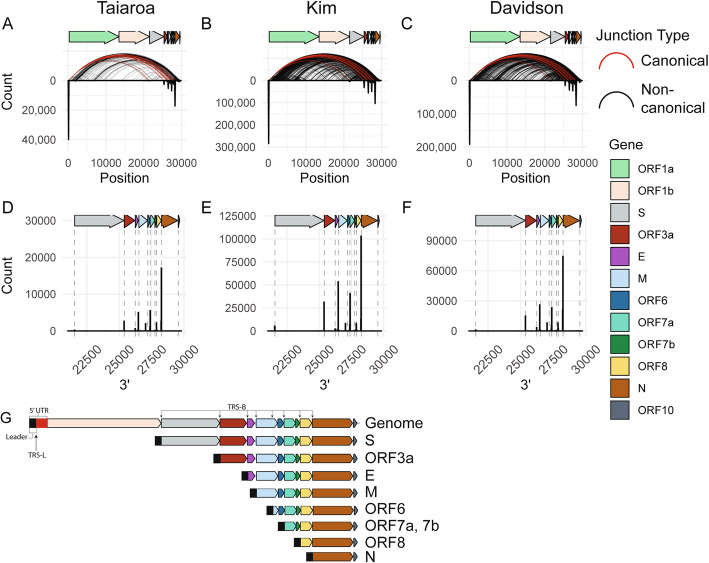
Background: SARS-CoV-2, a positive-sense RNA virus in the family Coronaviridae, has caused a worldwide pandemic of coronavirus disease 2019 or COVID-19. Coronaviruses generate a tiered series of subgenomic RNAs (sgRNAs) through a process involving homology between transcriptional regulatory sequences (TRS) located after the leader sequence in the 5' UTR (the TRS-L) and TRS located near the start of ORFs encoding structural and accessory proteins (TRS-B) near the 3' end of the genome. In addition to the canonical sgRNAs generated by SARS-CoV-2, non-canonical sgRNAs (nc-sgRNAs) have been reported. However, the consistency of these nc-sgRNAs across viral isolates and infection conditions is unknown. The comprehensive definition of SARS-CoV-2 RNA products is a key step in understanding SARS-CoV-2 pathogenesis.

Methods: Here, we report an integrative analysis of eight independent SARS-CoV-2 transcriptomes generated using three sequencing strategies, five host systems, and seven viral isolates. Read-mapping to the SARS-CoV-2 genome was used to determine the 5' and 3' coordinates of all junctions in viral RNAs identified in these samples.

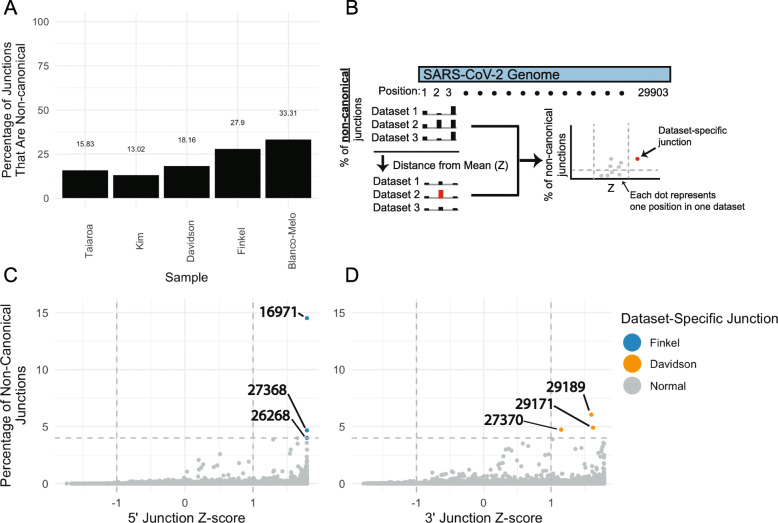
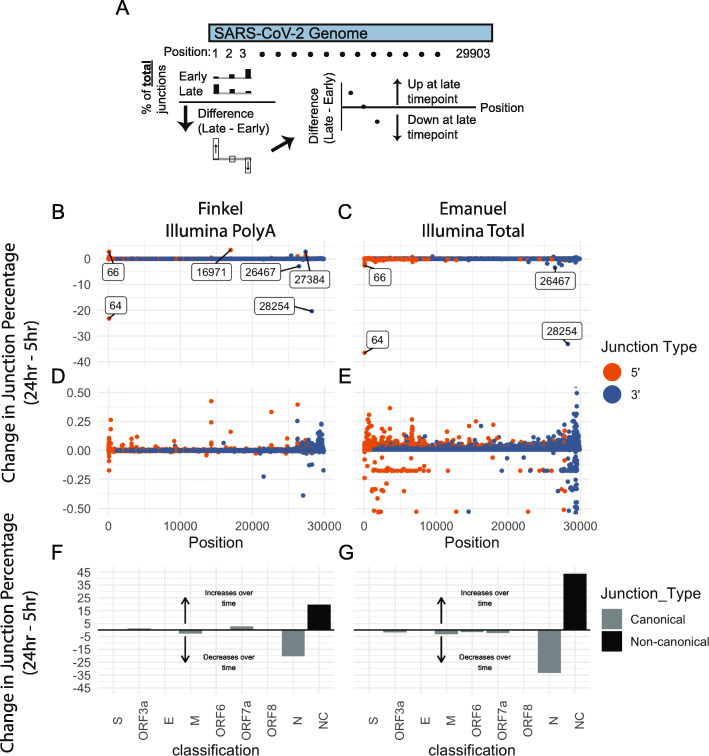
Results: Using junctional abundances, we show nc-sgRNAs make up as much as 33% of total sgRNAs in cell culture models of infection, are largely consistent in abundance across independent transcriptomes, and increase in abundance over time during infection. By assessing the homology between sequences flanking the 5' and 3' junction points, we show that nc-sgRNAs are not associated with TRS-like homology. By incorporating read coverage information, we find strong evidence for subgenomic RNAs that contain only 5' regions of ORF1a. Finally, we show that non-canonical junctions change the landscape of viral open reading frames.

Conclusions: We identify canonical and non-canonical junctions in SARS-CoV-2 sgRNAs and show that these RNA products are consistently generated by many independent viral isolates and sequencing approaches. These analyses highlight the diverse transcriptional activity of SARS-CoV-2 and offer important insights into SARS-CoV-2 biology.

Keywords: COVID-19; Direct RNA sequencing; SARS-CoV-2; Transcription.


Conflict of interest statement

M.M. receives research support from Bayer, Ono, and Janssen, has patents licensed to Bayer and Labcorp, and is a consultant for OrigiMed. J.A.D. received research support from Constellation Pharmaceuticals and is a consultant for EMD Serono, Inc. and Merck & Co. Inc. The remaining author declares no competing interests.

Figures

Fig. 1
Fig. 1
SARS-CoV-2 generates a defined population of canonical subgenomic RNAs. ac For each location on the viral genome, a histogram of 5′ and 3′ junctions at that position was calculated and plotted as an inverse peak. The histogram bin size is 100 bases, meaning each inverse peak represents the cumulative count of 5′ or 3′ junctions occurring within that span. Curved lines represent the 5′ and 3′ locations of junctions that occur at least twice. Red curves represent canonical junctions, black curves represent non-canonical junctions. “Taiaroa” [7], “Kim” [8], and “Davidson” [9] represent the three independent SARS-CoV-2 dRNAseq datasets investigated. df A histogram of 3′ junctions past position 21000 with a 5′ end before position 100 are plotted. Dashed lines indicate the start coordinates of annotated viral genes. Bin size is 20 bases. g Based on junction analysis, the predicted major species of virus-produced RNAs are represented. The most 5′ gene or genes on each subgenomic RNA is listed
Fig. 2
Fig. 2
Identification of few prominent dataset-specific non-canonical junctions. a Percentage of junctions that are non-canonical in five independent datasets. Junctions were assigned as canonical if their 5′ location was within 20 bases of the TRS-L and their 3′ location within 15 bases of a TRS-B, and otherwise assigned as non-canonical. Taiaroa, Kim, and Davidson are dRNAseq, while Finkel and Blanco-Melo are Illumina PolyA RNAseq. b Illustration of computational approach to determine the consistency of 5′ and 3′ junction points across independent datasets. The percentage of non-canonical junctions at each genome position in each dataset was determined (X). The mean (μ) and standard deviation (σ) of percentages at each position across the five datasets was calculated. For each position in each dataset, the Z-score was calculated as (X − μ)/σ (i.e., the number of standard deviations away from the mean), and the percentages and Z-scores for each position in each dataset were plotted. c, d Each point represents the percentage and Z-score of one position in one dataset. For each position in the SARS-CoV-2 genome, the percentage and Z-score of non-canonical junctions with a 5′ end (c) or a 3′ end (d) was determined as described above for five independent datasets: Taiaroa, Kim, Davidson, Finkel, and Blanco-Melo. Points with a percentage above 4% of non-canonical junctions and a Z-score above 1 were highlighted
Fig. 3
Fig. 3
Non-canonical junctions accumulate over time in cell culture. a Illustration of computational approach used to determine change in junction percentages over time. For each position in the SARS-CoV-2 genome and separately for 5′ and 3′ junctions, the number of junctions at that position was calculated. Using these numbers, the percentage of 5′ or 3′ junctions falling at each position was calculated. The change in junction percentage at each position is defined as the difference between the position’s junction percentage at the late and early timepoints, and this junction change was plotted for each position. be The change in junction percentage for 5′ (orange) and 3′ (blue) junctions over time in the Finkel (b, d) and Emanuel (c, e) datasets was determined as described above. Changes in the percentage of junctions Positions with at change greater than 2.5% are annotated with text on the plot. Panels d and e are zoomed in versions of b and c. f, g Junctions were assigned into groups based on their 5′ and 3′ junction positions. If a junction had a 5′ end within 20 bases of the TRS-L and within 15 bases of a TRS-B, it was considered a canonical junction belonging to the ORF with a start closest to the TRS-B. Otherwise, it was considered non-canonical. The percentage of junctions falling into each category was calculated for early and late timepoints, and the difference between each category’s percentage in the late vs early timepoint was plotted
Fig. 4
Fig. 4
Non-canonical junctions are not associated with TRS-like homology. a Illustration of computational approach used to assess homologous sequences between the 5′ and 3′ junction points. For each of the three dRNAseq datasets, the 30 bases flanking the 5′ and 3′ junction points were assessed, and the longest homologous sequence between these two 30 base regions was determined. bd Homologous sequences present in the 15 bases on either side of the 5′ and 3′ ends of each junction. Junctions are classified by the location of their 3′ end—if this is within 15 bases of the canonical TRS site or if it falls within a gene it is assigned accordingly. The only exception is ORF1a—junctions with a 5′ end originating in ORF1a are assigned to ORF1a. Labels represent the most common homologous sequence between the ends of each junction. The core TRS sequence ACGAAC is underlined. eg The length of the longest homologous sequence for canonical (C) and non-canonical (NC) are plotted. Here, junctions were considered canonical if they have a 5′ end within 20 nucleotides of the TRS-L and a 3′ end within 15 nucleotides of a TRS-B. (R) represents random homology lengths. The points for (R) were calculated by first extracting all possible 30 base sequences (30mers) from the SARS-CoV-2 genome, and then assessing the length of the longest homologous sequence between 100,000 random pairs of 30mers that are separated by at least 1000 bases on the genome. Within each column, the relative width of each band represents the relative abundance of junctions with each homology length. The value at the top of each column is the mean homology length
Fig. 5
Fig. 5
Relative abundance of subgenomic RNAs that contain only the 5′ end of ORF1a. ah Read coverage (black) and cumulative 5′ junctions (red) are plotted for eight independent datasets. The sequencing strategy and sample types are annotated. i A schematic of a representative subgenomic RNA that consists of only the 5′ region of ORF1a. Pileups showing reads can be found in Additional file 1: Fig. S3
Fig. 6
Fig. 6
Junctions have the potential to generate variant open reading frames. ac ORFs were predicted directly from transcript-derived reads for the three dRNAseq datasets. Each ORF was aligned against the protein sequences of canonical SARS-CoV-2 genes using the DIAMOND aligner. Variant ORFs were defined as ORFs that were assigned to a canonical SARS-CoV-2 protein but had an unexpected start or stop position, while perfectly aligning ORFs were considered canonical. The percentage of canonical and variant ORFs for each protein is plotted. dl Schematics of M, N, and ORF1a are displayed with the approximate location of predicted transmembrane domains labeled in red. A histogram of the start and end sites of variant M, N, and ORF1a ORFs are displayed. Start sites of each variant ORF are on top, and end sites are on the bottom of each panel. Percentages represent the percentage of each ORF that is variant. Histogram bin sizes: M, 1; N, 10; ORF1a, 20. NTD: N-terminal domain. RBD: Receptor binding domain. CD: connector domain. NSP: nonstructural protein. mo The identity of ORF1a-fusion partners is plotted on the Y-axis, with the count of such fusions on the X-axis. The top 10 fusion partners for each sample are represented. Color indicates if the fusion partner is on the N and C terminus of ORF1a, if the terminus is ambiguous, or if the fusion is a “self” fusion between an upstream and downstream region of ORF1a

Similar articles

  • Subgenomic RNA identification in SARS-CoV-2 genomic sequencing data.
    Parker MD, Lindsey BB, Leary S, Gaudieri S, Chopra A, Wyles M, Angyal A, Green LR, Parsons P, Tucker RM, Brown R, Groves D, Johnson K, Carrilero L, Heffer J, Partridge DG, Evans C, Raza M, Keeley AJ, Smith N, Filipe ADS, Shepherd JG, Davis C, Bennett S, Sreenu VB, Kohl A, Aranday-Cortes E, Tong L, Nichols J, Thomson EC; COVID-19 Genomics UK (COG-UK) Consortium; Wang D, Mallal S, de Silva TI. Parker MD, et al. Genome Res. 2021 Apr;31(4):645-658. doi: 10.1101/gr.268110.120. Epub 2021 Mar 15. Genome Res. 2021. PMID: 33722935 Free PMC article.
  • Profiling of SARS-CoV-2 Subgenomic RNAs in Clinical Specimens.
    Chen Z, Ng RWY, Lui G, Ling L, Chow C, Yeung ACM, Boon SS, Wang MH, Chan KCC, Chan RWY, Hui DSC, Chan PKS. Chen Z, et al. Microbiol Spectr. 2022 Apr 27;10(2):e0018222. doi: 10.1128/spectrum.00182-22. Epub 2022 Mar 21. Microbiol Spectr. 2022. PMID: 35311586 Free PMC article.
  • SARS-CoV-2 Subgenomic RNAs: Characterization, Utility, and Perspectives.
    Long S. Long S. Viruses. 2021 Sep 24;13(10):1923. doi: 10.3390/v13101923. Viruses. 2021. PMID: 34696353 Free PMC article. Review.
  • Nanopore ReCappable sequencing maps SARS-CoV-2 5' capping sites and provides new insights into the structure of sgRNAs.
    Ugolini C, Mulroney L, Leger A, Castelli M, Criscuolo E, Williamson MK, Davidson AD, Almuqrin A, Giambruno R, Jain M, Frigè G, Olsen H, Tzertzinis G, Schildkraut I, Wulf MG, Corrêa IR, Ettwiller L, Clementi N, Clementi M, Mancini N, Birney E, Akeson M, Nicassio F, Matthews DA, Leonardi T. Ugolini C, et al. Nucleic Acids Res. 2022 Apr 8;50(6):3475-3489. doi: 10.1093/nar/gkac144. Nucleic Acids Res. 2022. PMID: 35244721 Free PMC article.
  • sgRNAs: A SARS-CoV-2 emerging issue.
    Mori A, Lavezzari D, Pomari E, Deiana M, Piubelli C, Capobianchi MR, Castilletti C. Mori A, et al. Asp Mol Med. 2023;1:100008. doi: 10.1016/j.amolm.2023.100008. Epub 2023 Apr 16. Asp Mol Med. 2023. PMID: 37519862 Free PMC article. Review.

Cited by

References

    1. Wu F, Zhao S, Yu B, Chen Y-M, Wang W, Song Z-G, et al. A new coronavirus associated with human respiratory disease in China. Nature. 2020;579(7798):265–269. doi: 10.1038/s41586-020-2008-3. - DOI - PMC - PubMed
    1. Plant EP, Dinman JD. The role of programmed-1 ribosomal frameshifting in coronavirus propagation. Front Biosci. 2008;13:4873. doi: 10.2741/3046. - DOI - PMC - PubMed
    1. Narayanan K, Huang C, Makino S. SARS coronavirus accessory proteins. Virus Res. 2008;133(1):113–121. doi: 10.1016/j.virusres.2007.10.009. - DOI - PMC - PubMed
    1. de Haan CA, Masters PS, Shen X, Weiss S, Rottier PJ. The group-specific murine coronavirus genes are not essential, but their deletion, by reverse genetics, is attenuating in the natural host. Virology. 2002;296(1):177–189. doi: 10.1006/viro.2002.1412. - DOI - PMC - PubMed
    1. Yount B, Roberts RS, Sims AC, Deming D, Frieman MB, Sparks J, et al. Severe acute respiratory syndrome coronavirus group-specific open reading frames encode nonessential functions for replication in cell cultures and mice. J Virol. 2005;79(23):14909–14922. doi: 10.1128/JVI.79.23.14909-14922.2005. - DOI - PMC - PubMed

Publication types