

Meteorological factors and COVID-19 incidence in 190 countries: An observational study
- PMID: 33257056
- PMCID: PMC7682932
- DOI: 10.1016/j.scitotenv.2020.143783
Meteorological factors and COVID-19 incidence in 190 countries: An observational study
Abstract
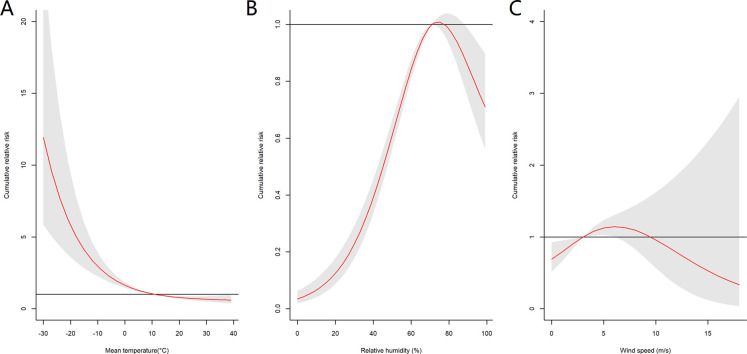
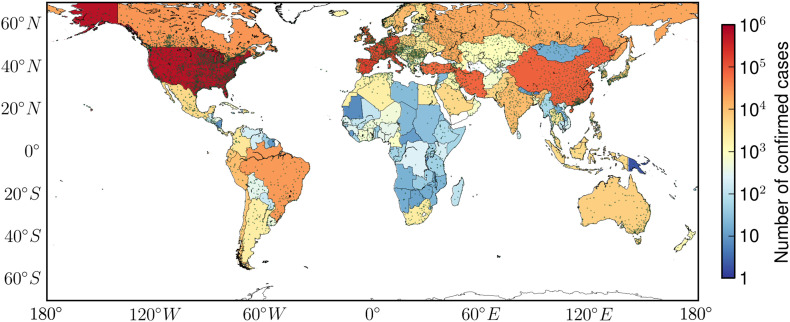
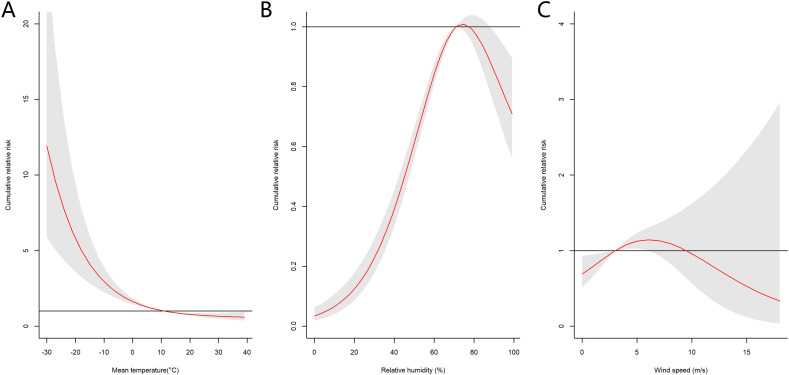
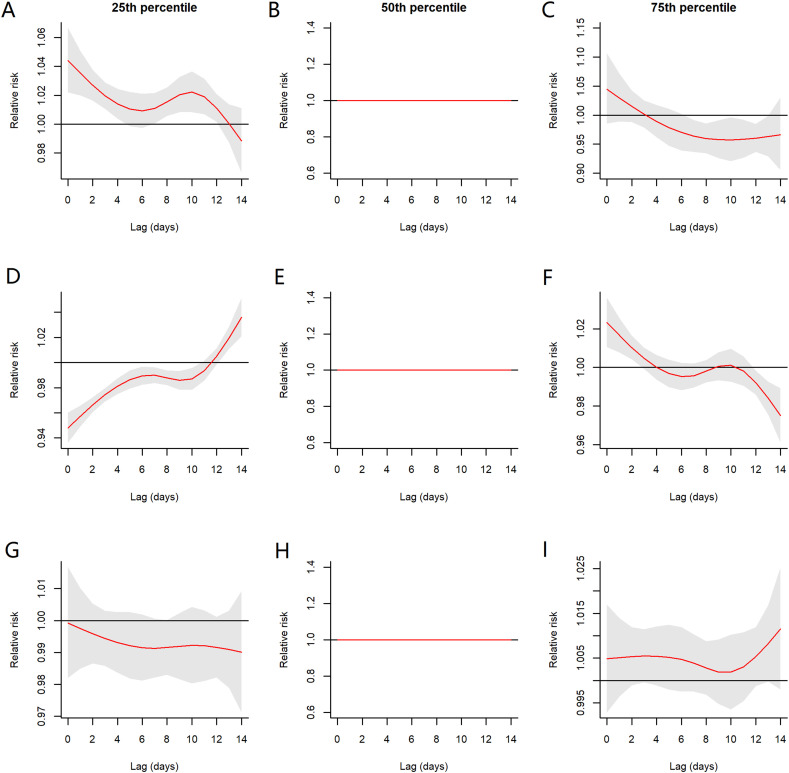
Novel corona virus disease 2019 (COVID-19), which first emerged in December 2019, has become a pandemic. This study aimed to investigate the associations between meteorological factors and COVID-19 incidence and mortality worldwide. This study included 1,908,197 confirmed cases of and 119,257 deaths from COVID-19 from 190 countries between 23 January and 13 April, 2020. We used a distributed lag non-linear model with city-/country-level random intercept to investigate the associations between COVID19 incidence and daily temperature, relative humidity, and wind speed. A series of confounders were considered in the analysis including demographics, socioeconomics, geographic locations, and political strategies. Sensitivity analyses were performed to examine the robustness of the associations. The COVID-19 incidence showed a stronger association with temperature than with relative humidity or wind speed. An inverse association was identified between the COVID-19 incidence and temperature. The corresponding 14-day cumulative relative risk was 1.28 [95% confidence interval (CI), 1.20-1.36] at 5 °C, and 0.75 (95% CI, 0.65-0.86) at 22 °C with reference to the risk at 11 °C. An inverse J-shaped association was observed between relative humidity and the COVID-19 incidence, with the highest risk at 72%. A higher wind speed was associated with a generally lower incidence of COVID-19, although the associations were weak. Sensitivity analyses generally yielded similar results. The COVID-19 incidence decreased with the increase of temperature. Our study suggests that the spread of COVID-19 may slow during summer but may increase during winter.
Keywords: COVID-19 incidence; COVID-19 mortality; Meteorology; Relative humidity; Temperature; Wind speed.
Copyright © 2020 Elsevier B.V. All rights reserved.
Conflict of interest statement
Declaration of competing interest The authors declared that they have no competing financial interests or personal relationships that could have appeared to influence the work reported in this paper.
Figures
Similar articles
-
Association between meteorological factors and daily new cases of COVID-19 in 188 countries: A time series analysis.Sci Total Environ. 2021 Aug 1;780:146538. doi: 10.1016/j.scitotenv.2021.146538. Epub 2021 Mar 23. Sci Total Environ. 2021. PMID: 34030332 Free PMC article.
-
Role of meteorological factors on SARS-CoV-2 infection incidence in Italy and Spain before the vaccination campaign. A multi-city time series study.Environ Res. 2022 Aug;211:113134. doi: 10.1016/j.envres.2022.113134. Epub 2022 Mar 17. Environ Res. 2022. PMID: 35307374 Free PMC article.
-
Influence of Meteorological Factors on the COVID-19 Transmission with Season and Geographic Location.Int J Environ Res Public Health. 2021 Jan 9;18(2):484. doi: 10.3390/ijerph18020484. Int J Environ Res Public Health. 2021. PMID: 33435301 Free PMC article.
-
Association of sudden sensorineural hearing loss with meteorological factors: a time series study in Hefei, China, and a literature review.Environ Sci Pollut Res Int. 2024 Jun;31(30):42970-42990. doi: 10.1007/s11356-024-33943-1. Epub 2024 Jun 17. Environ Sci Pollut Res Int. 2024. PMID: 38886269 Free PMC article. Review.
-
Association of Short-Term Exposure to Meteorological Factors and Risk of Hand, Foot, and Mouth Disease: A Systematic Review and Meta-Analysis.Int J Environ Res Public Health. 2020 Oct 30;17(21):8017. doi: 10.3390/ijerph17218017. Int J Environ Res Public Health. 2020. PMID: 33143315 Free PMC article.
Cited by
-
Influence of meteorological factors on the severity of COVID-19 in Spain: Observational ecological study.Med Clin (Barc). 2023 Apr 21;160(8):327-332. doi: 10.1016/j.medcli.2022.08.015. Epub 2022 Sep 22. Med Clin (Barc). 2023. PMID: 36257839 Free PMC article. English, Spanish.
-
Lagged meteorological impacts on COVID-19 incidence among high-risk counties in the United States-a spatiotemporal analysis.J Expo Sci Environ Epidemiol. 2022 Sep;32(5):774-781. doi: 10.1038/s41370-021-00356-y. Epub 2021 Jul 1. J Expo Sci Environ Epidemiol. 2022. PMID: 34211113 Free PMC article.
-
Association between meteorological factors and COVID-19 transmission in low- and middle-income countries: A time-stratified case-crossover study.Environ Res. 2023 Aug 15;231(Pt 1):116088. doi: 10.1016/j.envres.2023.116088. Epub 2023 May 9. Environ Res. 2023. PMID: 37169140 Free PMC article.
-
Interrelationship between daily COVID-19 cases and average temperature as well as relative humidity in Germany.Sci Rep. 2021 May 28;11(1):11302. doi: 10.1038/s41598-021-90873-5. Sci Rep. 2021. PMID: 34050241 Free PMC article.
-
All or nothing? Partial business shutdowns and COVID-19 fatality growth.PLoS One. 2022 Feb 9;17(2):e0262925. doi: 10.1371/journal.pone.0262925. eCollection 2022. PLoS One. 2022. PMID: 35139100 Free PMC article.
References
-
- (IATA) IATA . 2020. The Henley Passport Index.
-
- Abdollahi A., Rahbaralam M. Effect of temperature on the transmission of covid-19: a machine learning case study in Spain. medRxiv. 2020
-
- Awasthi R, Nagori A, Singh P, Pal R, Joshi V, Sethi T. 2020. Temperature and humidity do not influence global covid-19 incidence as inferred from causal models. medRxiv.
Publication types
MeSH terms
LinkOut - more resources
Full Text Sources
Other Literature Sources
Medical
Miscellaneous
