. 2021 Jan 27;41(4):663-673.
doi: 10.1523/JNEUROSCI.2405-20.2020. Epub 2020 Nov 30.

Heterogeneity of Age-Related Neural Hyperactivity along the CA3 Transverse Axis

Affiliations

Heterogeneity of Age-Related Neural Hyperactivity along the CA3 Transverse Axis

Heekyung Lee et al. J Neurosci. .

Abstract

Age-related memory deficits are correlated with neural hyperactivity in the CA3 region of the hippocampus. Abnormal CA3 hyperactivity in aged rats has been proposed to contribute to an imbalance between pattern separation and pattern completion, resulting in overly rigid representations. Recent evidence of functional heterogeneity along the CA3 transverse axis suggests that proximal CA3 supports pattern separation while distal CA3 supports pattern completion. It is not known whether age-related CA3 hyperactivity is uniformly represented along the CA3 transverse axis. We examined the firing rates of CA3 neurons from young and aged, male, Long-Evans rats along the CA3 transverse axis. Consistent with prior studies, young CA3 cells showed an increasing gradient in mean firing rate from proximal to distal CA3. However, aged CA3 cells showed an opposite, decreasing trend, in that CA3 cells in aged rats were hyperactive in proximal CA3, but possibly hypoactive in distal CA3, compared with young (Y) rats. We suggest that, in combination with altered inputs from the entorhinal cortex and dentate gyrus (DG), the proximal CA3 region of aged rats may switch from its normal function that reflects the pattern separation output of the DG and instead performs a computation that reflects an abnormal bias toward pattern completion. In parallel, distal CA3 of aged rats may create weaker attractor basins that promote abnormal, bistable representations under certain conditions.SIGNIFICANCE STATEMENT Prior work suggested that age-related CA3 hyperactivity enhances pattern completion, resulting in rigid representations. Implicit in prior studies is the notion that hyperactivity is present throughout a functionally homogeneous CA3 network. However, more recent work has demonstrated functional heterogeneity along the CA3 transverse axis, in that proximal CA3 is involved in pattern separation and distal CA3 is involved in pattern completion. Here, we show that age-related hyperactivity is present only in proximal CA3, with potential hypoactivity in distal CA3. This result provides new insight in the role of CA3 in age-related memory impairments, suggesting that the rigid representations in aging result primarily from dysfunction of computational circuits involving the dentate gyrus (DG) and proximal CA3.

Keywords: CA3; aging; hippocampus; hyperactivity; pattern completion; pattern separation.


Figures

Figure 1.
Figure 1.
CA3 recording locations and cell classifications. A, Recordings were made along the CA3 transverse axis. Locations between 0% and 40% of the axis length were defined as proximal, 40% and 70% as intermediate, and 70% and 100% as distal CA3 (left). Nissl-stained brain sections showing representative tetrode tracks in proximal, intermediate, and distal CA3 subregions (right). B, A LI score for each rat was derived during the probe trials during the water maze training, with lower scores indicating more accurate performance. Aged rats that performed on par with Y rats were designated as AU, and those that performed more poorly than Y rats (index score >240) were designated as AI. C, Recordings were made during three sessions, in which the local and global cues were in a fixed configuration that the rat had experienced in all preceding training trials. D, Classification of putative pyramidal cells and putative interneurons were made using three parameters: spike width, mean firing rate, and burst index. Using a K-means clustering analysis, blue circles represent cells classified as putative pyramidal cells and red circles represent cells classified as putative interneurons. Each circle is a cell recorded in one session. Hence, a cell can contribute up to three data points a day. Some of the classified putative interneurons had unusual firing patterns. Some cells in AU and AI rats had marked changes in their firing rates across sessions (AU cell 2; AI cell 2); one cell in the AI group had a very strong place field on the track (AI cell 1).
Figure 2.
Figure 2.
Place field properties in Y, AU, and AI rats. A, Example cells recorded in all three sessions from Y, AU, AI rats. B, From all four recording days, place cells that passed the inclusion criteria in all three sessions were ordered by the peak positions of their linearized rate maps in the first session (session 1). The positions of place fields that were active in all three sessions remained stable in all age groups. Firing rates of each place cell were normalized across the three sessions. The blue color indicates the minimum normalized firing rate (0), and the red color indicates the maximum firing rate (1). C, The rotation amounts of the place fields between the first session (session 1) and the last session (session 3) were calculated. Comparisons of the rotation amounts did not show a significant difference across the age groups. Spatial information scores (D) and place field sizes (E) both showed significant group × region interaction effects. Both Y and AU rats showed decreasing spatial information scores from proximal to distal CA3 with corresponding increasing place field sizes from proximal to distal CA3. In AI rats, the spatial information scores and the place field sizes failed to show a normal gradient along the CA3 transverse axis. Post hoc Tukey's tests (*p < 0.05) showed a significant group difference in the proximal region, with AI rats showing lower spatial information scores and larger place field sizes compared with Y and AU rats.
Figure 3.
Figure 3.
Age-related CA3 hyperactivity shows subregion differences along the transverse axis. A, Mean firing rates of place cells showed a significant group × region interaction effect. Post hoc Tukey's tests (*p < 0.05) showed significant group differences in that aged CA3 cells were hyperactive in the proximal region but hypoactive in the distal region compared with young CA3 cells. B, A linear mixed effects model was used to compare the mean firing rates along the transverse axis as a continuous variable, rather than a discrete subregion. Each circle (red = Y; green = AU; blue = AI) is a cell recorded at the location along the transverse axis. The solid lines show the model's best fits, with 95% CIs. Consistent with A, both AU and AI show hyperactivity in the proximal region but hypoactivity in the distal region, compared with Y rats. C, Data showing observed mean firing rates along the transverse axis organized according to each animal.
Figure 4.
Figure 4.
Speed does not account for the firing rate differences. A, Histograms showing the distribution of speeds for each age group while animals were running on the circular track. Aged rats ran at slower speeds compared with Y rats. B, A linear mixed effects model that incorporates momentary speed as a fixed effect was used to analyze mean firing rate along the CA3 transverse axis. The solid lines show the model's best fits, with 95% CIs. With the confounding influence of speed taken into account, both AU and AI still showed hyperactivity in proximal CA3 but potential hypoactivity in distal CA3. C, Data showing the observed mean firing rate relationship with the rat's running speeds organized according to each animal.
Figure 5.
Figure 5.
Nonspatial cells do not contribute to age-related hyperactivity. A, Examples of well-isolated pyramidal neuron clusters from two different AI rats showing a lack of location-specific firing on the circular track. B, Active cells were categorized as spatial cells, low rate cells, or nonspatial cells. There were significant group differences in the proportions of cell types in each subregion (χ2, p < 0.05). The proportion of active cells with spatial fields is lower in AI rats compared with AU and Y rats. Correspondingly, the proportion of nonspatial cells in AI rats was higher compared with AU and Y rats across the subregions. C, Mean firing rates of nonspatial cells showed significant group × region interaction effects, but post hoc Tukey's tests showed that the only difference was in the distal region where AU rats had lower rates compared with Y and AI rats (*p < 0.05). D, A linear mixed effects model that incorporates momentary speed as a fixed effect was used to analyze the mean firing rates along the CA3 transverse axis. The solid lines show the model's best fits, with 95% CIs. The mean firing rates along the transverse axis were not significantly different among the groups.
Figure 6.
Figure 6.
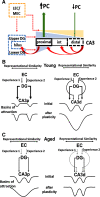
Hypothesized model of how changes in CA3 activity rates along the transverse axis affect the attractor dynamics of CA3 and the transmission of pattern-separated outputs from DG. A, Three major inputs to CA3 are EC (with stronger inputs to distal CA3), DG (with stronger inputs to proximal CA3), and recurrent collaterals. Broken lines denote age-related reduction in function. In aging, with reduced EC and DG inputs, hyperactivity in proximal CA3 results in increased pattern completion (PC) while potential hypoactivity in distal CA3 results in weakened PC. B, For Y rats, the standard model of DG is that the EC neural representations of two similar experiences will be similar (shown as distance between two input arrows along a “representational similarity” axis). The DG takes the two similar EC patterns and performs a pattern separation function, increasing the distance between the representations of the two experiences (i.e., the distance between the arrows representing the DG output to CA3 is larger than the distance between the two EC inputs). In proximal CA3 (CA3p), the strong input from the DG (both upper and lower blades), coupled with the lack of strong, direct EC inputs, imposes the separated patterns on CA3 attractor networks. Through learning, the recurrent collaterals of CA3 increase the strength of the attractor basins. In distal CA3 (CA3d), the DG inputs are somewhat weaker and the direct EC inputs are stronger than CA3p. Thus, the combined DG and EC input may impose initial patterns on CA3d that are somewhat closer together and overlapping than those imposed in CA3p. The stronger recurrent collateral system of CA3d may override the external drive from DG/EC and merge the two attractor basins to form a broader and deeper energy well, resulting in pattern completion (or generalization) of the two input patterns. C, For aged rats, disruptions in the DG circuitry, because of dysfunction of the EC inputs (especially LEC) and the local inhibitory circuitry of the DG hilus, are hypothesized to reduce the ability of the DG to separate the similar EC input patterns (i.e., the distance between the DG inputs to CA3 is not as large as in Y animals, and the coordinated drive to CA3 may be reduced). The hyperactivity of CA3p cells may increase the relative strength of the CA3p attractor dynamics, overriding the DG inputs and causing a single basin of attraction (similar to that of CA3d in Y animals, but weaker because of the lower density of recurrent collaterals in CA3p). Thus, CA3p, which normally transmits a pattern-separated signal to distal CA1 in Y rats, instead transmits a pattern completed signal in aged rats, as seen in some studies (Tanila et al., 1997a,b). The possible hypoactivity of CA3d cells may result in weaker attractor basins in CA3d compared with Y rats, preventing the merging of the attractor basins that occurs in Y rats and in CA3p of aged rats. Thus, two stable attractor states, with relatively lower energy barriers between them, may result in the bistable representations seen in other studies (Barnes et al., 1997).

References

    1. Ahmed OJ, Mehta MR (2009) The hippocampal rate code: anatomy, physiology and theory. Trends Neurosci 32:329–338. 10.1016/j.tins.2009.01.009 - DOI - PMC - PubMed
    1. Aitchison J, Silvey SD (1960) Maximum-likelihood estimation procedures and associated tests of significance. J R Stat Soc Series B Stat Methodol 22:154–171. 10.1111/j.2517-6161.1960.tb00362.x - DOI
    1. Alme CB, Miao C, Jezek K, Treves A, Moser EI, Moser M-B (2014) Place cells in the hippocampus: eleven maps for eleven rooms. Proc Natl Acad Sci USA 111:18428–18435. 10.1073/pnas.1421056111 - DOI - PMC - PubMed
    1. Amaral D, Lavenex P (2007) Hippocampal neuroanatomy. In: The hippocampus book. Oxford: Oxford University Press.
    1. Amaral DG, Witter MP (1989) The three-dimensional organization of the hippocampal formation: a review of anatomical data. Neuroscience 31:571–591. 10.1016/0306-4522(89)90424-7 - DOI - PubMed

Publication types