. 2021 Feb 1;27(3):889-902.
doi: 10.1158/1078-0432.CCR-20-2400. Epub 2020 Nov 30.

Modification of Extracellular Matrix Enhances Oncolytic Adenovirus Immunotherapy in Glioblastoma

Affiliations

Modification of Extracellular Matrix Enhances Oncolytic Adenovirus Immunotherapy in Glioblastoma

Juri Kiyokawa et al. Clin Cancer Res. .

Abstract

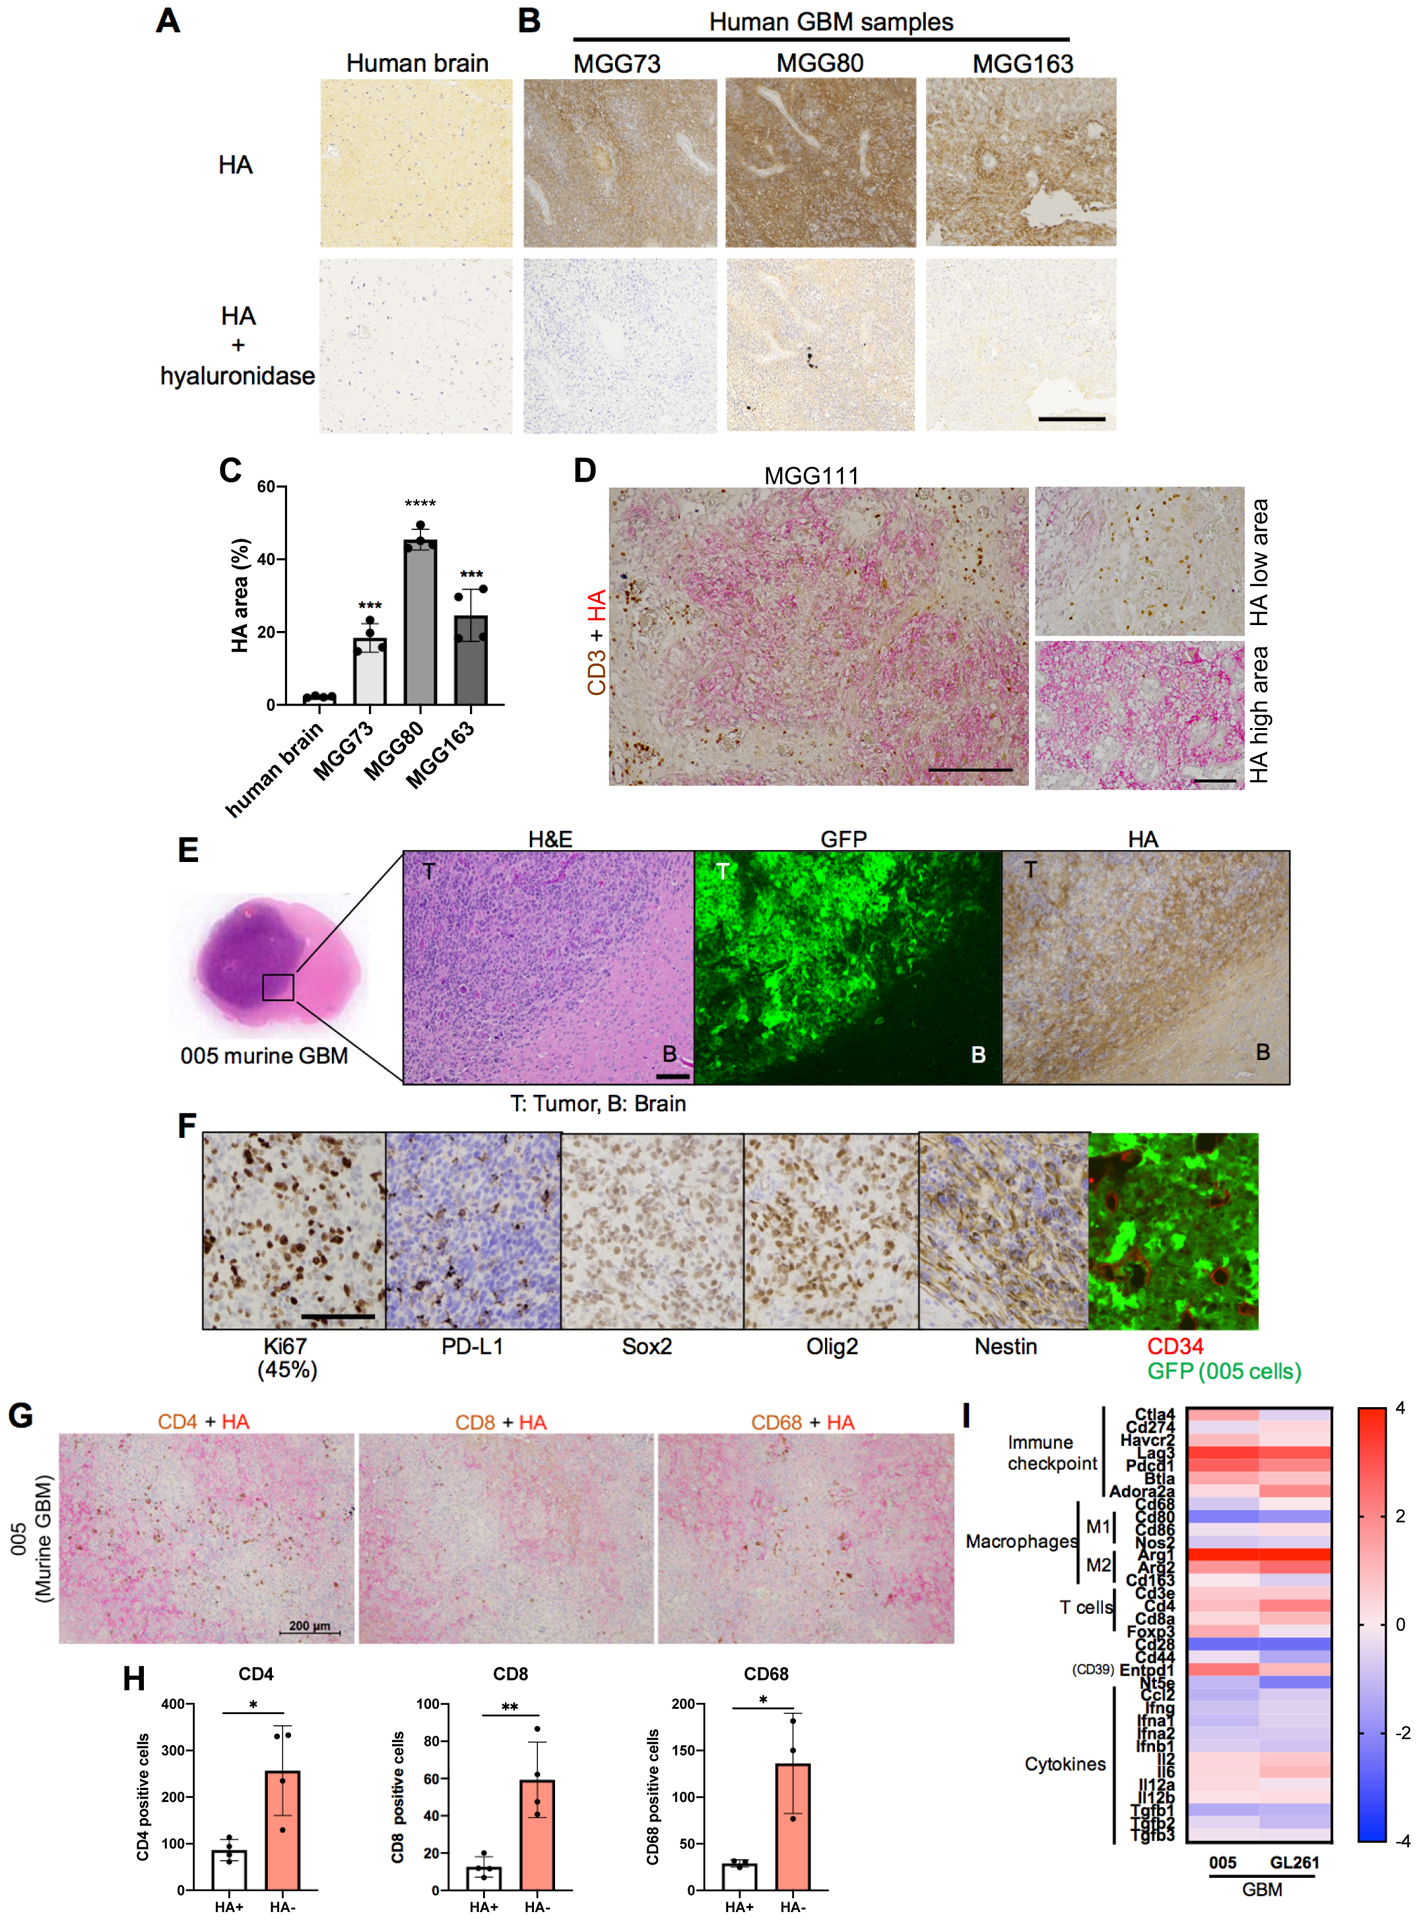
Purpose: Extracellular matrix (ECM) component hyaluronan (HA) facilitates malignant phenotypes of glioblastoma (GBM), however, whether HA impacts response to GBM immunotherapies is not known. Herein, we investigated whether degradation of HA enhances oncolytic virus immunotherapy for GBM.

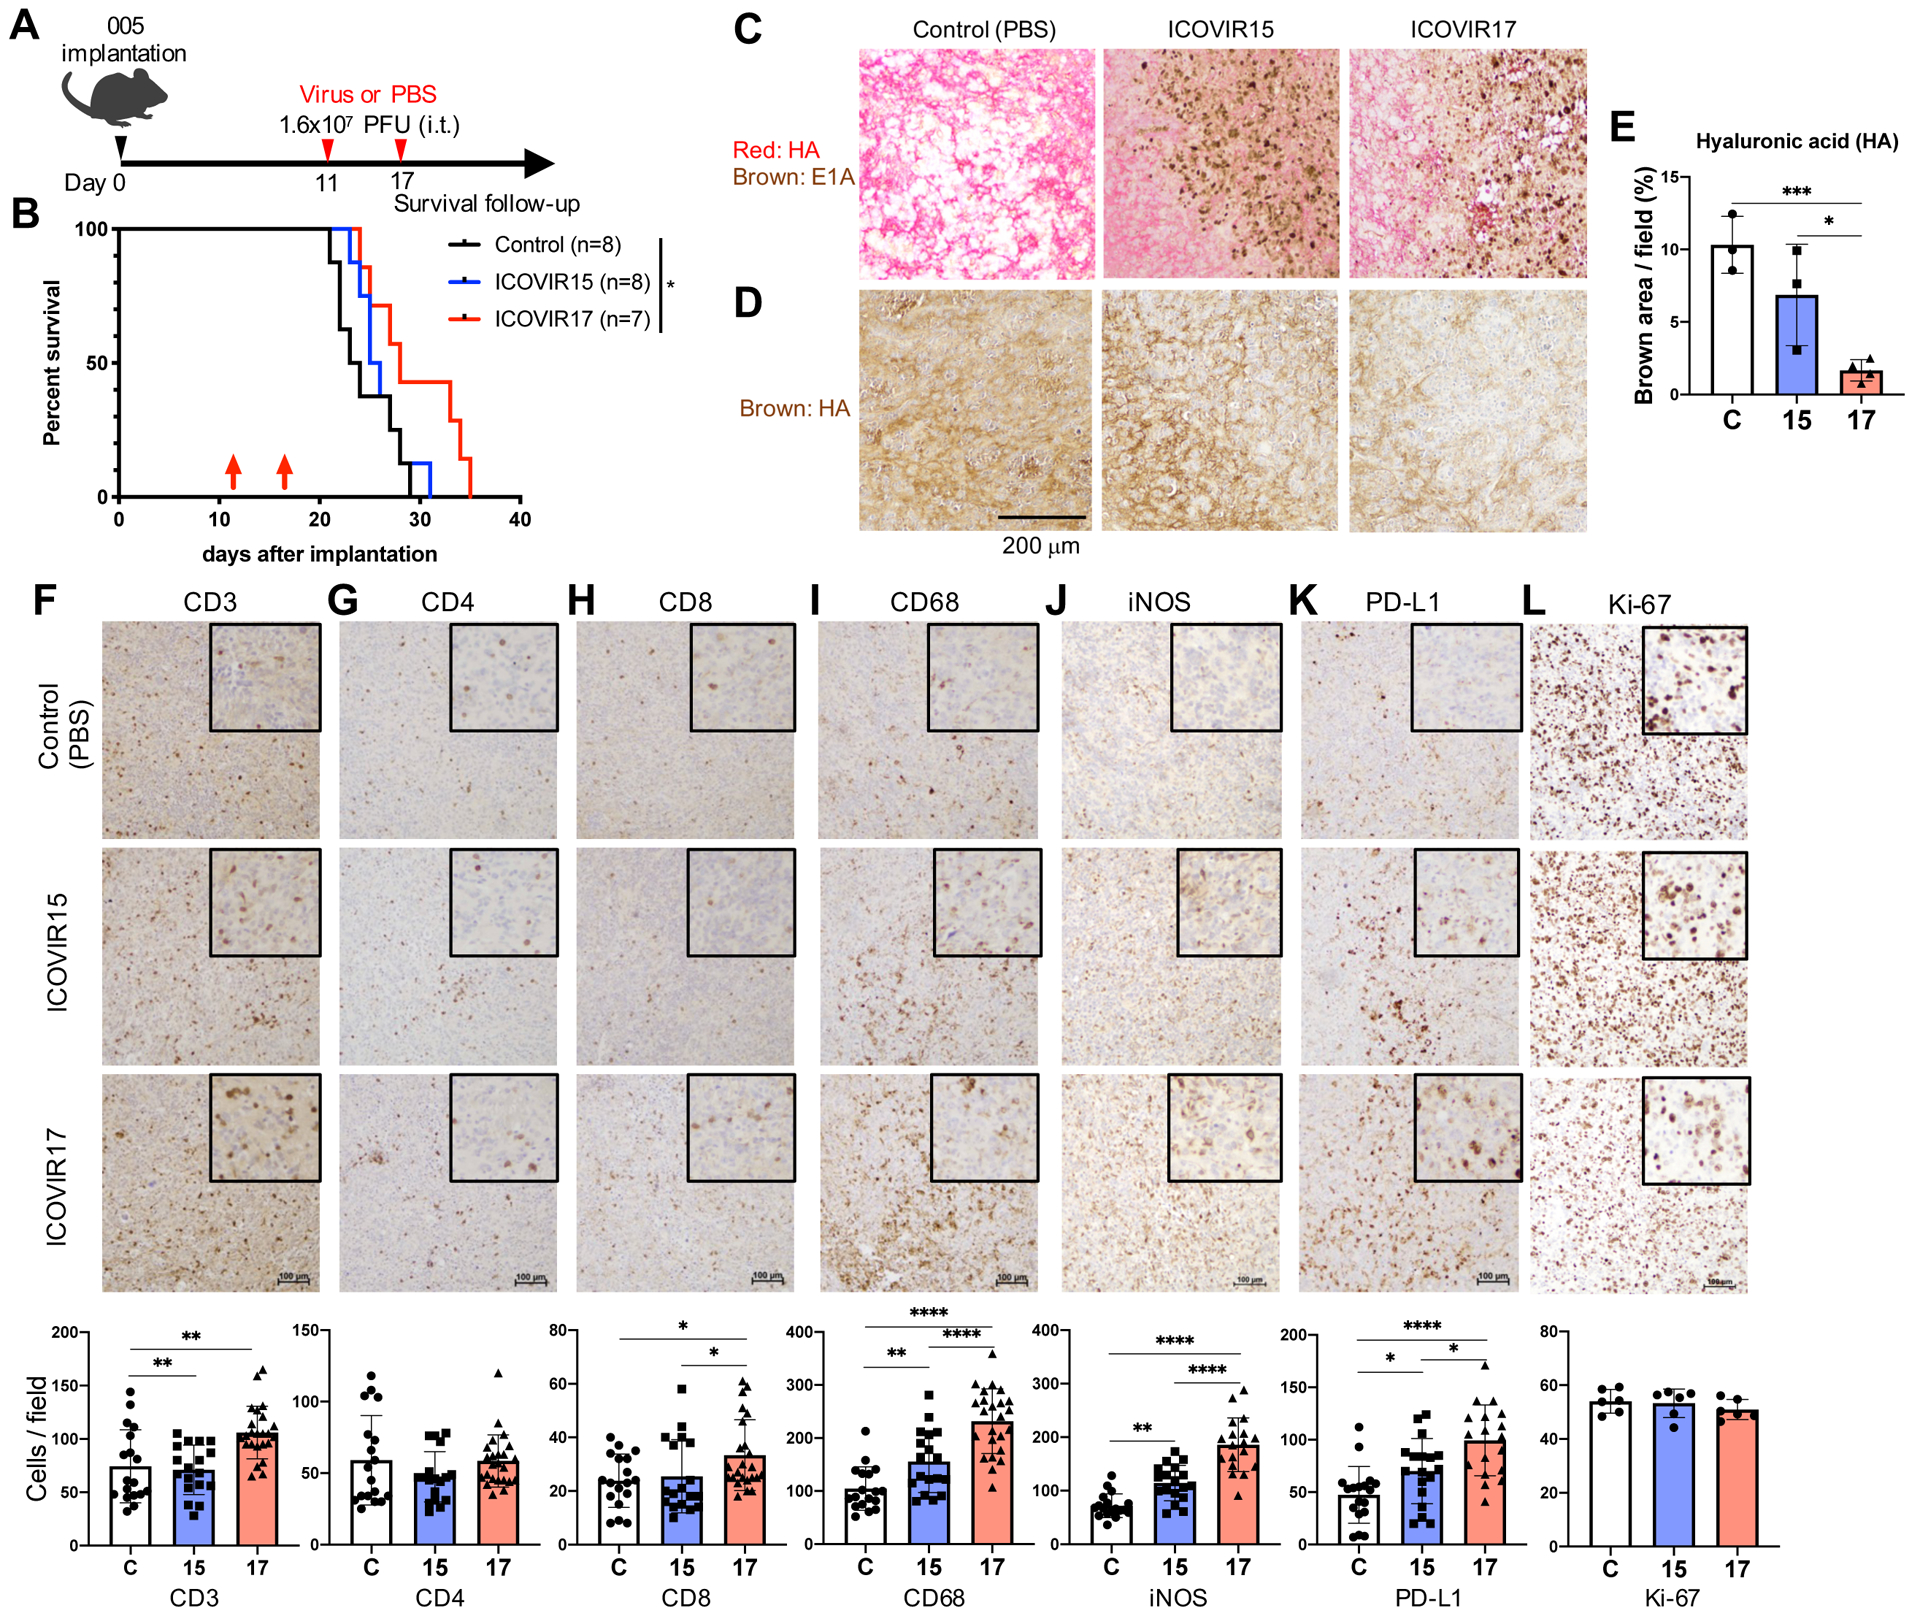
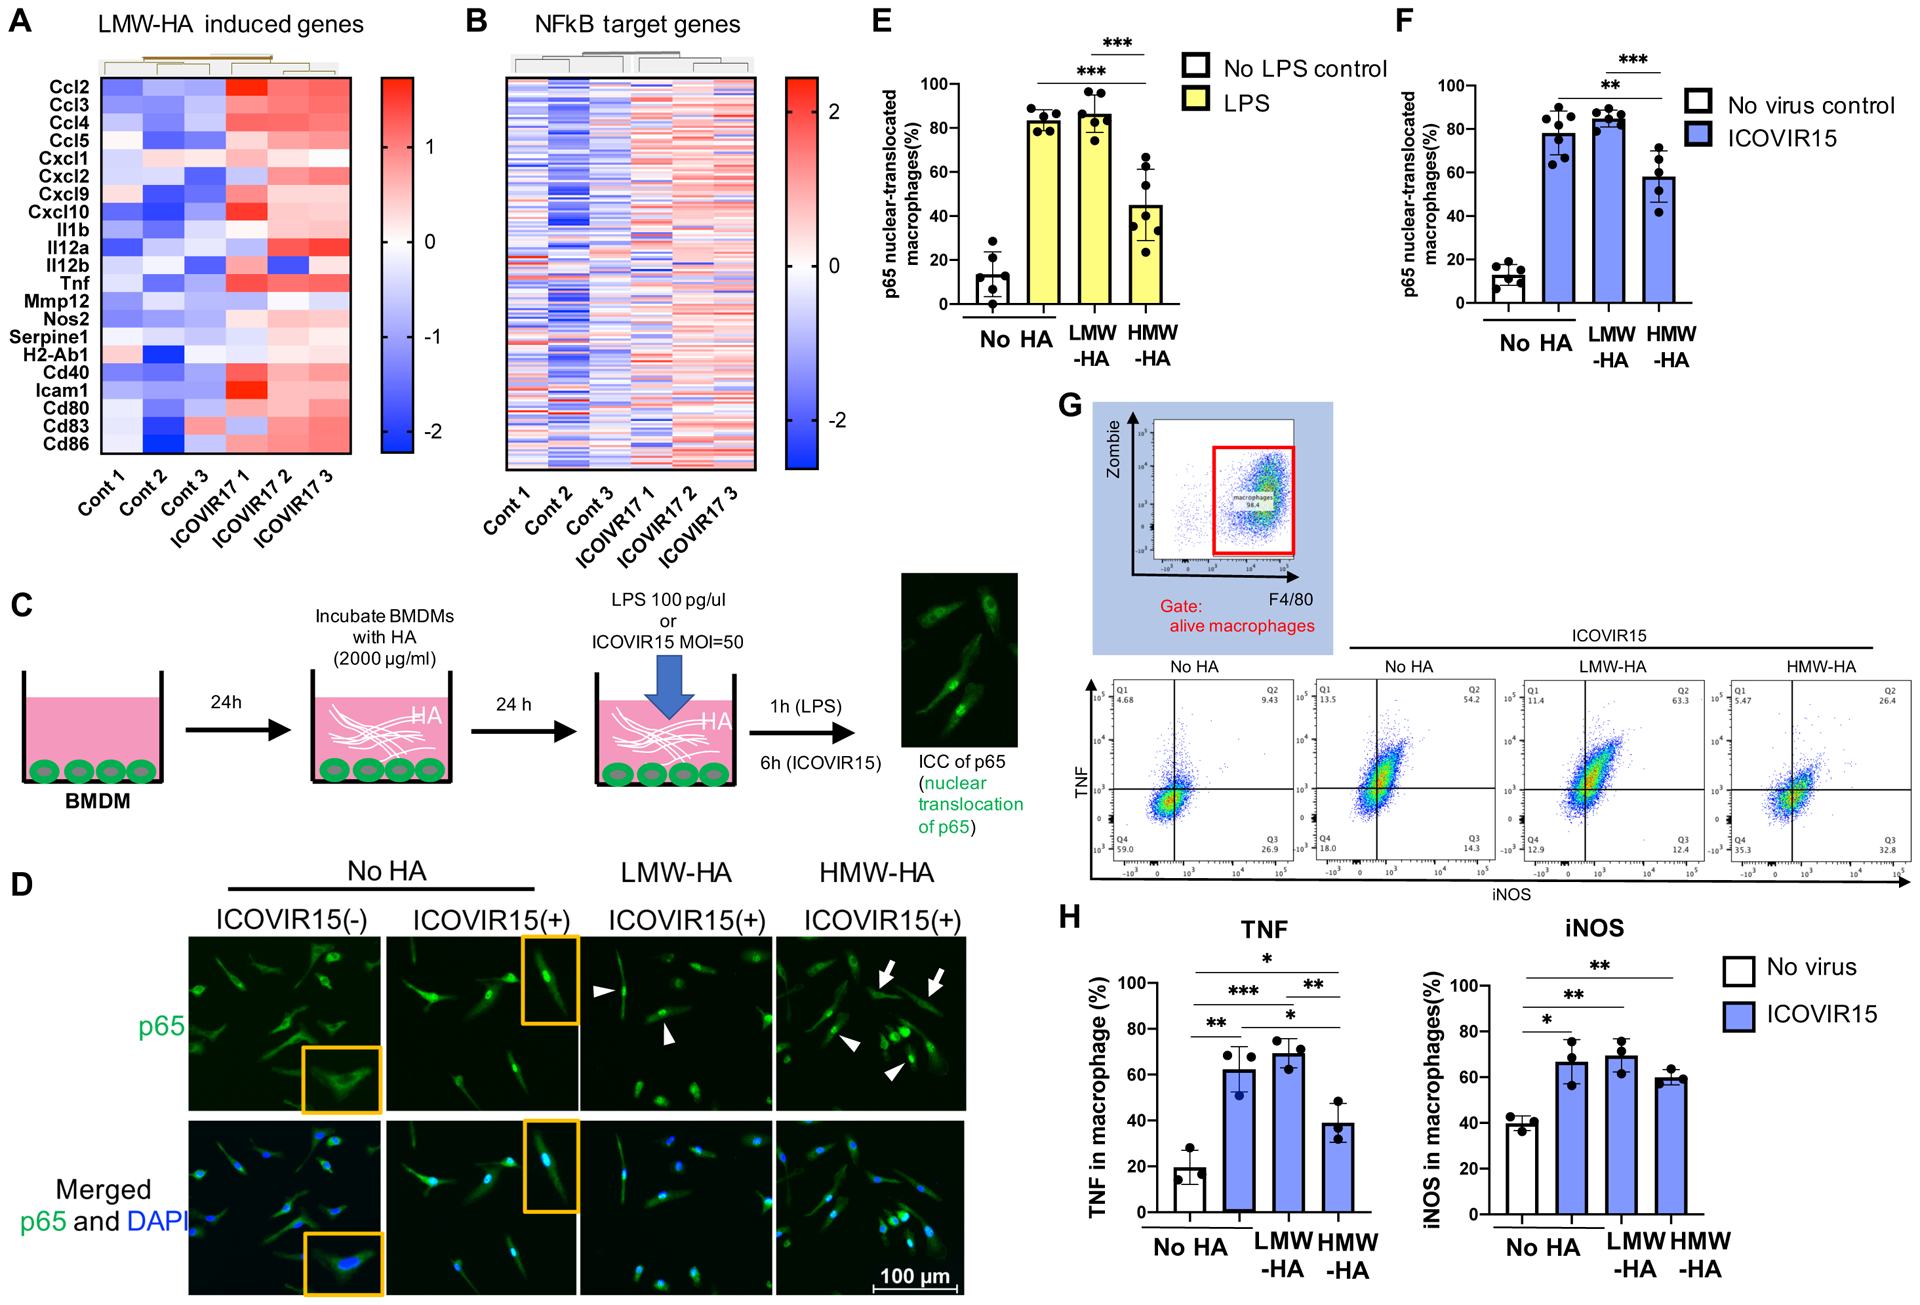
Experimental design: Presence of HA was examined in patient and murine GBM. Hyaluronidase-expressing oncolytic adenovirus, ICOVIR17, and its parental virus, ICOVIR15, without transgene, were tested to determine if they increased animal survival and modulated the immune tumor microenvironment (TME) in orthotopic GBM. HA regulation of NF-κB signaling was examined in virus-infected murine macrophages. We combined ICOVIR17 with PD-1 checkpoint blockade and assessed efficacy and determined mechanistic contributions of tumor-infiltrating myeloid and T cells.

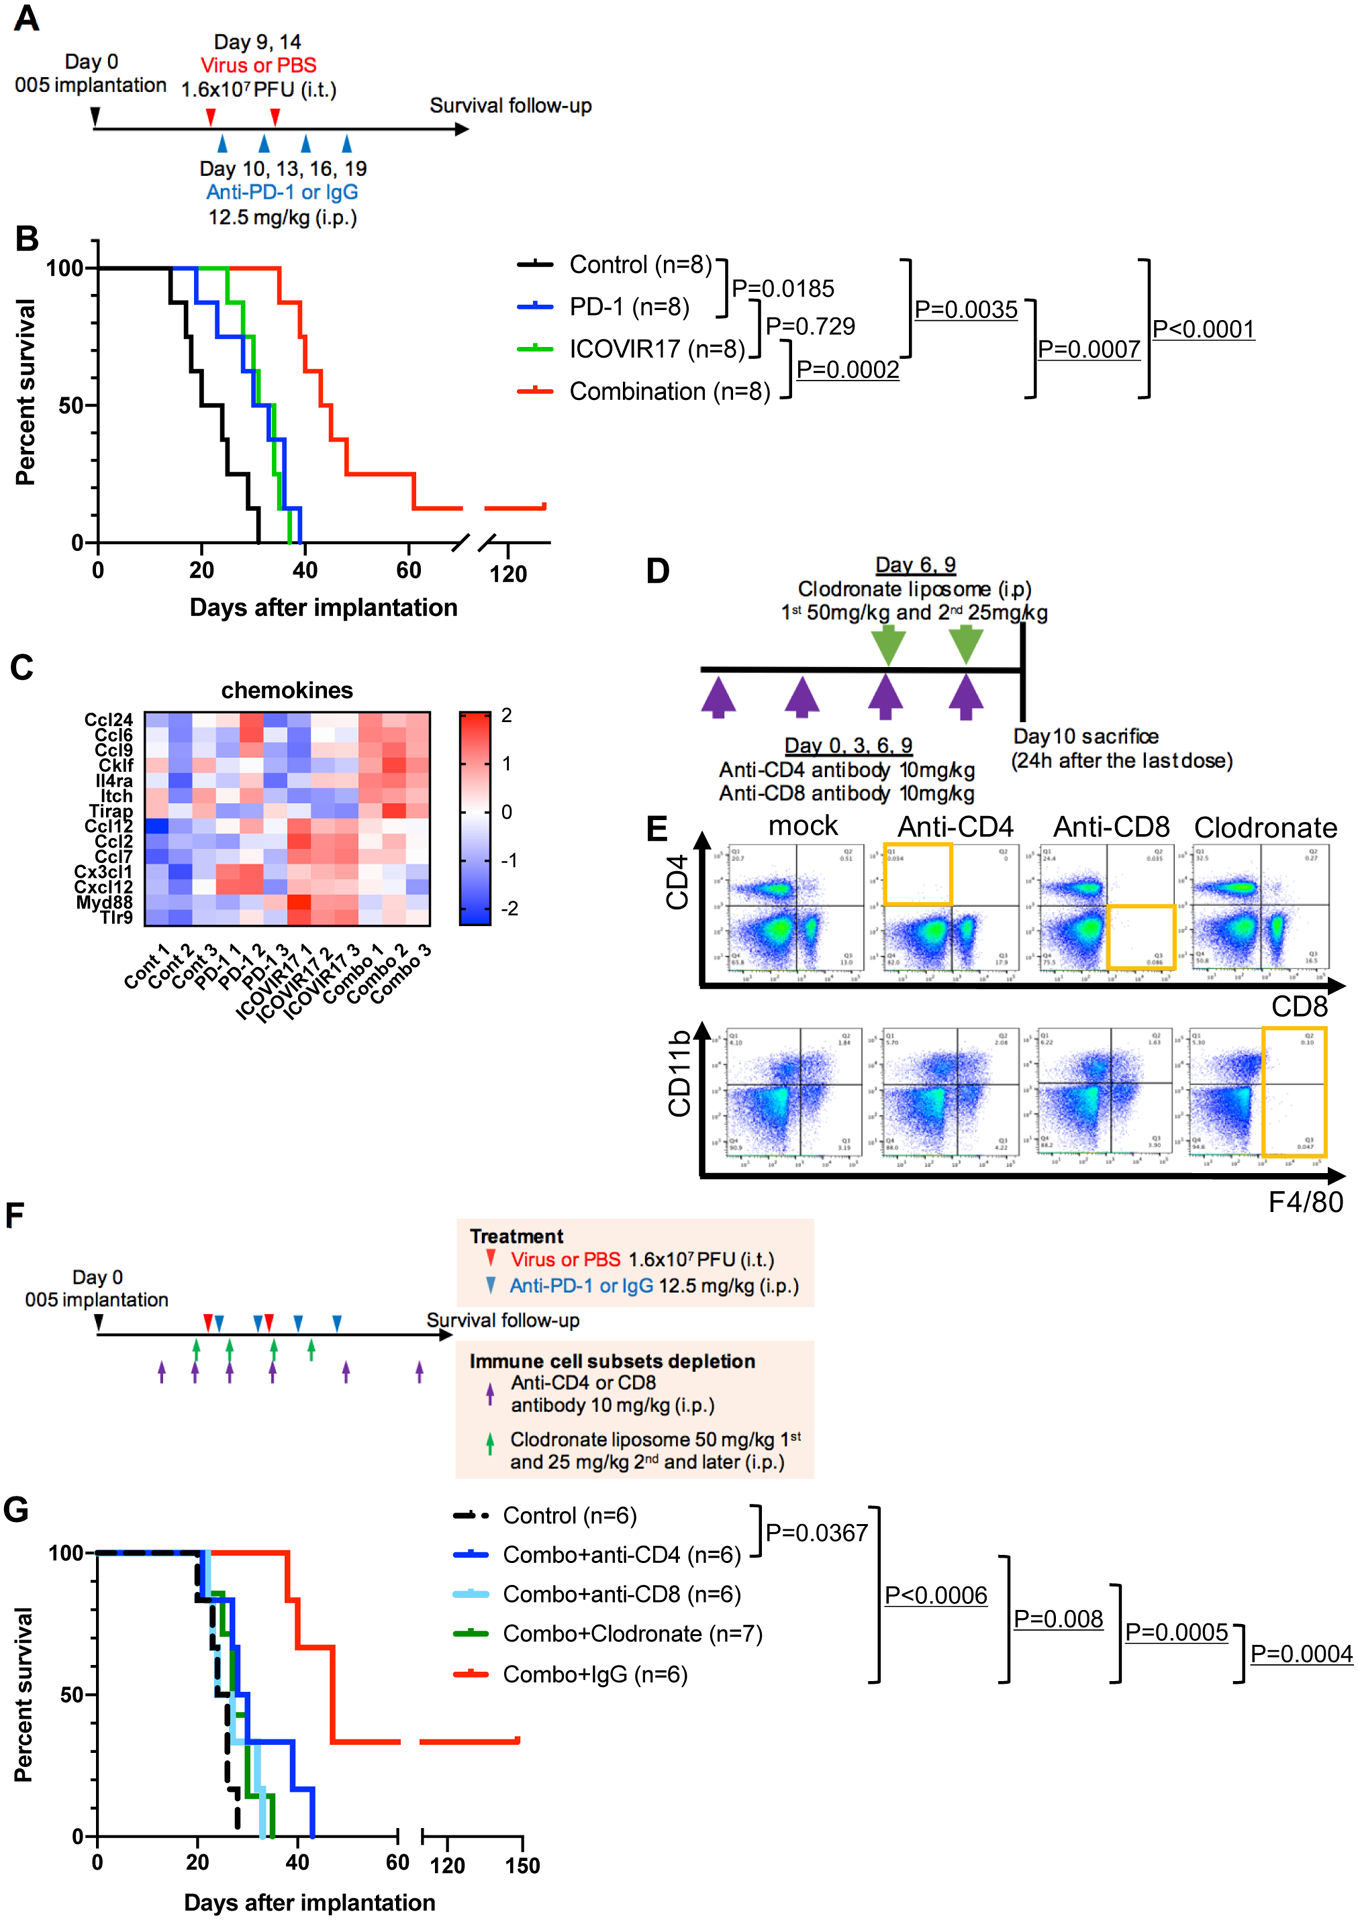
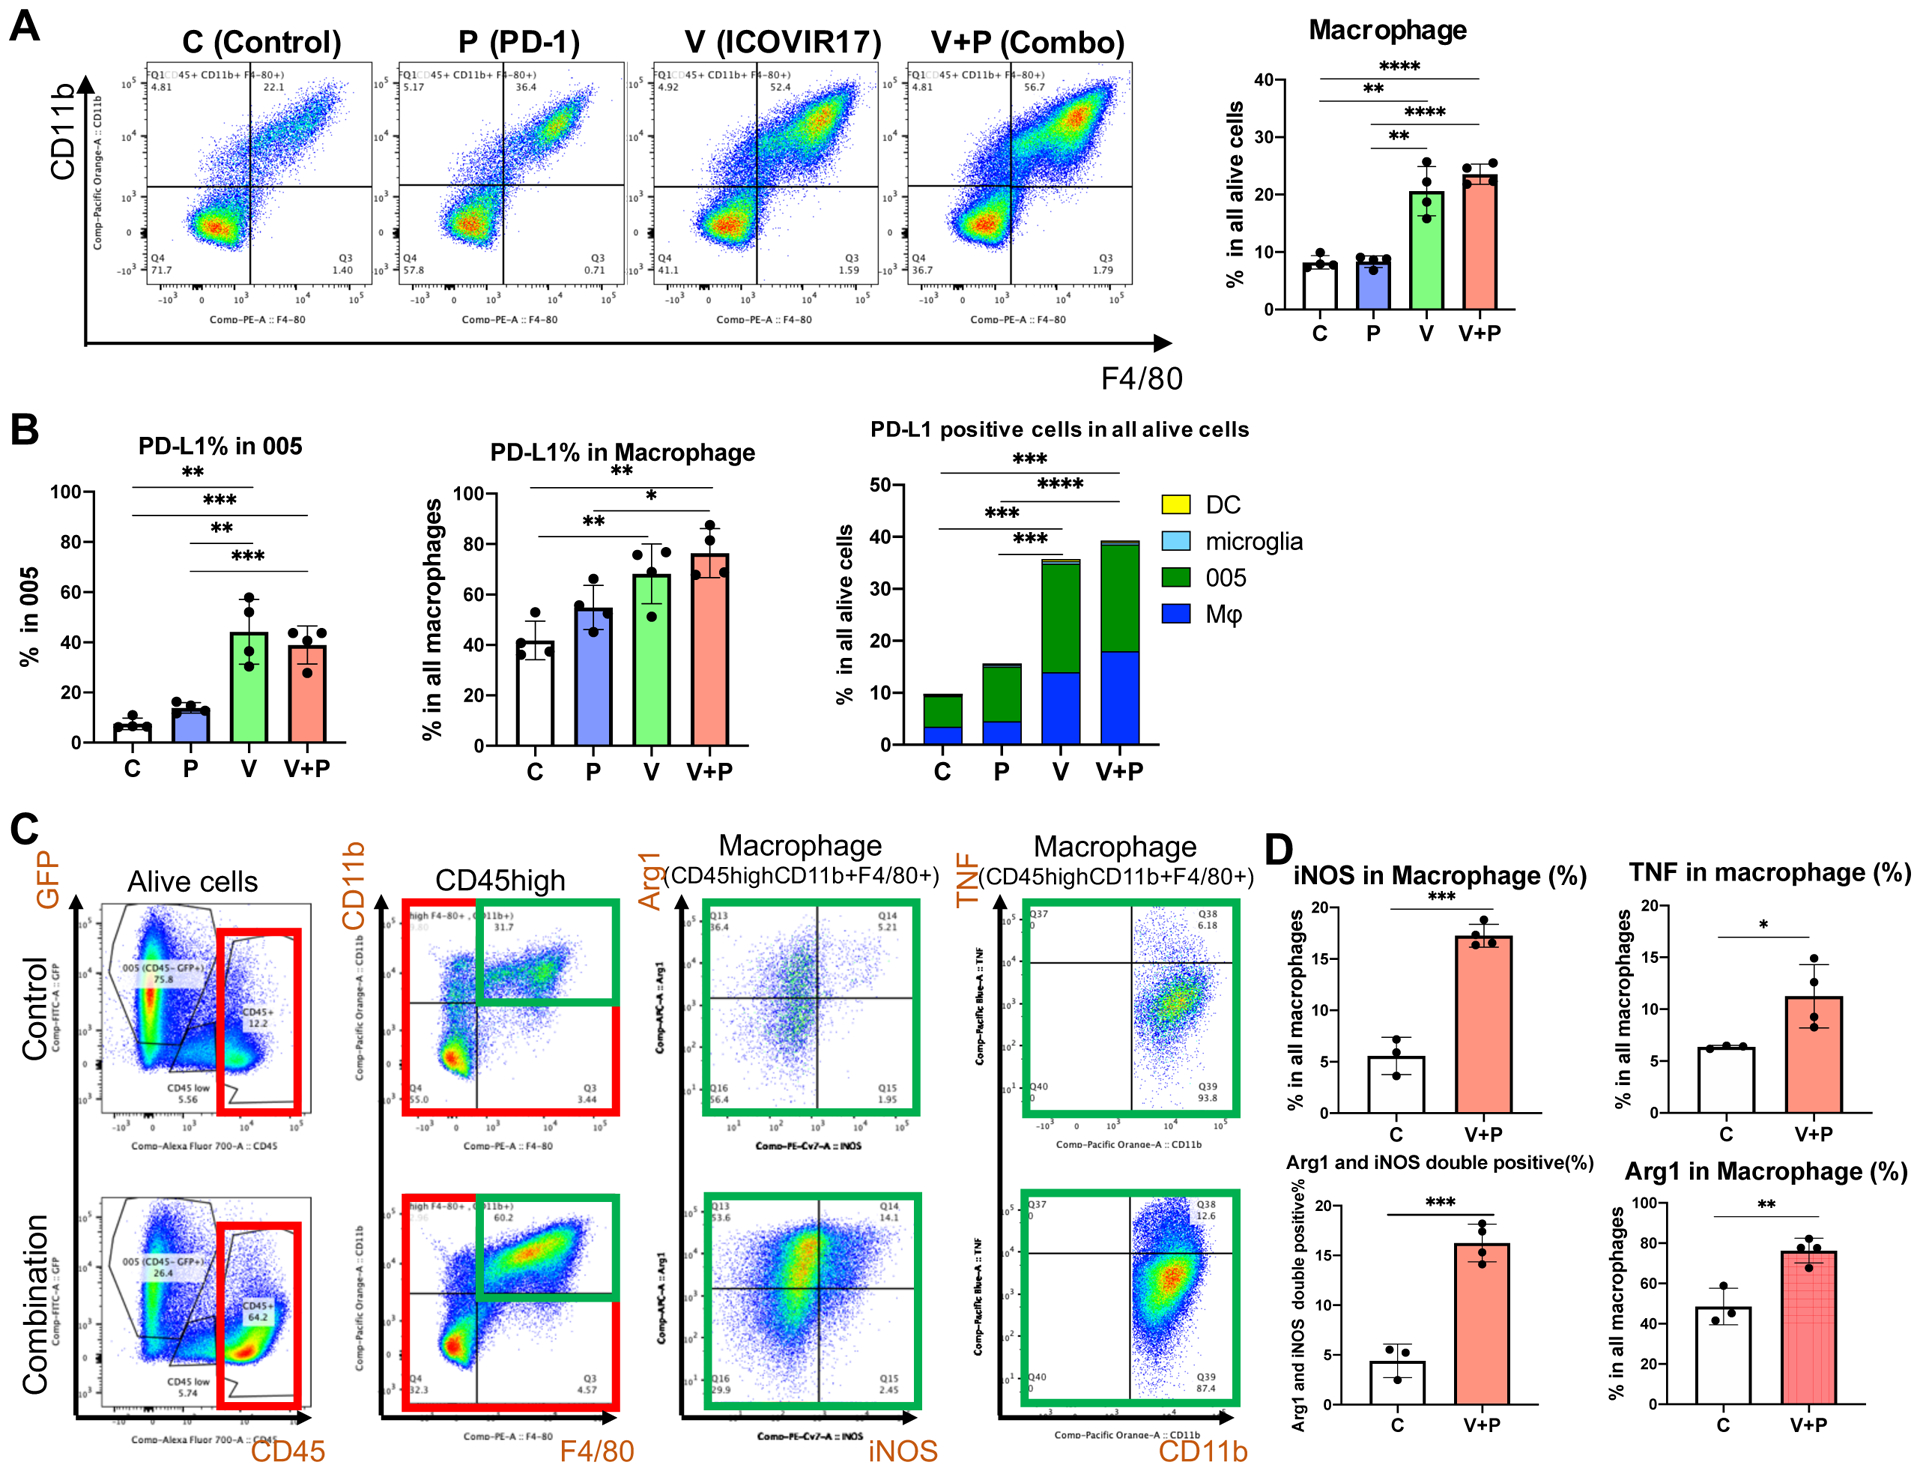
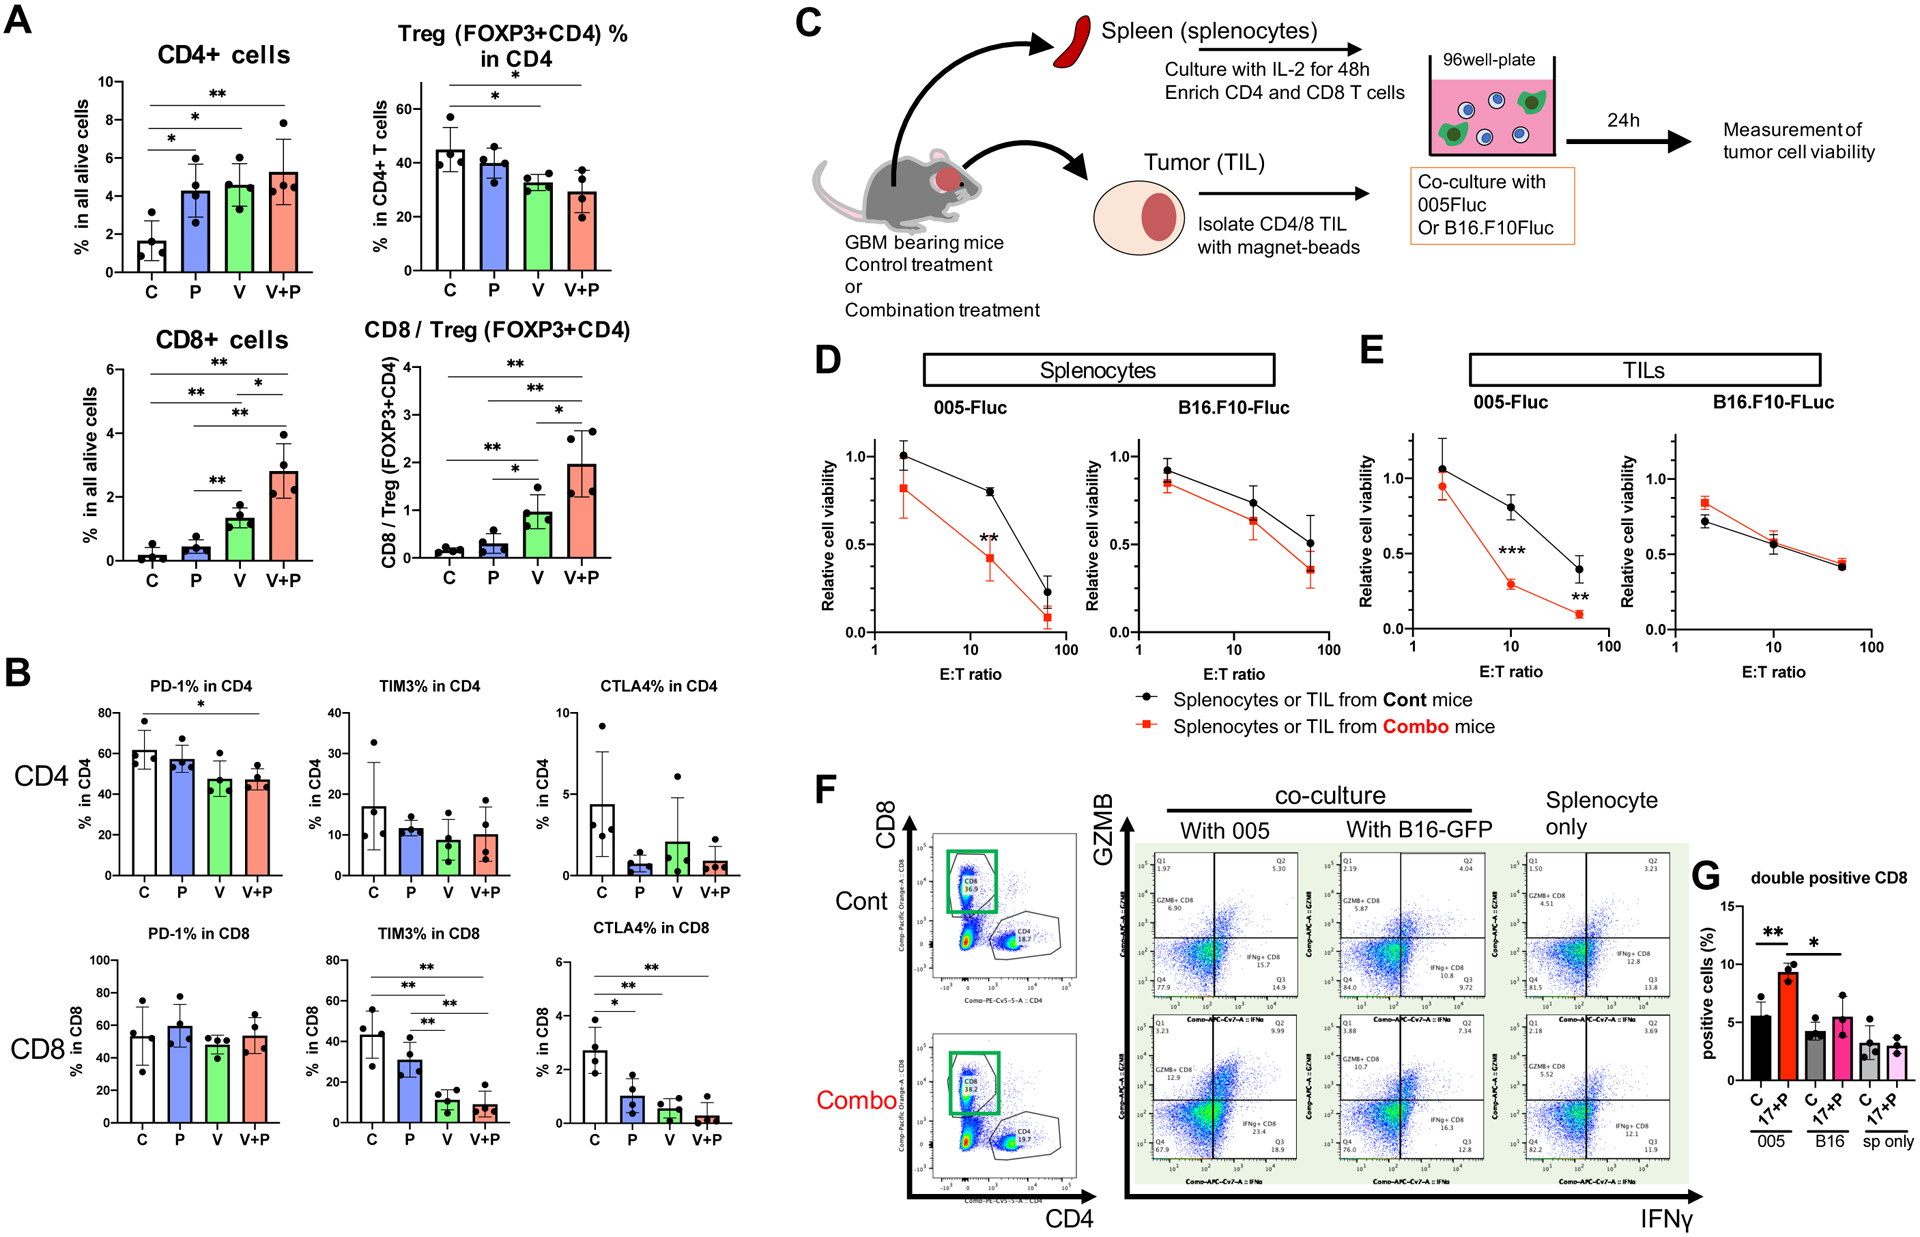
Results: Treatment of murine orthotopic GBM with ICOVIR17 increased tumor-infiltrating CD8+ T cells and macrophages, and upregulated PD-L1 on GBM cells and macrophages, leading to prolonged animal survival, compared with control virus ICOVIR15. High molecular weight HA inhibits adenovirus-induced NF-κB signaling in macrophages in vitro, linking HA degradation to macrophage activation. Combining ICOVIR17 with anti-PD-1 antibody further extended the survival of GBM-bearing mice, achieving long-term remission in some animals. Mechanistically, CD4+ T cells, CD8+ T cells, and macrophages all contributed to the combination therapy that induced tumor-associated proinflammatory macrophages and tumor-specific T-cell cytotoxicity locally and systemically.

Conclusions: Our studies are the first to show that immune modulatory ICOVIR17 has a dual role of mediating degradation of HA within GBM ECM and subsequently modifying the immune landscape of the TME, and offers a mechanistic combination immunotherapy with PD-L1/PD-1 blockade that remodels innate and adaptive immune cells.


Conflict of interest statement

Conflict of interest disclosore

R. Alemany reports personal fees from VCN Biosciences outside the submitted work, as well as has a patent for hyaluronidase-armed oncolytic adenoviruses issued. S.D. Rabkin reports grants from NIH during the conduct of the study, personal fees from Replimune and from Cellinta outside the submitted work, and coinventor on patents relating to oncolytic herpes simplex viruses, owned and managed by Georgetown University and Massachusetts General Hospital, which have received royalties from Amgen and ActiVec Inc. K. Shah owns equity in and is a member of the Board of Directors, AMASA Therapeutics, Inc., a company developing cell-based therapies for cancer. K. Shah’s interests were reviewed and are managed by Brigham and Women’s Hospital and Partners HealthCare in accordance with their conflict of interest policies. No disclosures were reported by the other authors.

Figures

Figure 1.
Figure 1.. Hyaluronan (HA) is abundant in the extracellular matrix of glioblastoma.
A and B, HA staining in human normal brain (A) and glioblastoma samples (B). Bovine hyaluronidase was applied before HA staining for negative control samples. Scale bar=500 μm. C, Image J quantification of HA area (%) using 4 microscopic fields per tumor shown in A and B. Data are mean ± SD. *** p<0.005, **** p<0.0001 with unpaired t-test (two-tailed) compared with human brain. D, Double staining of HA (red) and CD3 (brown) in human glioblastoma. Left, Lower magnification microscopic field containing both HA-high and HA-low areas. Scale bar=200 μm. Right, Higher magnification images showing HA-low and HA-high areas. Scale bar=100 μm. E-I, Characterization of murine 005 glioblastoma in C57BL/6 mice. E, A brain coronal section with a magnified view at the tumor border showing Hematoxylin and Eosin staining (H&E), GFP-labeled 005 cells, and HA staining. T, tumor; B, brain. Scale bar=100 μm. F, Immunohistochemistry and immunofluorescence for marker gene expression. Scale bar=100 μm. G, Double staining of immune cell markers (CD4, CD8 and CD68 in brown) and HA (in red) in murine glioblastoma 005. Nuclear counterstaining with hematoxylin. H, Quantification of immune cells based on the images shown in G. Data are mean ± SD. * p<0.05, ** p<0.01 with unpaired t-test (two-tailed). I, NanoString gene expression analysis of orthotopic murine glioblastoma models (005, GL261). Gene expression relative to that of murine melanoma (D4M3A) is presented. Scale on the right is log2 fold change.
Figure 2.
Figure 2.. Intratumoral injections of ICOVIR17 degraded HA, prolonged survival, increased tumor-infiltrating immune cells and upregulated PD-L1 in mice bearing orthotopic 005 glioblastoma.
A, Treatment schema of the survival experiment. C57BL/6 mice were implanted with 005 cells into the brain (1.2 × 10⁵ cells/mouse) on day 0. On days 11 and 17, PBS or virus (ICOVIR15 or ICOVIR17) were injected intratumorally (1.6 × 10⁷ PFU/mouse). B, Kaplan-Meier survival analysis of 005-bearing mice treated with PBS (control), ICOVIR15, or ICOVIR17. Arrows indicate treatments. * p<0.05 (log-rank analysis) comparing control and ICOVIR17. C, Double staining of hyaluronic acid (HA, red) and E1A (adenovirus early gene, brown) at 5 days after single virus injection. Scale bar=200 μm. D, HA staining (HA, brown) Scale bar=200 μm. E, Quantification of HA area. * p<0.05, *** p<0.005 with unpaired t-test (two-tailed). F-L, Immunohistochemistry of immune markers, CD3 (F), CD4 (G), CD8 (H), CD68 (I), iNOS (J), PD-L1 (K), and Ki-67 (L), in 005 glioblastoma treated with PBS (Control), ICOVIR15, or ICOVIR17. Scale bar, 100 μm. Insets: higher magnification images to show details of staining. Quantification is shown below for each marker. Number of positive cells from randomly chosen 6 fields/tumor section/mouse were counted, and the mean ± SD of all fields across the mice (N=4/group) are presented. C: Control group, 15: ICOVIR15-treated group, 17: ICOVIR17-treated group. Data were analyzed by unpaired t test (two-tailed); * p<0.05, ** p<0.01, **** p<0.0001.
Figure 3.
Figure 3.. HMW-HA and LMW-HA differentially impact adenovirus-induced NFkB activation in bone marrow derived macrophages.
A and B, NanoString transcriptome analysis of 005 glioblastoma in the brain after treatment with PBS (Cont) or ICOVIR17. A, LMW-HA-induced genes. B, NFkB target genes. N=3 individual mice / group. C, Experimental design. BMDM, Murine bone marrow-derived macrophage. LPS, lipopolysaccharide. D-F, p65 immunofluorescence in BMDMs after stimulation with ICOVIR15 (D and F) or lipopolysaccharide (LPS, E) in the presence or absence of LMW-HA and HMW-HA. Insets in D show representative cells without and with nuclear p65 immunopositivity. Arrows and arrowheads indicate examples of cells without and with nuclear p65 translocation, respectively. E and F showing the fraction of cells having p65 in the nuclei. Student t-test (two-tailed); ** p<0.001, *** p<0.0005. G, Intracellular flow cytometry for TNF and iNOS in BMDMs. BMDMs were cultured with LMW-HA or HMW-HA for 24 hours, followed by ICOVIR15 infection. Staining was done 6 hours post infection. H, Quantification of G. TNF (left) and iNOS (right) in BMDMs after stimulation with ICOVIR15 in the presence or absence of LMW-HA and HMW-HA. *, P < 0.05; **, P < 0.01; ***, P < 0.001. Data are mean ± SD in E, F, and H.
Figure 4.
Figure 4.. Efficacy of combination therapy of ICOVIR17 and anti-PD-1 requires CD4+ and CD8+ T cells and macrophages.
A, Treatment schema for the survival study of combination therapy of ICOVIR17 and anti-PD-1 antibody. B, Kaplan-Meier survival curves. Statistical significance was assessed between indicated groups. C, NanoString RNA analysis reveals differential expression of chemokines between ICOVIR17 alone group versus combination group (Comb). N=3 / group. D and E, In vivo depletion of immune subsets. D, Experimental schema. E, Flow cytometric analysis of splenocytes confirming successful depletion of respective target cells in the spleen. F and G, In vivo depletion of immune subsets. F, Treatment schema for the survival study of combination therapy of ICOVIR17 and anti-PD-1 antibody with and without depletion of specific immune cell subsets. G, Kaplan-Meier survival curves. Combo, combination therapy of ICOVIR17 and anti-PD-1 antibody. In B and G, P values are from log-rank test. Statistically significant differences in comparisons after the correction for multiple comparisons (Bonferroni method) are underlined.
Figure 5.
Figure 5.. Combination therapy increased TAMs.
Flow cytometric analysis of 005 tumors after treatments. Representative plots and quantification of CD11b+ F4/80+ TAMs (A), PD-L1+ cells (B), and Arg1+, iNOS+, TNF+ TAMs (C). N=4 mice / group. C: control group, P: anti-PD-1 antibody monotherapy group, V: ICOVIR17 monotherapy group, V+P: ICOVIR17 and anti-PD-1 combination group. D, Quantification of C, showing % of macrophages positive for the indicated marker(s). Data are mean ± SD. *p<0.05, **p< 0.01, ***p< 0.001, ****p< 0.0001 assessed by Student’s t test (two-tailed) between indicated groups.
Figure 6.
Figure 6.. Combination therapy induced tumor specific cytotoxicity in local and peripheral T cells.
A and B, Flow cytometric analysis of tumor-infiltrating T cells (TILs) collected from orthotopic 005 glioblastoma tumors after treatment with control (C), anti-PD-1 (P), ICOVIR17 (V) or ICOVIR17+anti-PD-1 (V+P). A, analysis of total CD4+ and CD4+ FOXP3+ T regulatory cells (Treg) (upper panels) and CD8+ and CD8+/Treg ratio (lower panels). B, Analysis of T cell exhaustion/checkpoint markers (PD-1, TIM3, and CTLA4) in CD4+ cells (upper panels) and CD8+ cells (lower panels). * p< 0.05, ** p< 0.01 (two-tailed t-test) between indicated groups. C, Experimental schematic. D and E, in vitro cytotoxic assays of T cells harvested from spleens (D) and 005 glioblastomas (E) in control mice (black circles and lines) and combination therapy mice (red squares and lines). ** p< 0.01, *** p< 0.001 (two-tailed t-test). See Supplementary Figure S8B for T cell enrichment from tumors. F, Intracellular flow cytometric analysis of granzyme B (GZMB) and interferon g (IFNγ) in spleen-derived T cells after their 24h-exposure to 005 glioblastoma or B16 melanoma cells. G, Quantification of CD8+ cells double positive for GZMB and IFNγ in total CD8+ cells. C, control mice; 17+P, combination therapy mice. Sp only, splenocytes alone without tumor cells. * p< 0.05, ** p<0.01 (two-tailed t-test) between indicated groups. See Supplementary Fig. S9C for gating using FMO (fluorescence minus one controls). Data are mean ± SD.

Similar articles

Cited by

References

    1. Balkwill FR, Capasso M, Hagemann T. The tumor microenvironment at a glance. J Cell Sci 2012;125(Pt 23):5591–6 doi 10.1242/jcs.116392. - DOI - PubMed
    1. Klemm F, Joyce JA. Microenvironmental regulation of therapeutic response in cancer. Trends in Cell Biology 2015;25(4):198–213 doi 10.1016/j.tcb.2014.11.006. - DOI - PMC - PubMed
    1. Broekman ML, Maas SLN, Abels ER, Mempel TR, Krichevsky AM, Breakefield XO. Multidimensional communication in the microenvirons of glioblastoma. Nat Rev Neurol 2018;14(8):482–95 doi 10.1038/s41582-018-0025-8. - DOI - PMC - PubMed
    1. Charles NA, Holland EC, Gilbertson R, Glass R, Kettenmann H. The brain tumor microenvironment. Glia 2012;60(3):502–14 doi 10.1002/glia.21264. - DOI - PubMed
    1. Quail DF, Joyce JA. The Microenvironmental Landscape of Brain Tumors. Cancer Cell 2017;31(3):326–41 doi 10.1016/j.ccell.2017.02.009. - DOI - PMC - PubMed

Publication types

MeSH terms