

Phosphorylation on PstP Regulates Cell Wall Metabolism and Antibiotic Tolerance in Mycobacterium smegmatis
- PMID: 33257524
- PMCID: PMC7847547
- DOI: 10.1128/JB.00563-20
Phosphorylation on PstP Regulates Cell Wall Metabolism and Antibiotic Tolerance in Mycobacterium smegmatis
Abstract
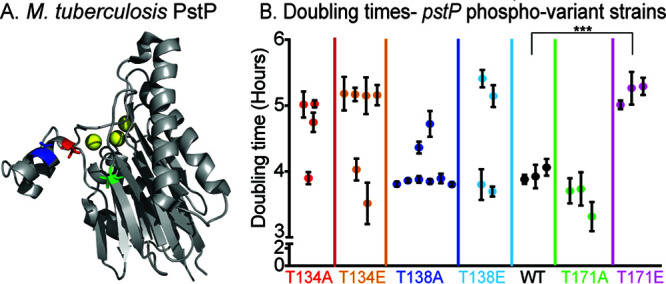
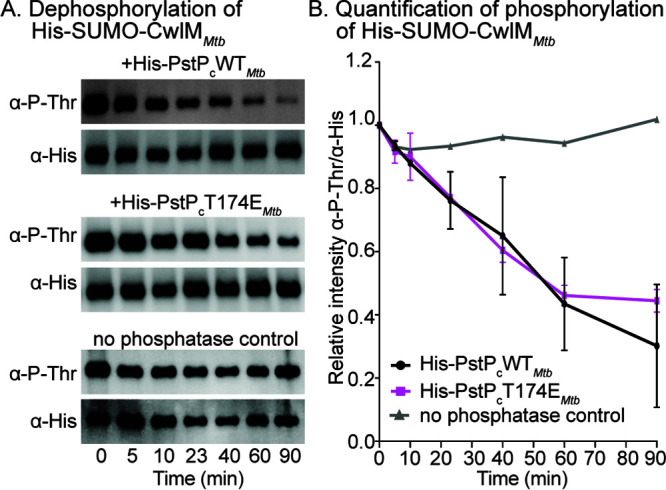
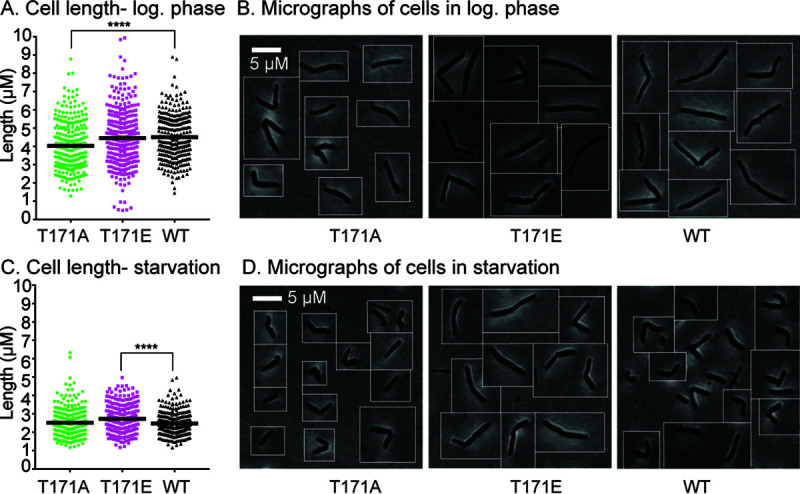
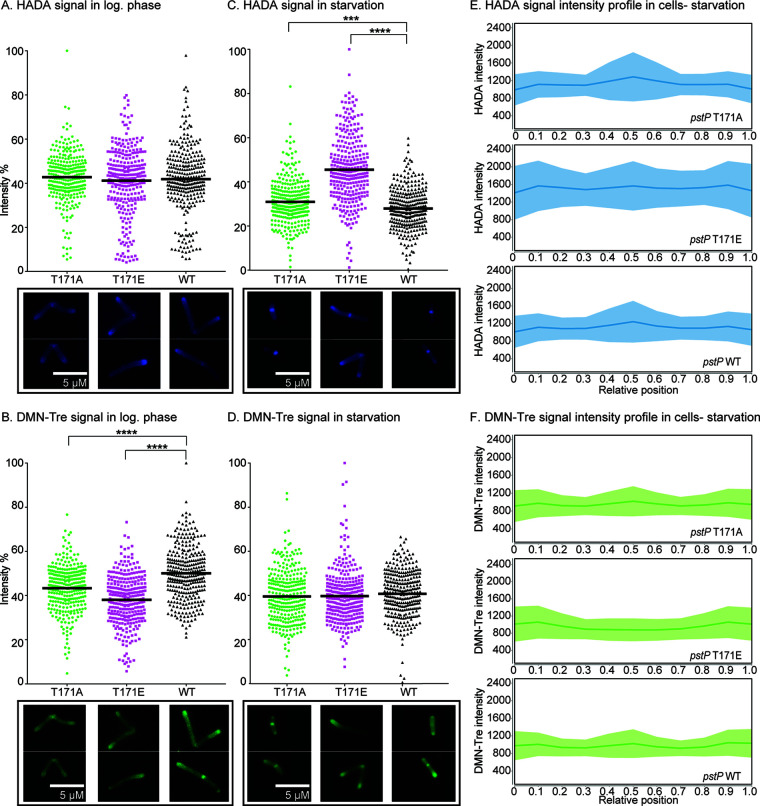
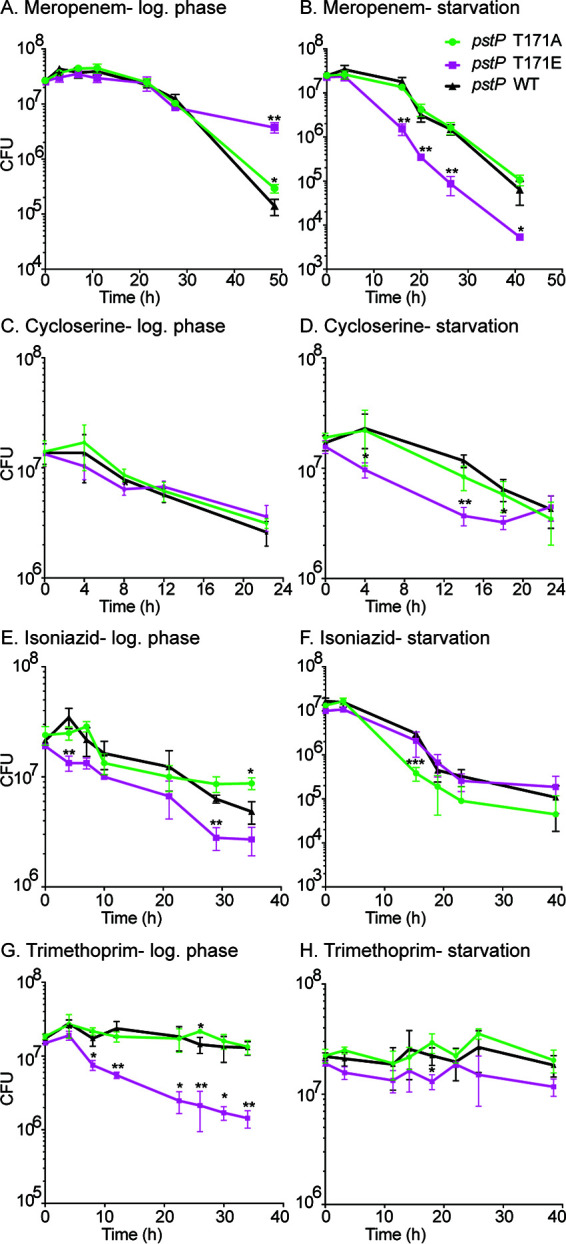
Mycobacterium tuberculosis and its relatives, like many bacteria, have dynamic cell walls that respond to environmental stresses. Modulation of cell wall metabolism in stress is thought to be responsible for decreased permeability and increased tolerance to antibiotics. The signaling systems that control cell wall metabolism under stress, however, are poorly understood. Here, we examine the cell wall regulatory function of a key cell wall regulator, the serine/threonine phosphatase PstP, in the model organism Mycobacterium smegmatis We show that the peptidoglycan regulator CwlM is a substrate of PstP. We find that a phosphomimetic mutation, pstP T171E, slows growth, misregulates both mycolic acid and peptidoglycan metabolism in different conditions, and interferes with antibiotic tolerance. These data suggest that phosphorylation on PstP affects its activity against various substrates and is important in the transition between growth and stasis.IMPORTANCE Regulation of cell wall assembly is essential for bacterial survival and contributes to pathogenesis and antibiotic tolerance in mycobacteria, including pathogens such as Mycobacterium tuberculosis However, little is known about how the cell wall is regulated in stress. We describe a pathway of cell wall modulation in Mycobacterium smegmatis through the only essential Ser/Thr phosphatase, PstP. We showed that phosphorylation on PstP is important in regulating peptidoglycan metabolism in the transition to stasis and mycolic acid metabolism in growth. This regulation also affects antibiotic tolerance in growth and stasis. This work helps us to better understand the phosphorylation-mediated cell wall regulation circuitry in Mycobacteria.
Keywords: CwlM; Mycobacteria; PstP; antibiotic tolerance; cell wall metabolism; dephosphorylation; mycolic acid metabolism; peptidoglycan metabolism; serine/threonine phosphatase; starvation.
Copyright © 2021 American Society for Microbiology.
Figures
Similar articles
-
Mycobacterial serine/threonine phosphatase PstP is phosphoregulated and localized to mediate control of cell wall metabolism.Mol Microbiol. 2022 Jul;118(1-2):47-60. doi: 10.1111/mmi.14951. Epub 2022 Jun 20. Mol Microbiol. 2022. PMID: 35670057 Free PMC article.
-
Mycobacterial phosphatase PstP regulates global serine threonine phosphorylation and cell division.Sci Rep. 2019 Jun 6;9(1):8337. doi: 10.1038/s41598-019-44841-9. Sci Rep. 2019. PMID: 31171861 Free PMC article.
-
PknB kinase activity is regulated by phosphorylation in two Thr residues and dephosphorylation by PstP, the cognate phospho-Ser/Thr phosphatase, in Mycobacterium tuberculosis.Mol Microbiol. 2003 Sep;49(6):1493-508. doi: 10.1046/j.1365-2958.2003.03657.x. Mol Microbiol. 2003. PMID: 12950916
-
Structure/function studies of Ser/Thr and Tyr protein phosphorylation in Mycobacterium tuberculosis.J Mol Microbiol Biotechnol. 2005;9(3-4):167-81. doi: 10.1159/000089645. J Mol Microbiol Biotechnol. 2005. PMID: 16415590 Review.
-
Division and cell envelope regulation by Ser/Thr phosphorylation: Mycobacterium shows the way.Mol Microbiol. 2010 Mar;75(5):1064-77. doi: 10.1111/j.1365-2958.2009.07041.x. Mol Microbiol. 2010. PMID: 20487298 Review.
Cited by
-
Arginine methylation sites on SepIVA help balance elongation and septation in Mycobacterium smegmatis.Mol Microbiol. 2023 Feb;119(2):208-223. doi: 10.1111/mmi.15006. Epub 2022 Dec 4. Mol Microbiol. 2023. PMID: 36416406 Free PMC article.
-
Evolution and classification of Ser/Thr phosphatase PP2C family in bacteria: Sequence conservation, structures, domain distribution.PLoS One. 2025 May 19;20(5):e0322880. doi: 10.1371/journal.pone.0322880. eCollection 2025. PLoS One. 2025. PMID: 40388423 Free PMC article.
-
The Role of Phosphorylation and Acylation in the Regulation of Drug Resistance in Mycobacterium tuberculosis.Biomedicines. 2022 Oct 15;10(10):2592. doi: 10.3390/biomedicines10102592. Biomedicines. 2022. PMID: 36289854 Free PMC article. Review.
-
Protein Tyrosine and Serine/Threonine Phosphorylation in Oral Bacterial Dysbiosis and Bacteria-Host Interaction.Front Cell Infect Microbiol. 2022 Jan 11;11:814659. doi: 10.3389/fcimb.2021.814659. eCollection 2021. Front Cell Infect Microbiol. 2022. PMID: 35087767 Free PMC article. Review.
-
Mycobacterial serine/threonine phosphatase PstP is phosphoregulated and localized to mediate control of cell wall metabolism.Mol Microbiol. 2022 Jul;118(1-2):47-60. doi: 10.1111/mmi.14951. Epub 2022 Jun 20. Mol Microbiol. 2022. PMID: 35670057 Free PMC article.
References
-
- World Health Organization. 2019. Global tuberculosis report 2019. https://www.who.int/publications/i/item/global-tuberculosis-report-2019.
Publication types
MeSH terms
Substances
Grants and funding
LinkOut - more resources
Full Text Sources
Other Literature Sources
Medical
