. 2020 Dec 15;117(50):31591-31602.
doi: 10.1073/pnas.2020346117. Epub 2020 Nov 30.

Functional characterization of 67 endocytic accessory proteins using multiparametric quantitative analysis of CCP dynamics

Affiliations

Functional characterization of 67 endocytic accessory proteins using multiparametric quantitative analysis of CCP dynamics

Madhura Bhave et al. Proc Natl Acad Sci U S A. .

Abstract

Clathrin-mediated endocytosis (CME) begins with the nucleation of clathrin assembly on the plasma membrane, followed by stabilization and growth/maturation of clathrin-coated pits (CCPs) that eventually pinch off and internalize as clathrin-coated vesicles. This highly regulated process involves a myriad of endocytic accessory proteins (EAPs), many of which are multidomain proteins that encode a wide range of biochemical activities. Although domain-specific activities of EAPs have been extensively studied, their precise stage-specific functions have been identified in only a few cases. Using single-guide RNA (sgRNA)/dCas9 and small interfering RNA (siRNA)-mediated protein knockdown, combined with an image-based analysis pipeline, we have determined the phenotypic signature of 67 EAPs throughout the maturation process of CCPs. Based on these data, we show that EAPs can be partitioned into phenotypic clusters, which differentially affect CCP maturation and dynamics. Importantly, these clusters do not correlate with functional modules based on biochemical activities. Furthermore, we discover a critical role for SNARE proteins and their adaptors during early stages of CCP nucleation and stabilization and highlight the importance of GAK throughout CCP maturation that is consistent with GAK's multifunctional domain architecture. Together, these findings provide systematic, mechanistic insights into the plasticity and robustness of CME.

Keywords: CRISPRi screen; GAK; SNAREs; clathrin-mediated endocytosis; total internal reflection fluorescence microscopy.


Conflict of interest statement

The authors declare no competing interest.

Figures

Fig. 1.
Fig. 1.
Schematic representation of workflow and stages leading to CCV formation identified by cmeAnalysis. (A) Image series were analyzed via the cmeAnalysis or DASC processing pipelines. Clathrin-coated structures were detected, then tracked and processed. Only valid traces were partitioned by the cmeAnalysis pipeline into sCLSs and bona fide CCPs, based on a user-defined intensity threshold. In contrast, DASC (disassembly asymmetry score classification) takes into account both valid and rejected traces, as defined by cmeAnalysis, to measure total initiation rates of all clathrin-coated structures, and then, from valid traces only, classifies ACs, CCPs, and outlier traces in an intensity threshold-independent manner, instead relying on intensity fluctuations during CCP assembly and maturation (11). (B) sCLSs are small clathrin assemblies that never grow beyond a user-defined intensity threshold, because the partial clathrin coats fail to be stabilized and thus rapidly disassemble. (C) Nascent clathrin structures that are stabilized at the PM by a multitude of weak protein–protein interactions are defined as bona fide CCPs that can complete their maturation and internalize cargo as productive CCPs. (D) Maturation of bona fide CCPs involves their invagination and finally dynamin-catalyzed fission to release cargo-laden clathrin-coated vesicles (CCVs). A subset of stabilized coats also fail to mature and disassembled as abortive pits. Six parameters quantified by cmeAnalysis (i–vi) are indicated in black, and the CCP behaviors they measure are indicated in green.
Fig. 2.
Fig. 2.
Cluster analysis and summary of EAP phenotypes. (A) Two independent clustering methods (k-means and APC) identified 10 phenotypic clusters. Alluvial plot representing the compositional changes in the clusters determined either by the k-means or the APC clustering method (Materials and Methods). The width of the blocks represents the size of the cluster, and the width of a stream field connecting two blocks represents the number of components differentially assigned by the two methods. As indicated, k-means and APC clusters are very similar in composition. (B) Heatmap reporting percent differences (%Δ) in the six indicated parameters derived from cmeAnalysis measurements of all studied EAPs, grouped in clusters obtained by the k-means clustering method, visualizing the phenotypic signature of each protein. (C) Circular dendrogram visualizing the partitioning of each functional EAP group (I–IX) into the various clusters determined by the k-means clustering method. EAPs denoted with an asterisk (*) were depleted using siRNA.
Fig. 3.
Fig. 3.
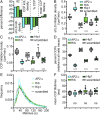
Effect of cluster 1 EAPs on nucleation and initiation of CCP growth (A). Percent difference plot of initiation density of sCLSs, initiation density of bona fide CCPs, percent CCPs, and mean lifetimes of CCPs. Results are expressed as %Δ relative to the experimental control. Initiation densities of (B) sCLSs and (C) bona fide CCPs. (D) Percentage of CCPs relative to all valid traces. (E) Lifetime distribution of bona fide CCPs. (F) Mean lifetimes of bona fide CCPs. The box-and-whiskers plots in this and all subsequent figures show median and 10th to 90th percentiles. Individual circles correspond to outlier movies (n ≥ 22 per condition). In this and all subsequent figures, ordinary one-way ANOVA was used to compare control with kd, each performed on the same day. P values: ***P < 0.001. Bona fide CCP analyzed: controls for AP2 α, Hip1, Hrb: 43,866, 59,824, 86,929, respectively; AP2 α: 23,549; Hip1: 52,047; Hrb: 56,474.
Fig. 4.
Fig. 4.
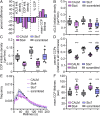
Effect of GAK kd on CCP dynamics measured by cmeAnalysis (A, C, and G) and DASC (D, F, and H). Initiation densities of (A) sCLSs and (B and E) bona fide CCPs. (D) Initiation density of clathrin structures calculated by DASC, considering valid traces and others. (C and F) Percentage of CCPs relative to all valid traces. (G) Lifetime distribution of bona fide (i.e., superthreshold) CCPs identified by cmeAnalysis. (H) Lifetime distribution of (i.e., nonabortive) CCPs identified by DASC. Bona fide CCP analyzed: scramble: 212,004; GAK: 191,542 from three biologically independent experiments. (DF) Wilcoxon rank-sum test was used to compare control with kd.
Fig. 5.
Fig. 5.
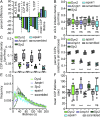
A role for SNARE proteins and their adaptors during early stages of CCP formation. (A). Percent difference plot of initiation density of sCLSs, initiation density of bona fide CCPs, percent CCPs, and mean lifetimes of CCPs. Results are expressed as %Δ relative to the experimental control. Initiation densities of (B) sCLSs and (C) bona fide CCPs. (D) Percentage of CCPs relative to all valid traces. (E) Lifetime distribution of bona fide CCPs. (F) Mean lifetimes of bona fide CCPs. Bona fide CCP analyzed: controls for CALM, (Stx4, Stx7), Vamp3, and Vamp8: 87,754, (136,457), 95,384, and 104,785, respectively; CALM: 32,921; Stx4: 53,777; Stx7: 98,647; Vamp3: 79,070; Vamp8: 80,769.
Fig. 6.
Fig. 6.
Analysis of CCP dynamics reveals early roles for “late” module proteins in CME (A). Percent difference plot of initiation density of sCLSs, initiation density of bona fide CCPs, percent CCPs, and mean lifetimes of CCPs. Results are expressed as %Δ relative to the experimental control. Initiation densities of (B) sCLSs and (C) bona fide CCPs. (D) Percentage of CCPs relative to all valid traces. (E) Lifetime distribution of bona fide CCPs. (F) Mean lifetimes of bona fide CCPs. Bona fide CCP analyzed: controls for Dyn2, (Amph1, epsin1), and Sjn2: 73,373, (56,740), and 48,450, respectively; Dyn2: 23,067; Amph1: 26,976; epsin1: 16,140; Sjn2: 22,667.

Similar articles

Cited by

References

    1. McMahon H. T., Boucrot E., Molecular mechanism and physiological functions of clathrin-mediated endocytosis. Nat. Rev. Mol. Cell Biol. 12, 517–533 (2011). - PubMed
    1. Azarnia Tehran D., López-Hernández T., Maritzen T., Endocytic adaptor proteins in health and disease: Lessons from model organisms and human mutations. Cells 8, 1345 (2019). - PMC - PubMed
    1. Mettlen M., Chen P. H., Srinivasan S., Danuser G., Schmid S. L., Regulation of clathrin-mediated endocytosis. Annu. Rev. Biochem. 87, 871–896 (2018). - PMC - PubMed
    1. Kaksonen M., Roux A., Mechanisms of clathrin-mediated endocytosis. Nat. Rev. Mol. Cell Biol. 19, 313–326 (2018). - PubMed
    1. Ehrlich M., et al. , Endocytosis by random initiation and stabilization of clathrin-coated pits. Cell 118, 591–605 (2004). - PubMed

Publication types

MeSH terms

LinkOut - more resources