. 2020 Dec 15;117(50):32114-32123.
doi: 10.1073/pnas.2012623117. Epub 2020 Nov 30.

Inverse correlation between fatty acid transport protein 4 and vision in Leber congenital amaurosis associated with RPE65 mutation

Affiliations

Inverse correlation between fatty acid transport protein 4 and vision in Leber congenital amaurosis associated with RPE65 mutation

Songhua Li et al. Proc Natl Acad Sci U S A. .

Abstract

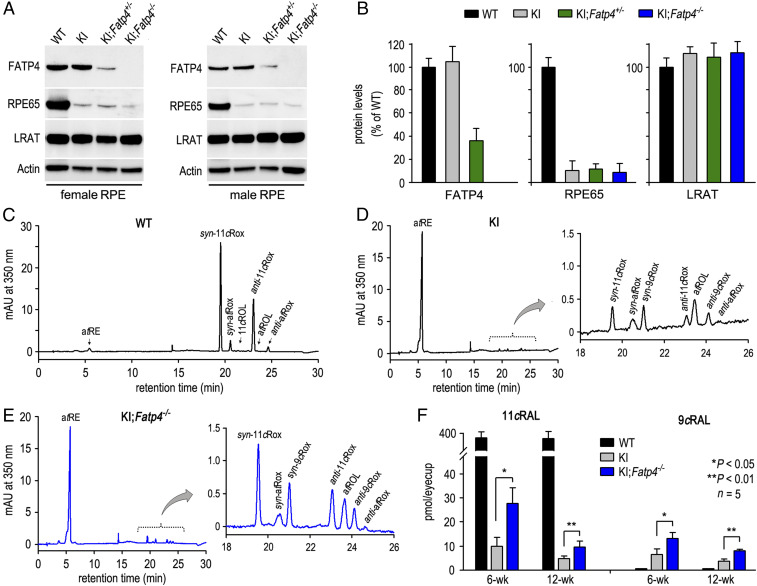
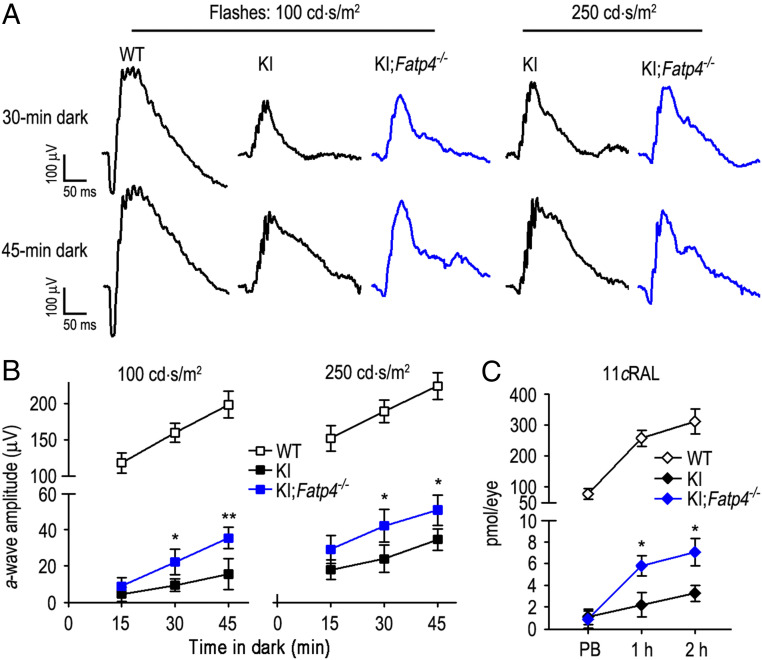
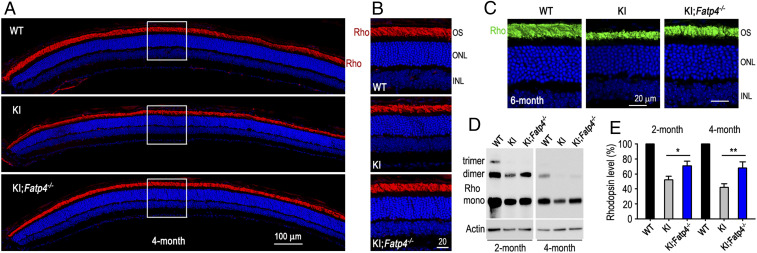
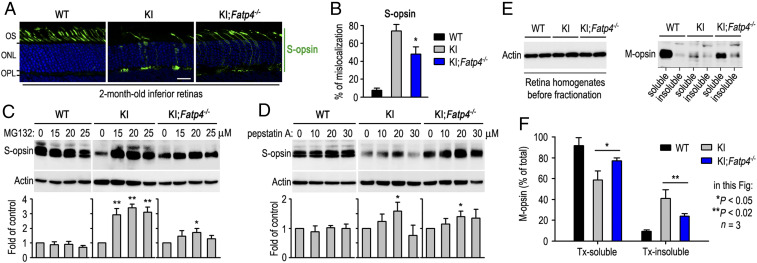
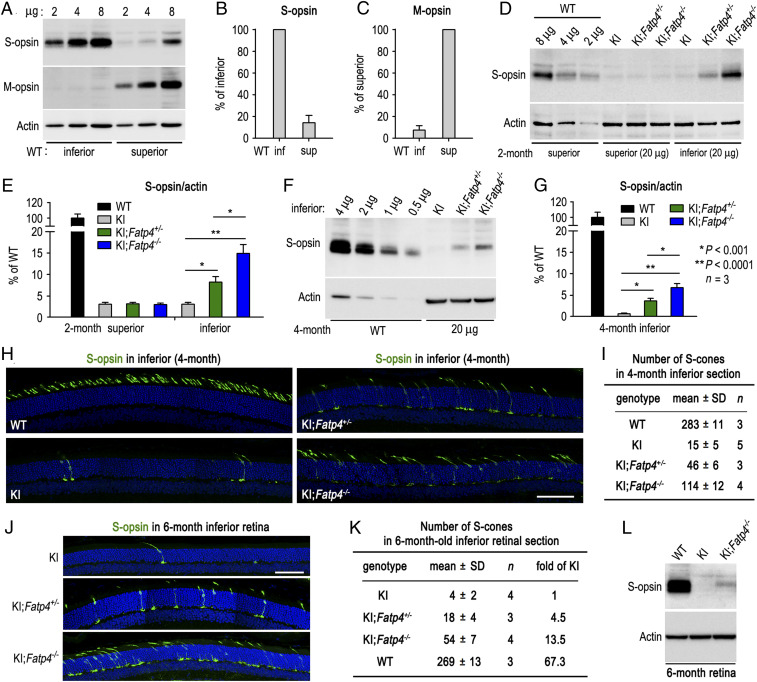
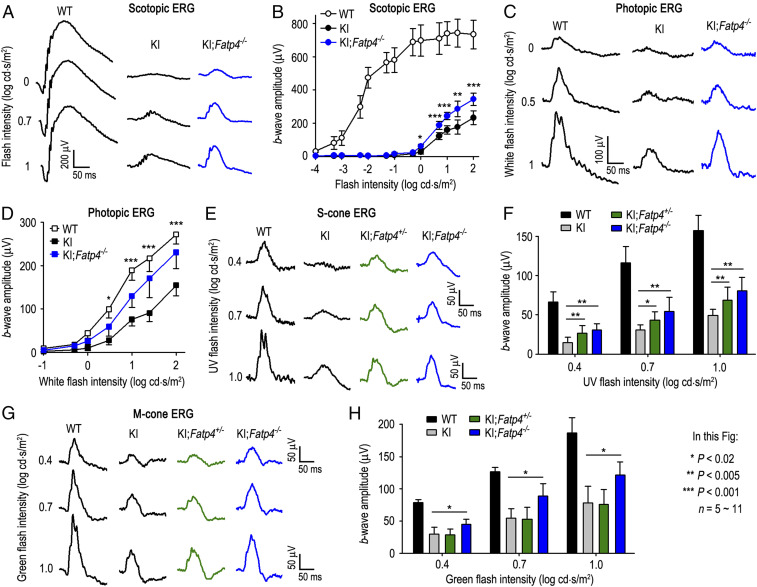
Fatty acid transport protein 4 (FATP4), a transmembrane protein in the endoplasmic reticulum (ER), is a recently identified negative regulator of the ER-associated retinal pigment epithelium (RPE)65 isomerase necessary for recycling 11-cis-retinal, the light-sensitive chromophore of both rod and cone opsin visual pigments. The role of FATP4 in the disease progression of retinal dystrophies associated with RPE65 mutations is completely unknown. Here we show that FATP4-deficiency in the RPE results in 2.8-fold and 1.7-fold increase of 11-cis- and 9-cis-retinals, respectively, improving dark-adaptation rates as well as survival and function of rods in the Rpe65 R91W knockin (KI) mouse model of Leber congenital amaurosis (LCA). Degradation of S-opsin in the proteasomes, but not in the lysosomes, was remarkably reduced in the KI mouse retinas lacking FATP4. FATP4-deficiency also significantly rescued S-opsin trafficking and M-opsin solubility in the KI retinas. The number of S-cones in the inferior retinas of 4- or 6-mo-old KI;Fatp4-/- mice was 7.6- or 13.5-fold greater than those in age-matched KI mice. Degeneration rates of S- and M-cones are negatively correlated with expression levels of FATP4 in the RPE of the KI, KI;Fatp4+/- , and KI;Fatp4-/- mice. Moreover, the visual function of S- and M-cones is markedly preserved in the KI;Fatp4-/- mice, displaying an inverse correlation with the FATP4 expression levels in the RPE of the three mutant lines. These findings establish FATP4 as a promising therapeutic target to improve the visual cycle, as well as survival and function of cones and rods in patients with RPE65 mutations.

Keywords: RPE65; cone photoreceptor; opsin solubility; retinal degeneration; visual cycle.


Conflict of interest statement

The authors declare no competing interest.

Figures

Fig. 1.
Fig. 1.
Deletion of FATP4 increased chromophore synthesis in R91W KI mice. (A) Immunoblot analysis of FATP4, RPE65, and LRAT in the mouse RPE with the indicated genotypes. β-Actin was detected as a loading control. (B) Relative expression levels of FATP4, RPE65, and LRAT in the mutant mouse RPE were normalized by actin levels and shown as percent of each protein level in WT mice. (CE) Representative HPLC chromatograms of ocular retinoids extracted from dark-adapted WT (C), KI (D), and KI;Fatp4−/− (E) mice. The marked peaks are atRE, syn-11-cis retinal oxime (syn-11cRox), syn-all-trans retinal oxime (syn-atRox), 11cROL, anti-11-cis retinal oxime (anti-11cRox), all-trans retinol (atROL), anti-all-trans retinal oxime (anti-atRox), syn-9-cis retinal oxime (syn-9cRox), and anti-9-cis retinal oxime (anti-9cRox). (F) Amounts of 11-cis and 9-cis retinals in dark-adapted eyes of 6-wk- and 12-wk-old WT, KI, and KI;Fatp4−/− mice are measured by HPLC analysis.
Fig. 2.
Fig. 2.
Accelerated recovery of rod light sensitivity and chromophore synthesis in KI;Fatp4−/−mice. (A) Representative scotopic ERG responses of WT, KI, and KI;Fatp4−/− mice to 100- or 250-cd·s/m2 flashes. The mice were kept in darkness for 30 min or 45 min after photobleaching the visual pigments. (B) Amplitudes of scotopic ERG a-waves evoked by 100-cd·s/m2 or 250-cd·s/m2 flashes in WT, KI, and KI;Fatp4−/− mice kept in darkness for the indicated times after photobleaching the visual pigments. (C) Amounts of 11cRAL in WT, KI, and KI;Fatp4−/− mouse eyes are measured at the indicated conditions: Immediately after photobleaching (PB), dark-adapted for 1 h or 2 h after photobleaching. Asterisks indicate significant differences between KI and KI;Fatp4−/− mice (*P < 0.04, **P ≤ 0.005). Error bars show SD (n = 4 ∼ 6).
Fig. 3.
Fig. 3.
FATP4-deficiency mitigated degeneration of rods in KI mice. (A) Immunostaining of rhodopsin (Rho, red) in the superior retinas of 4-mo-old WT, KI, and KI;Fatp4−/− mice. Nuclei were counterstained with DAPI (blue). (B) Higher-magnification images of the areas of rectangles shown in A. OS, outer segments; ONL, outer nuclear layer; INL, inner nuclear layer. (C) Representative immunostaining of Rho (green) in the central areas of 6-mo-old WT, KI, and KI;Fatp4−/− mouse superior retinas. (D) Immunoblot analysis of Rho in the retinas of 2- and 4-mo-old WT, KI, and KI;Fatp4−/− mice. (E) Relative expression levels of Rho in the KI and KI;Fatp4−/− retinas were normalized by actin levels and shown as percent of Rho levels in the WT retinas. Asterisks indicate significant differences between KI and KI;Fatp4−/− mice (*P < 0.03, **P ≤ 0.004). Error bars show SD (n = 3).
Fig. 4.
Fig. 4.
Improved trafficking, stability, and solubility of cone opsins in KI;Fatp4−/− mice. (A) S-opsin (green) immunohistochemistry in WT, KI, and KI;Fatp4−/− inferior retinas. (Scale bar, 20 μm.) (B) Percentage of S-opsin mislocalization estimated by dividing S-opsin immunofluorescence in the OPL by the sum of immunofluorescence in the OPL and OS. Note the decrease in S-opsin mislocalization in KI;Fatp4−/− mice. (C and D) Immunoblot analysis of S-opsin in retinal explants treated with the indicated concentrations of MG132 (C) or pepstatin A (D). DMSO was used in the MG132 and pepstatin A-null controls. Histograms show relative immunoblot intensities of S-opsin in MG132-treated and pepstatin A-treated retinas versus DMSO-treated controls. (E) Representative immunoblot analysis of M-opsin in Triton X-100–soluble and –insoluble retinal fractions separated by ultracentrifugation (Right). (Left) Immunoblots of actin in the retinal homogenates before ultracentrifugation. (F) Percentages of Triton X-100–soluble and –insoluble M-opsin in WT, KI, and KI;Fatp4−/− mice are estimated from the immunoblot intensities in E.
Fig. 5.
Fig. 5.
Inverse correlation between S-cone degeneration and FATP4 expression in KI mouse models. (A) Immunoblot analysis of S- and M-opsins in the indicated amounts (μg) of retinal homogenates from inferior or superior halves of WT mouse retinas. (B and C) Percentages of S-opsin (B) and M-opsin (C) included in the inferior and superior halves of WT retinas. (D) Immunoblot analysis of S-opsin in the inferior and superior halves of 2-mo-old mouse retinas with the indicated genotypes. (E) Relative expression levels of S-opsin in the inferior or superior halves of 2-mo-old KI, KI;Fatp4+/−, and KI;Fatp4−/− retinas are shown as percent of S-opsin levels in the inferior or superior halves of WT retinas. (F) Immunoblot analysis of S-opsin in the inferior halves of 4-mo-old WT, KI, KI;Fatp4+/−, and KI;Fatp4−/− mouse retinas. (G) Relative expression levels of S-opsin in the inferior half of 4-mo-old KI, KI;Fatp4+/−, and KI;Fatp4−/− retinas are shown as percent of S-opsin levels in age-matched WT inferior retinas. (H) Immunostaining of S-opsin in the inferior retinas of 4-mo-old WT, KI, KI;Fatp4+/−, and KI;Fatp4−/− mice. (Scale bar, 100 μm.) (I) Numbers of S-cones in the inferior retinas of sections taken from the dorsal-ventral midline of 4-mo-old mouse eyes. (J) Immunostaining of S-opsin in the inferior retinas of 6-mo-old with the indicated genotypes. (Scale bar, 100 μm.) (K) Comparison of S-cone numbers in the inferior retinal sections of 6-mo-old mice. (L) Immunoblot analysis of S-opsin in 6-mo-old retinas of WT, KI, and KI;Fatp4−/− mice. *P < 0.001, **P < 0.0001, n = 3.
Fig. 6.
Fig. 6.
M-cone preservation is negatively correlated with FATP4 expression in KI mouse lines. (A) Immunoblot analysis of M-opsin in the indicated amounts (μg) of retinal homogenates from the inferior or superior halves of WT, KI, KI;Fatp4+/−, and KI;Fatp4−/− mice. (B) Expression levels of M-opsin in the superior or inferior halves of 2-mo-old KI, KI;Fatp4+/−, and KI;Fatp4−/− retinas are normalized with actin levels and shown as percent of M-opsin levels in the WT mouse superior or inferior retinas. (C) Immunoblot analysis of M-opsin in total retinal homogenates of 2-mo-old WT, KI, KI;Fatp4+/−, and KI;Fatp4−/− mice. (D) Histogram showing percentages of normalized M-opsin immunoblot intensities in the mutant retinas relative to the M-opsin intensities in the WT retinas. *P < 0.01, **P < 0.005, n = 3. (E) Immunostaining of M-opsin in the superior retinas of 4-mo-old mice with the indicated genotypes.
Fig. 7.
Fig. 7.
Inverse correlation between FATP4 expression and visual function of rods and cones in KI mouse models. (A) Representative scotopic ERG responses of dark-adapted 6-wk-old WT, KI, and KI;Fatp4−/− mice to the indicated flashes (0 ∼ 1 log cd·s/m2). (B) Amplitudes of scotopic ERG b-waves elicited with the indicated flashes in WT, KI, and KI;Fatp4−/− mice. (C) Photopic ERG responses of 3-mo-old WT, KI, and KI;Fatp4−/− mice to the indicated flashes of white light under a rod-saturating background light. (D) Amplitudes of photopic ERG b-waves evoked with the indicated light flashes in WT, KI, and KI;Fatp4−/− mice. Asterisks indicate significant differences between KI and KI;Fatp4−/− mice. (E) Representative ERG responses of S-cones in 3-mo-old WT, KI, KI;Fatp4+/−, and KI;Fatp4−/− mice to 360-nm UV light flashes under a rod-saturating background light. (F) Amplitudes of S-cone ERG b-waves evoked with the indicated intensities of UV light flashes in WT, KI, KI;Fatp4+/−, and KI;Fatp4−/− mice. (G) Representative ERG responses of M-cones in 3-mo-old WT and the indicated mutant mice to the flashes of 530-nm green light. (H) Amplitudes of M-cone ERG b-waves evoked with the indicated intensities of 530-nm light flashes. Asterisks indicate significant differences between KI and KI;Fatp4−/− mice.

Similar articles

Cited by

References

    1. Redmond T. M., et al. , Rpe65 is necessary for production of 11-cis-vitamin A in the retinal visual cycle. Nat. Genet. 20, 344–351 (1998). - PubMed
    1. Jin M., Li S., Moghrabi W. N., Sun H., Travis G. H., Rpe65 is the retinoid isomerase in bovine retinal pigment epithelium. Cell 122, 449–459 (2005). - PMC - PubMed
    1. Moiseyev G., Chen Y., Takahashi Y., Wu B. X., Ma J. X., RPE65 is the isomerohydrolase in the retinoid visual cycle. Proc. Natl. Acad. Sci. U.S.A. 102, 12413–12418 (2005). - PMC - PubMed
    1. Redmond T. M., et al. , Mutation of key residues of RPE65 abolishes its enzymatic role as isomerohydrolase in the visual cycle. Proc. Natl. Acad. Sci. U.S.A. 102, 13658–13663 (2005). - PMC - PubMed
    1. Rohrer B., et al. , Cone opsin mislocalization in Rpe65-/- mice: A defect that can be corrected by 11-cis retinal. Invest. Ophthalmol. Vis. Sci. 46, 3876–3882 (2005). - PubMed

Publication types

MeSH terms

LinkOut - more resources