. 2020 Dec 15;117(50):32086-32097.
doi: 10.1073/pnas.2014659117. Epub 2020 Nov 30.

A bacterial cytolinker couples positioning of magnetic organelles to cell shape control

Affiliations

A bacterial cytolinker couples positioning of magnetic organelles to cell shape control

Daniel Pfeiffer et al. Proc Natl Acad Sci U S A. .

Abstract

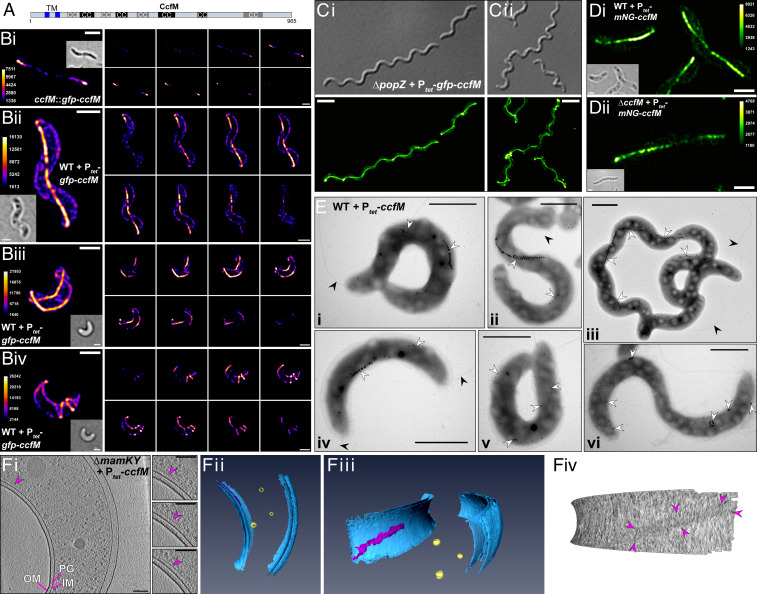
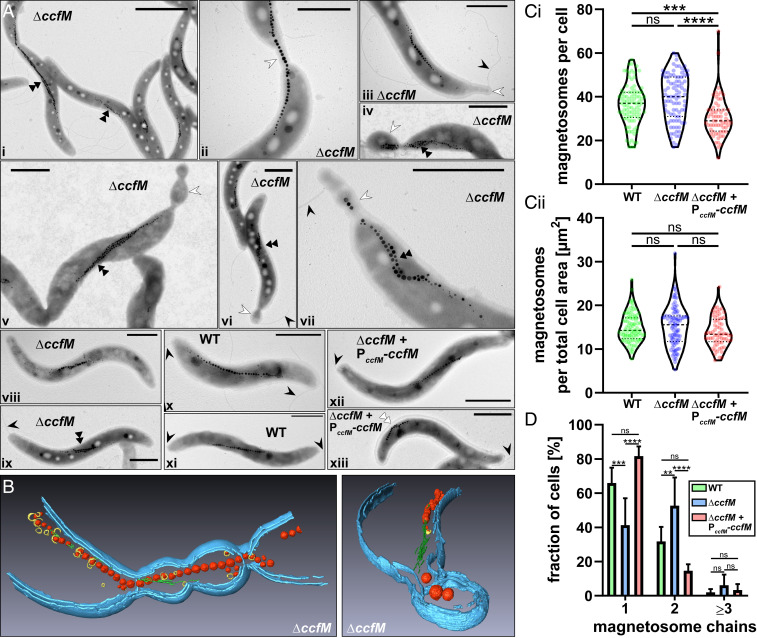
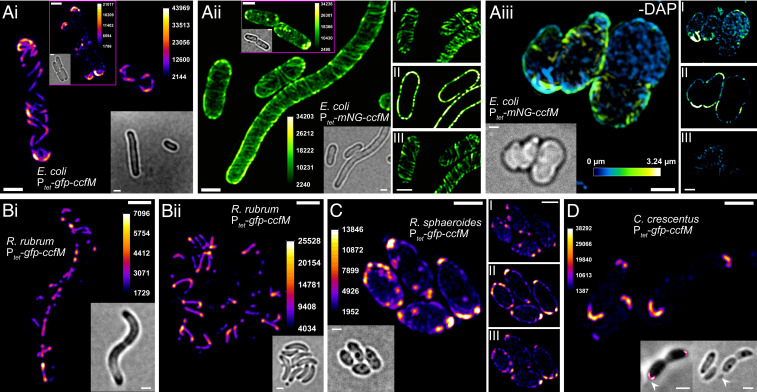
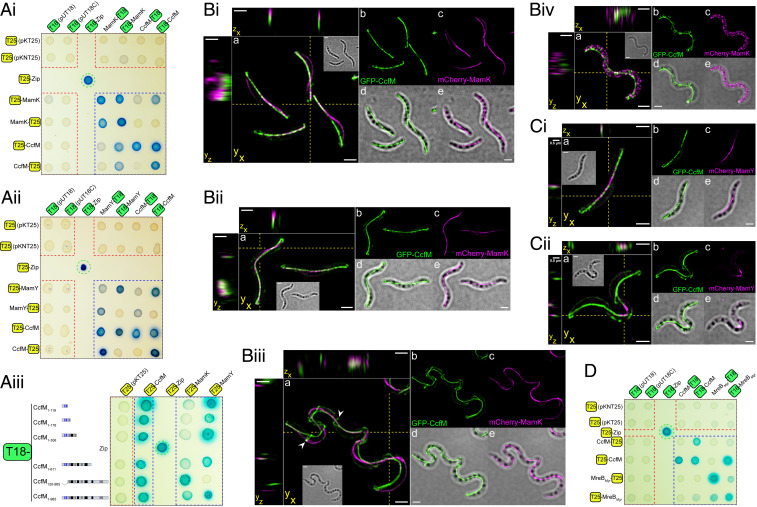
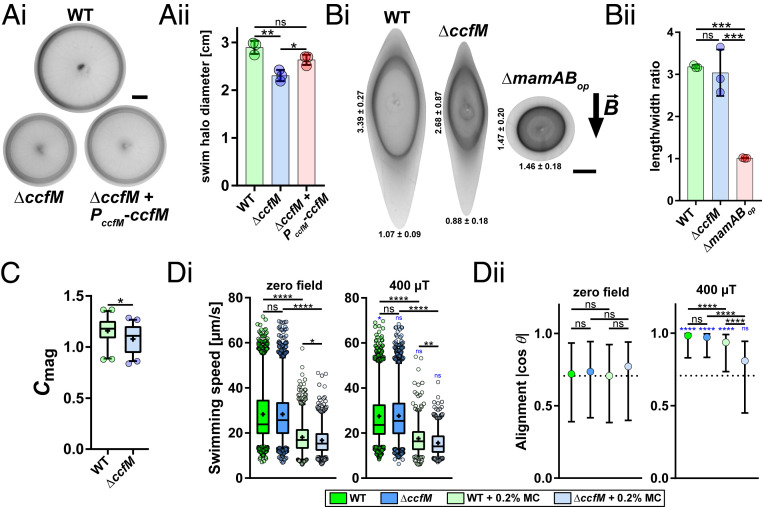
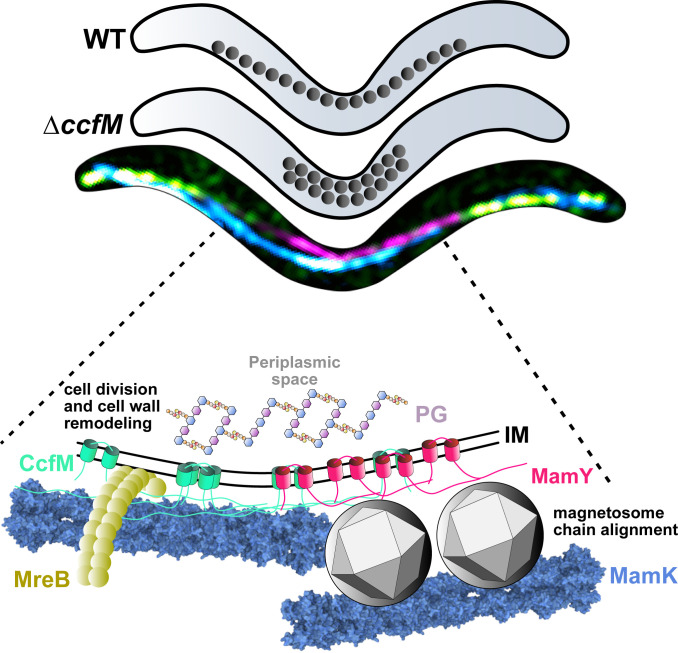
Magnetotactic bacteria maneuver within the geomagnetic field by means of intracellular magnetic organelles, magnetosomes, which are aligned into a chain and positioned at midcell by a dedicated magnetosome-specific cytoskeleton, the "magnetoskeleton." However, how magnetosome chain organization and resulting magnetotaxis is linked to cell shape has remained elusive. Here, we describe the cytoskeletal determinant CcfM (curvature-inducing coiled-coil filament interacting with the magnetoskeleton), which links the magnetoskeleton to cell morphology regulation in Magnetospirillum gryphiswaldense Membrane-anchored CcfM localizes in a filamentous pattern along regions of inner positive-cell curvature by its coiled-coil motifs, and independent of the magnetoskeleton. CcfM overexpression causes additional circumferential localization patterns, associated with a dramatic increase in cell curvature, and magnetosome chain mislocalization or complete chain disruption. In contrast, deletion of ccfM results in decreased cell curvature, impaired cell division, and predominant formation of shorter, doubled chains of magnetosomes. Pleiotropic effects of CcfM on magnetosome chain organization and cell morphology are supported by the finding that CcfM interacts with the magnetoskeleton-related MamY and the actin-like MamK via distinct motifs, and with the cell shape-related cytoskeleton via MreB. We further demonstrate that CcfM promotes motility and magnetic alignment in structured environments, and thus likely confers a selective advantage in natural habitats of magnetotactic bacteria, such as aquatic sediments. Overall, we unravel the function of a prokaryotic cytoskeletal constituent that is widespread in magnetic and nonmagnetic spirilla-shaped Alphaproteobacteria.

Keywords: MamK; MreB; cytoskeleton; magnetosome; magnetotaxis.


Conflict of interest statement

The authors declare no competing interest.

Figures

Fig. 1.
Fig. 1.
CcfM localizes in filamentous patterns and affects cell curvature and magnetosome chain positioning. (A) CcfM domain structure. CC, putative coiled-coil motifs (black = high confidence; gray = medium to low confidence); TM, putative transmembrane segments; numbers indicate amino acid positions. (B) Representative 3D-SIM micrographs of cells expressing GFP-CcfM from its native chromosomal locus and promoter (i, strain ccfM::gfp-ccfM) and after random chromosomal insertion of a Tn5-Ptet–based expression cassette in the wild-type background (ii, 5 h and iiiiv, 25 h postinduction). For each subfigure: Left column, maximum-intensity projection (brightfield image as Inset); Right column, top-left to bottom-right corner: consecutive z-slices with a distant spacing of 150 nm (i and ii) and 200 nm (iii and iv), respectively. Calibration bars denote the intensity of fluorescence. (Scale bars, 1 µm.) (C) DIC (Upper) and maximum-intensity projection of deconvolved z-stack (Lower) of elongated ΔpopZ cells expressing GFP-CcfM from Tn5-Ptet (i, 7 h; ii, 24 h postinduction). (Scale bars, 3 µm.) (D) 3D-SIM maximum-intensity projections (brightfield as Inset) of mNeonGreen-CcfM expressed from Tn5-Ptet in the wild-type (i) and ΔccfM (ii) background (5 h postinduction). Calibration bars indicate the intensity of fluorescence. (Scale bars, 1 µm.) (E) TEM micrographs of overly curved CcfM-overexpressing cells (wild-type + Tn5-Ptet-ccfM, 24 h postinduction). Magnetosomes and flagella are marked by white and black arrowheads, respectively. (Scale bars, 1 µm.) (F) CET of a CcfM-overproducing cell in the absence of MamK and MamY (ΔmamKY + Tn5-Ptet-ccfM, 24 h postinduction). (i) Individual 5.24-nm-thick tomographic slices with different z-depth through the tomogram depicting the curved cell and the putative CcfM-related structure (purple arrowheads) close to the inner membrane. The localization of the sheet-like structure correlates with the positioning of CcfM observed by 3D-SIM. IM/OM, inner/outer membrane; PG, peptidoglycan layer. (Scale bars, 100 nm.) (ii and iii) Three-dimensional rendering of the tomographed cell. Inner/outer membranes and the peptidoglycan layer are depicted in blue, vesicles are yellow. The putative CcfM structure is purple. (iv) Membranogram depicts a projection of the tomogram at a certain distance from the membrane. The putative CcfM structure is indicated by purple arrowheads. Thickness of the rendered shell is 2.1 nm; distance from the membrane is 14.7 nm.
Fig. 2.
Fig. 2.
Deletion of ccfM results in altered cell morphology. (A) The wild-type (WT) strain, the ΔccfM strain, and the ΔccfM strain complemented in trans using a Tn7-based construct (comprising ccfM and its putative promoter region; ΔccfM + PccfM-ccfM) were analyzed for their (i) centerline cell length, (ii) curvature, (iii) mean curvature (± SEM) along the centerline relative to the normalized cell length, (iv) mean angularity, and (v) sinuosity versus cell length. Results in i and ii are presented as box plots and rotated kernel probability density plots to indicate the distribution of the data. The thick horizontal line indicates the median and the red dot indicates the mean. The box represents the interquartile range and the whiskers are extending to the lowest and highest value within 1.5 times the interquartile range from the hinges, respectively. Outliers are colored gray. P values were determined by the Kruskal–Wallis test with Dunn’s multiple comparison posttest; ****P < 0.0001; ns, not significant (P ≥ 0.05). In iv and v, dots represent individual cells (extreme values were clipped to better indicate the distribution of the data). Dotted lines in iv indicate the median. Measurements are based on exponential growth phase cultures grown in triplicates per strain under microoxic conditions (2% headspace oxygen) in liquid medium. Total numbers of analyzed cells: n = 1,447 (wild-type), 788 (ΔccfM), and 1,400 (ΔccfM + PccfM-ccfM). (B) Representative filamentous wild-type and ΔccfM cells (brightfield micrographs) from agar (1.5% [wt/vol]) plate-grown cultures (8 d of incubation at 2% headspace oxygen). (Scale bars, 3 µm.) (C) Time-lapse microscopy (brightfield micrographs) of the wild-type and ΔccfM strain on agarose pads. Cell division events are marked by white arrowheads. Time values (in hours and minutes) given in the wild-type panel are valid for both strains. (Scale bar, 3 µm.)
Fig. 3.
Fig. 3.
Deletion of ccfM causes tubular extensions connecting dividing cells and predominant formation of shorter magnetosome double chains. (A) Representative TEM micrographs of the ΔccfM strain (iix), the wild-type (WT) strain (x and xi), and the ΔccfM strain harboring the Tn7-based transcomplementation construct (xii and xiii). Appendages are marked with white arrowheads. Flagella are indicated by black arrowheads. Doubled or multiples of magnetosome chains are indicated by black double arrowheads. In xiii the magnetosome chain is shifted toward the major axis of the cell (white double arrowhead). (Scale bars, 1 µm.) (B) CET 3D rendering of (Left) a tubular structure connecting dividing cells and (Right) a bulb-like extension of the cell envelope. Magnetite crystals are marked red, magnetosome membrane vesicles are yellow, and the actin-like MamK filament is green. The cellular envelope inner and outer membranes are depicted in blue. (C) Magnetosome numbers (i) per cell and (ii) per total cell area estimated by TEM. Violin plots depict the frequency distribution of the data. The dashed line depicts the median, and dotted lines depict the quartiles. Dots represent measures of individual cells. The numbers of analyzed cells correspond to n = 93 (wild-type), 90 (ΔccfM), and 64 (ΔccfM + PccfM-ccfM). P values were determined by the Kruskal–Wallis test with Dunn’s multiple comparison posttest; ***P < 0.001; ****P < 0.0001; ns, not significant (P ≥ 0.05). (D) Analysis of magnetosome chain number. A chain was defined as chain-like arrangement of greater than or equal to eight magnetosomes, which were interspaced by not more than ∼50 nm from each other. Bars depict average percentages of cells harboring the respective numbers of magnetosome chains. Error bars reflect SD between different TEM datasets, greater than or equal to three different datasets were analyzed per strain. The total numbers of analyzed cells correspond to n = 267 (wild-type), 382 (ΔccfM), and 63 (transcomplemented ΔccfM strain). Statistical analysis was performed by two-way analysis of variance with Tukey’s multiple comparison posttest; **P < 0.01; ***P < 0.001; ****P < 0.0001; ns, not significant (P ≥ 0.05).
Fig. 4.
Fig. 4.
Localization of CcfM in different bacteria. (A) Localization of GFP-CcfM (i) and mNeonGreen-CcfM (ii) in circumferential patterns in E. coli WM3064 (i, 21 h; ii, 24 h postinduction). After shorter induction times CcfM fluorescent fusions mostly localized to the membrane and polar caps (purple Insets; 2 h postinduction). Circumferential CcfM structures became disordered or disappeared when mNeonGreen-CcfM expressing 2,6-diaminopimelic acid (DAP)-auxotrophic E. coli WM3064 cells (as shown in ii) were incubated for 3 h in the absence of DAP (iii). (B) Localization of GFP-CcfM in R. rubrum in filamentous longitudinal (i) and circumferential (i and ii) patterns. The micrograph in i represents a cell of a culture grown under aerobic conditions in the dark (7 h postinduction), ii depicts cells of a culture grown in closed screw-cap tubes with illumination from a light bulb (without induction, leaky expression from Ptet). (C) In R. sphaeroides, GFP-CcfM localized to the membrane and to clusters more prominent in polar regions (7 h postinduction; culture grown under aerobic conditions in the dark). (D) In C. crescentus, GFP-CcfM localized at the polar caps in arc-like sheets, which were more prominent at the stalked pole (7 h postinduction; white arrowheads). All fluorescent fusions were expressed using the Ptet promoter system. Main micrographs are 3D-SIM z-series maximum-intensity projections, except the depth-coded projection in A, iii. Calibration bars denote the intensity of fluorescence for the maximum intensity projections and the focus distance into the sample for the depth-coded projection. Micrographs to the right in A, ii, A, iii, and C are selected z-slices depicting bottom, top (I, III), and central parts of the cells (II). Brightfield images are shown as Inset. In D an additional Inset (Bottom Right, Left image) depicts an overlay of the maximum-intensity projection and phase contrast. (Scale bars, 1 µm.)
Fig. 5.
Fig. 5.
CcfM interacts with MamK, MamY, and MreBMgr. (A) BACTH assay based on reconstitution of CyaA activity in an E. coli cya strain. Fusion of interacting proteins to Bordetella pertussis CyaA catalytic domain complementary fragments T25 and T18 (which are inactive when physically separated) confers cAMP-dependent expression of catabolic genes, resulting in blue color formation and enhanced growth on X-Gal containing M63 maltose-mineral salts agar. Positive control (Leucine zipper) and negative controls (T18- or T25-fusions tested against the corresponding empty vector) are marked by green and red dashed lines, respectively. Tested interactions are marked by blue dashed lines. (i) BACTH analysis between CcfM and MamK and between (ii) CcfM and MamY. (iii) BACTH analysis of truncated CcfM variants against full-length T25-CcfM/MamK/MamY fusions. Numbers indicate amino acid positions. Putative transmembrane helices are marked in blue. Gray and black boxes represent putative coiled-coil motifs. Homo-oligomerization permutations of full-length CcfM (amino acids 1 to 965) were included on all plates for comparison. (B) The 3D-SIM colocalization microscopy of CcfM and MamK and (C) CcfM and MamY. GFP-CcfM was expressed from Tn5-Ptet in the strains mamK::mCherry-mamK and mamY::mCherry-mamY. Micrographs were acquired 3 h (B, i and, C, i), 6 h (B, ii), and 24 h (B, iii and iv, and C, ii) postinduction. For each subfigure: (a) Color merge of z-stack maximum-intensity projections of both fluorescence channels (brightfield image shown as Inset). Yellow dashed lines and letters indicate orthogonal cross-sections shown to the top and left of the image. GFP-CcfM is colored in green; mCherry-MamK and -MamY are colored in magenta. White-colored regions indicate colocalization. Ring-shaped GFP-CcfM structures are indicated by white arrowheads. To correct for color shift, the microscope was calibrated with a bead sample and mismatch between channels was corrected during 3D-SIM image reconstruction. No significant cross-bleed of fluorescent fusions into the corresponding channel used to image the second fluorescent protein was detected. (b and c) Individual fluorescence channel images. Micrographs are maximum intensity projections. (d and e) Merge of individual fluorescence channels and brightfield. (All scale bars not indicated in the figure, 1 µm.) (D) BACTH analysis of CcfM and MreBMgr.
Fig. 6.
Fig. 6.
CcfM promotes motility and magnetotaxis in structured environments. (A, i) Representative swim halos of the wild-type (WT), the ΔccfM strain, and the transcomplemented ΔccfM strain (ΔccfM + Tn7-PccfM-ccfM). Plates were incubated for 3 d at 28 °C under atmospheric conditions. (Scale bar, 0.5 cm.) (ii) Average swim halo diameters (±SDs). (B, i) Representative distorted swim halos formed after 2 d within a homogeneous 400-µT magnetic field (direction indicated by black arrow). For comparison, a nonmagnetic strain (ΔmamABop) is shown. (Scale bar, 0.5 cm.) Average lengths and widths (±SDs) of the halos (in centimeters) are indicated. (ii) Average (±SDs) length-to-width ratios (vertical/horizontal diameter) of ellipsoid swim halos as a measure of magnetic alignment. Results in A and B are based on three individual experiments (performed in different weeks), each based on triplicate culture samples (considered here as subsamples). Statistical comparison of subsample averages (colored dots) was performed by one-way analysis of variance with Tukey’s multiple-comparison posttest (*P < 0.05; **P < 0.01; ***P < 0.001; ns, not significant [P ≥ 0.05]). (C) Measurements of the magnetic response (Cmag) based on individual cultures (wild-type, n = 45; ΔccfM, n = 40) grown under microoxic conditions (2% headspace oxygen). In box plots: The bar indicates the median, the box the interquartile range, and the whiskers the 5th and 95th percentiles. Dots represent values below and above the 5th and 95th percentiles. The mean is shown as “+.” Statistical analysis was performed by Mann–Whitney U test (*P < 0.05). (D, i) Swimming speeds and (ii) magnetic alignment determined by live-cell motility tracking in flask standard medium (FSM) and in FSM + 0.2% methylcellulose (MC) within a zero field (canceled geomagnetic field) and in a homogeneous 400-µT magnetic field. θ denotes the angle between the velocity vector and the axis of the magnetic field for a swimming track. A population median of the absolute cos θ of “1” indicates that cells swim aligned with the applied magnetic field, a value of “0” indicates alignment with the axis in the focal plane perpendicular to the magnetic field, and a value of ∼0.7 (vertical dashed line) indicates an unbiased directional movement. Data were pooled from five experiments (performed on different days), corresponding to total track numbers of n = 1,669 (wild-type), 1,519 (ΔccfM), 605 (wild-type + 0.2% MC), and 602 (ΔccfM + 0.2% MC) within the zero field and 1,485 (wild-type), 1,559 (ΔccfM), 381 (wild-type + 0.2% MC), and 521 (ΔccfM + 0.2% MC) within the 400-µT magnetic field. Box plots in D, i are as described above. In D, ii dots depict the median and error bars the interquartile range. P values were determined by the Kruskal–Wallis test with Dunn’s multiple comparison posttest; *P < 0.05; **P < 0.01; ****P < 0.0001; ns, not significant (P ≥ 0.05). Statistical comparison for the 400-µT magnetic field was additionally performed against the corresponding zero field condition (indicated by blue letters).
Fig. 7.
Fig. 7.
Model of CcfM molecular interactions with the cytoskeleton and magnetoskeleton. Suggested interactions identified (or confirmed) in this study are between CcfM and MamY (mediated via CcfM transmembrane helices), CcfM and MamK (mediated via CcfM coiled-coil motifs), CcfM and MreB, and homo-oligomerization interactions of CcfM, MamK, MamY, and MreB. Magnetosomes are concatenated into chains by MamJ-mediated attachment to MamK (for simplicity only MamK is shown). Magnetosome chains are aligned along regions of positive inner-cell curvature via MamY. Based on its native localization pattern, which is characterized by a predominant assembly at subpolar-to-polar regions of the inner positively curved membrane, CcfM might serve as supportive structure to confer geodetic localization of MamK. CcfM might extend the MamY membrane tether and magnetoskeleton toward the poles, favoring assembly of shorter, doubled chains when CcfM is absent (as indicated in the schematic drawing on top). CcfM also has a role related to cell division and morphology. CcfM might reinforce curved cell shape by exerting a bending force onto the inner membrane, and/or by interaction with MreB (e.g., by modulating MreB’s localization and dynamics), which may spatially affect insertion of new peptidoglycan building units. Note, possible direct interactions between MamK, MamY, and MreB so far have not been experimentally addressed. Molecular dimensions are not drawn to scale. For simplicity only the α-helical transmembrane segments of CcfM are indicated as cylinders. IM, inner cellular membrane; PG, peptidogylcan. The fluorescence micrograph was created from two separate cells with similar shape expressing GFP-CcfM (green) and mCherry-MamY (magenta) or mCherry-MamK (cyan), respectively, which were stitched together to illustrate the localization of all three proteins.

Similar articles

Cited by

References

    1. Uebe R., Schüler D., Magnetosome biogenesis in magnetotactic bacteria. Nat. Rev. Microbiol. 14, 621–637 (2016). - PubMed
    1. Komeili A., Li Z., Newman D. K., Jensen G. J., Magnetosomes are cell membrane invaginations organized by the actin-like protein MamK. Science 311, 242–245 (2006). - PubMed
    1. Katzmann E., Scheffel A., Gruska M., Plitzko J. M., Schüler D., Loss of the actin-like protein MamK has pleiotropic effects on magnetosome formation and chain assembly in Magnetospirillum gryphiswaldense. Mol. Microbiol. 77, 208–224 (2010). - PubMed
    1. Toro-Nahuelpan M., et al. , Segregation of prokaryotic magnetosomes organelles is driven by treadmilling of a dynamic actin-like MamK filament. BMC Biol. 14, 88 (2016). - PMC - PubMed
    1. Katzmann E., et al. , Magnetosome chains are recruited to cellular division sites and split by asymmetric septation. Mol. Microbiol. 82, 1316–1329 (2011). - PubMed

Publication types

MeSH terms

Supplementary concepts