. 2020 Dec 15;117(50):31902-31913.
doi: 10.1073/pnas.2018138117. Epub 2020 Nov 30.

Cellular proteostasis decline in human senescence

Affiliations

Cellular proteostasis decline in human senescence

Niv Sabath et al. Proc Natl Acad Sci U S A. .

Abstract

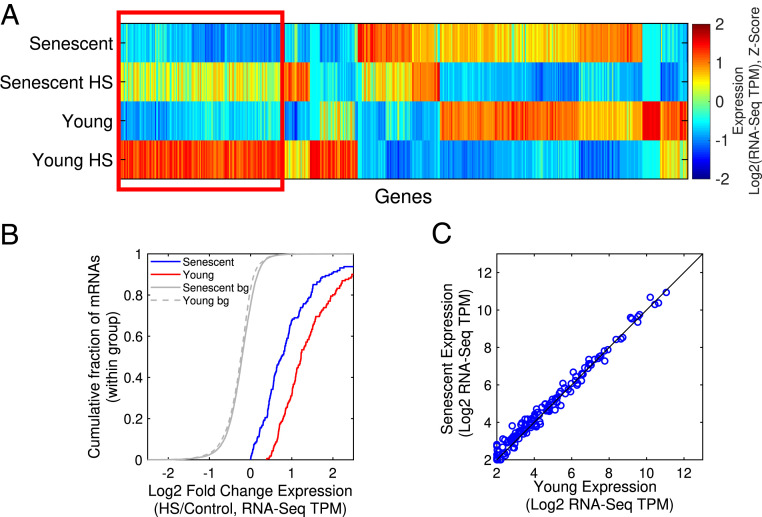
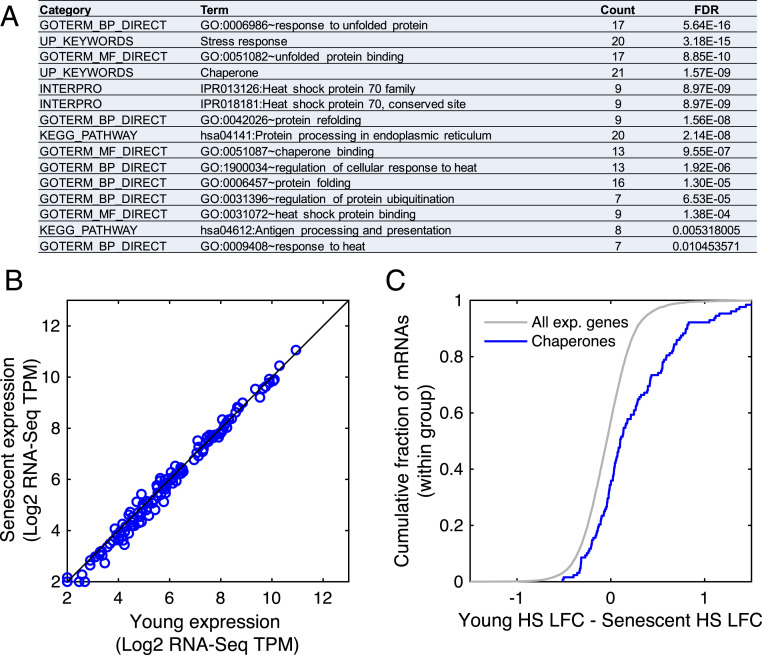
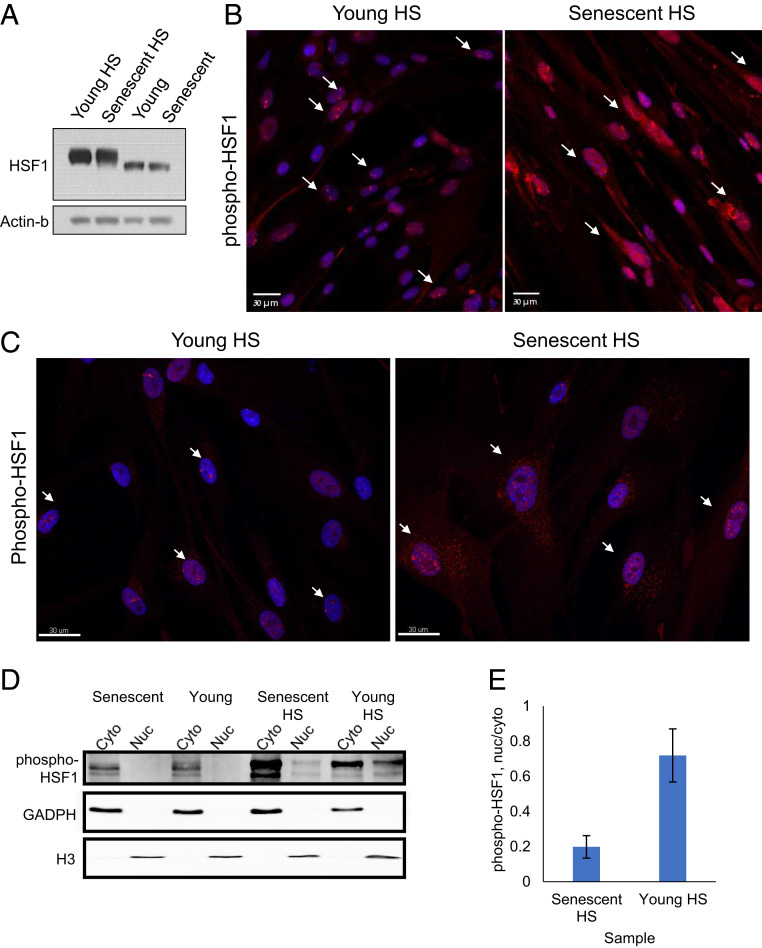
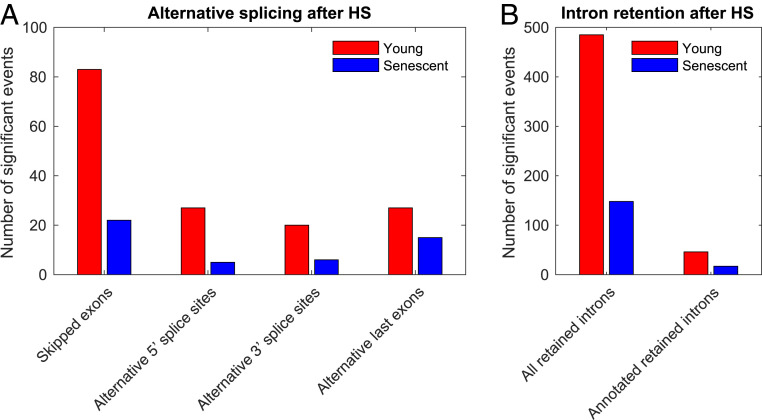
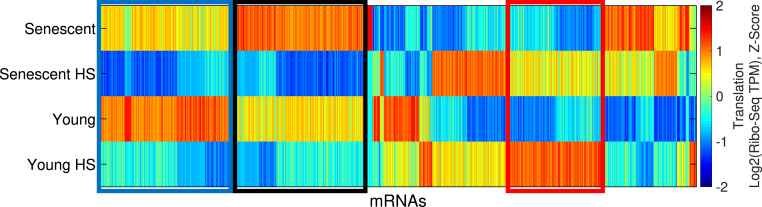
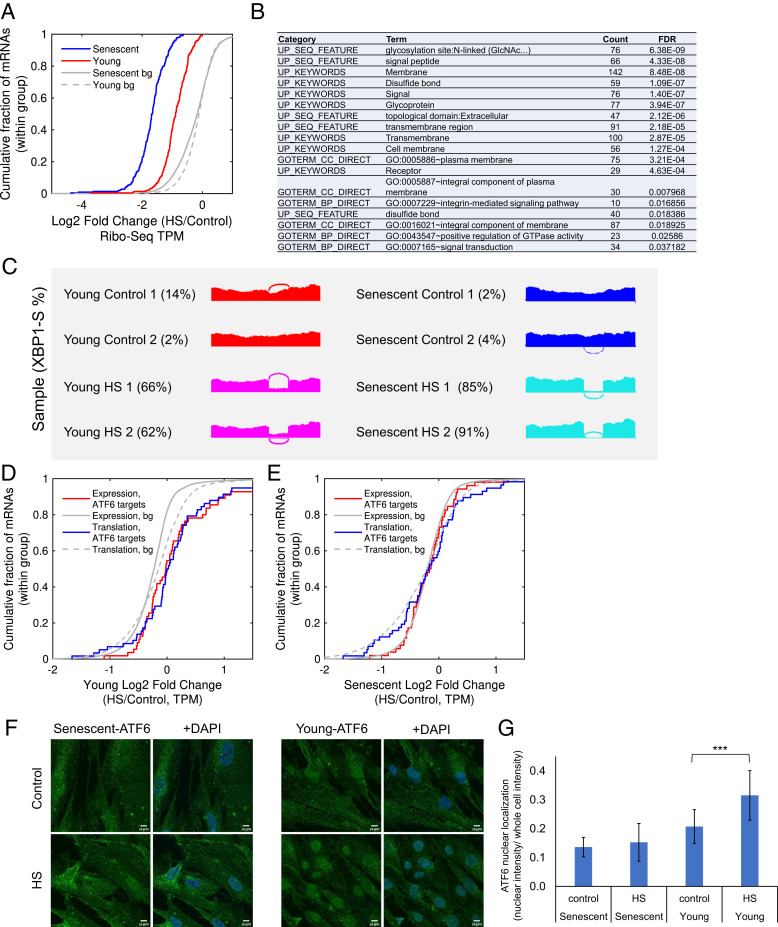
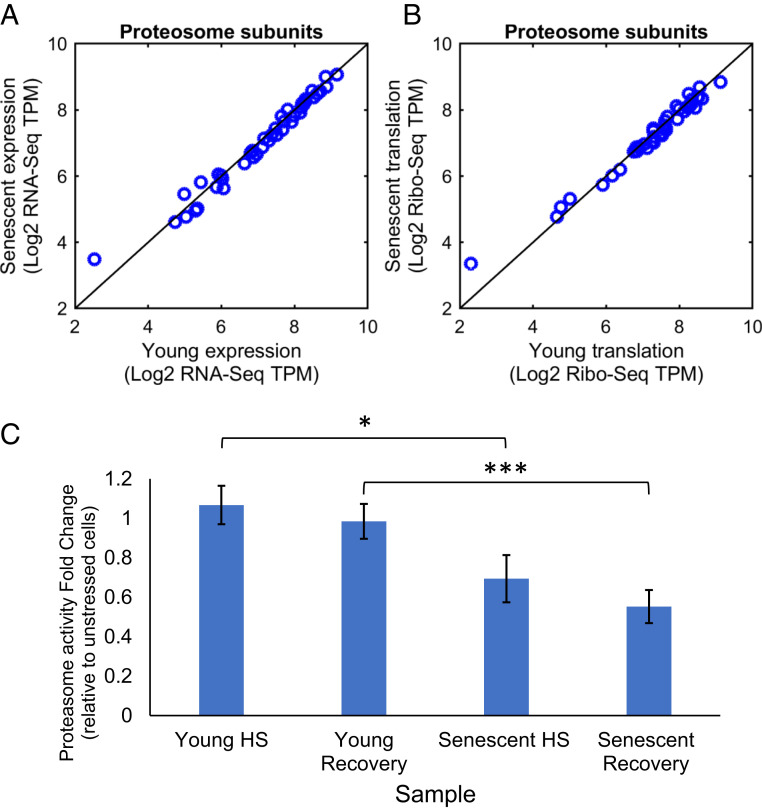
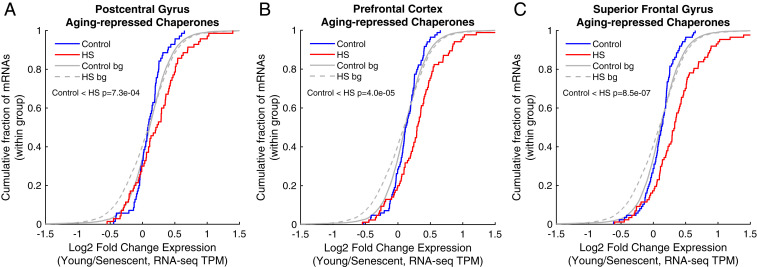
Proteostasis collapse, the diminished ability to maintain protein homeostasis, has been established as a hallmark of nematode aging. However, whether proteostasis collapse occurs in humans has remained unclear. Here, we demonstrate that proteostasis decline is intrinsic to human senescence. Using transcriptome-wide characterization of gene expression, splicing, and translation, we found a significant deterioration in the transcriptional activation of the heat shock response in stressed senescent cells. Furthermore, phosphorylated HSF1 nuclear localization and distribution were impaired in senescence. Interestingly, alternative splicing regulation was also dampened. Surprisingly, we found a decoupling between different unfolded protein response (UPR) branches in stressed senescent cells. While young cells initiated UPR-related translational and transcriptional regulatory responses, senescent cells showed enhanced translational regulation and endoplasmic reticulum (ER) stress sensing; however, they were unable to trigger UPR-related transcriptional responses. This was accompanied by diminished ATF6 nuclear localization in stressed senescent cells. Finally, we found that proteasome function was impaired following heat stress in senescent cells, and did not recover upon return to normal temperature. Together, our data unraveled a deterioration in the ability to mount dynamic stress transcriptional programs upon human senescence with broad implications on proteostasis control and connected proteostasis decline to human aging.

Keywords: UPR; chaperones; heat shock response; protein homeostasis; senescence.


Conflict of interest statement

The authors declare no competing interest.

Figures

Fig. 1.
Fig. 1.
mRNA expression analysis of HS-treated young and senescent cells. (A) A hierarchical clustering analysis of 548 mRNAs with significant expression difference (using DESeq2, FDR-corrected P value < 0.05) in at least one comparison between different sample types. The figure shows a gene-wise normalized Z-score heatmap of the log2 expression (RNA-seq TPM) values. The proteostasis decline cluster, a cluster with induced expression levels upon HS, which is attenuated in senescent cells, is marked by a red box. Of the 161 mRNAs in this cluster, there are 27 chaperones out of 28 differentially expressed chaperones identified. (B) A CDF plot of the log2 expression fold change (HS/Control RNA-seq TPM) for mRNAs in the proteostasis decline cluster, shown for senescent (blue) and young (red) cells. Gray lines depict the background distributions (bg), corresponding to all expressed genes in senescent (solid line) and young cells (dashed line). The log2 fold change is greater in young than in senescent cells (P = 4.3−10, Kolmogorov-Smirnov goodness-of-fit [KS] test). (C) There was no significant difference between the basal expression (log2 RNA-Seq TPM) of the mRNAs in the proteostasis decline cluster in young versus senescent cells (P = 0.7, KS test).
Fig. 2.
Fig. 2.
HS-mediated induction of chaperones is impaired in senescent cells. (A) A functional enrichment analysis of the proteostasis decline cluster performed using DAVID showed that the cluster is characterized by stress response genes and chaperones. (B) There was no significant difference between the mRNA expression levels (log2 RNA-Seq TPM) of all chaperones in young versus senescent samples (P = 1, Kolmogorov-Smirnov goodness-of-fit [KS] test). A manually curated chaperones list (157 chaperones) is in SI Appendix, Table S5; similar results were obtained with the chaperone list from Brehme et al. (22), see SI Appendix, Fig. S3 C and D. (C) A CDF plot of the difference between the HS fold changes (log2 TPM HS/Control, denoted as LFC) between young and senescent cells, demonstrating that chaperones are overall more highly induced in young cells (P = 1.4−9, KS test).
Fig. 3.
Fig. 3.
HS-mediated nuclear localization and distribution of HSF1 are hampered in senescent cells. (A) The total levels of HSF1 in young and senescent cells are very similar (SI Appendix, Fig. S4 AC). (B) Immunofluorescence staining of phospho-HSF1 in young and senescent HS cells show increased cytoplasmic staining in senescent cells. Additionally, while most young cells show 1–4 single bright nuclear foci of phospho-HSF1 upon HS, most senescent cells show many disorganized foci of phospho-HSF1. The white arrows show examples of cells with distinct 1–4 foci in young cells (Left) and disorganized HSF1 localization in old cells (Right). (Scale bar, 30 μm). (C) Confocal 3D imaging of phospho-HSF1 in young and senescent HS cells revealed a closer look of the nuclear foci distribution in young cells and its impairment in senescent cells. The white arrows show examples of cells with distinct 1–4 foci in young cells (Left) and disorganized HSF1 localization in old cells (Right). Additional images and the quantification of the number of foci is shown in SI Appendix, Fig. S4 EG. (Scale bar, 30 μm). (D) A representative WB of nucleus–cytoplasm fractionated cells. Phospho-HSF1 is absent from cell nuclei before HS. Following HS in young cells, nuclear phospho-HSF1 is increased, whereas in senescent cells, the fraction of nuclear phospho-HSF1 is significantly lower. GAPDH and histone H3 present cytoplasmic or nuclear enrichment, respectively. (E) Quantification of WB densitometry for phospho-HSF1 using Fiji. Phospho-HSF1 was quantified in each fraction, and the nucleus was divided by the corresponding cytoplasmic fraction. The bars represent the mean and SE of three biological replicates.
Fig. 4.
Fig. 4.
Regulation of alternative splicing following HS is highly diminished in senescent cells. The number of differential alternative splicing (A) and intron retention (B) isoforms upon HS in young (red) and senescent (blue) cells is shown. Alternative splicing and annotated retained intron events were initially downloaded from the MISO annotation collection (26). An event was denoted significant if the BFs of each HS versus Control comparison (in the two replicates) were above eight and the BFs of replicate comparisons (Control1 versus Control2 and HS1 versus HS2) were below four. The trend is robust to varying BF cutoffs, as shown in SI Appendix, Fig. S5 EJ.
Fig. 5.
Fig. 5.
Exploring translational control in the young and senescent HS response using Ribo-seq. A hierarchical clustering analysis of 1,222 mRNAs with significant expression difference (DESeq2 FDR-corrected P value < 0.05) in at least one comparison between samples is shown. The figure shows a gene-wise Z-score–normalized heatmap of the translation (log2 Ribo-Seq TPM) values. The red box marks a cluster with increased expression level upon HS, which is attenuated in senescent cells, in line with the proteostasis decline mRNA-level cluster above (Fig. 1). Of the 189 genes in this cluster, there are 30 chaperones out of 39 differentially translated chaperones. The blue and black boxes mark two HS repression clusters, which are both translation specific.
Fig. 6.
Fig. 6.
Loss of coordination between UPR branches in senescent cells upon HS. (A) A CDF plot of the log2 translation fold changes (HS/Control, Ribo-seq TPM) for mRNAs from the senescence-enhanced HS repression cluster (Fig. 5, black cluster), shown for senescent (blue) and young (red) cells. The gray lines depict the corresponding CDF plots for the background distribution (bg), that is, all translated mRNAs in senescent (solid gray line) or young (gray dashed line) cells. The repression was significantly stronger in senescent than young cells (P = 5.9−44, Kolmogorov-Smirnov goodness-of-fit test [KS] test). (B) A functional enrichment analysis of the senescence-enhanced HS repression cluster was performed using DAVID and showed that the cluster was highly enriched with ER targets. A full list of annotations is available in SI Appendix, Table S4. (C) A splicing plot (Sashimi plot (26)) of XBP1 exon four (of the unspliced isoform). The PSI values of the spliced XBP1 isoform for all samples, as quantified using MISO (26), are indicated: 2%, 4% (senescent), 85%, 91% (senescent HS), 2%, 14% (young), 66%, and 62% (young HS). The significance of change was quantified by MISO and resulted in the following BFs: the BFs for HS versus Control samples were 1,012 for all comparisons; the BFs for senescent versus young were 1.9 and 0.1, indicating no basal difference in the extent of XBP1-spliced; and the BFs for senescent-HS versus young-HS were 14,717 and 3.810. (D and E) CDF plots of the log2 fold change (HS/Control) of the set of bona fide ATF6 target genes (taken from ref. 31) demonstrate their significant induction upon HS in young cells (D) both at the mRNA (red) and the translation (blue) levels (P = 1.7−5 and P = 1.1−3 for mRNA expression and translation, respectively, using KS test). No induction was observed in senescent cells (E, P = 0.87 and P = 0.77 for mRNA expression and translation, respectively, using KS test). (F) ATF6 immunofluorescence confocal microscopy imaging showed increased nuclear localization in young HS cells with a diminished trend in senescence. DAPI marks the nuclei. Additional fields are shown in SI Appendix, Fig. S7 K–AH. (Scale bar, 10 μm). (G) An image analysis was performed on immunofluorescence images. The mean and SD of ATF6 nuclear localization are presented, calculated as the sum of fluorescence intensity in the nuclei divided by the sum of fluorescence intensity in whole cells (see Materials and Methods), with a total of 16, 17, 19, and 20 images taken for young, young HS, senescent, and senescent HS samples, respectively, from three biological replicate experiments. Significance was calculated using a t test; ***P = 2 × 10⁻⁴. The data for the three separate replicates is shown in SI Appendix, Fig. S7 AI and AJ.
Fig. 7.
Fig. 7.
Deterioration of proteasome function in stressed senescent cells. (A and B) Proteasome subunits show no difference in mRNA levels (A) or translation levels (B) between young and senescent cells, as evident from RNA-seq (A) and Ribo-seq (B) data. This holds true also when comparing young HS versus senescent HS cells (SI Appendix, Fig. S8 A and B). (C) Proteasome activity assay was performed as in ref. using the Suc-LLVY-AMC fluorogenic proteasome substrate (see Materials and Methods). The assay was performed on lysates of young and senescent cells, either untreated, after 2 h HS, or following 2 h HS and a subsequent recovery of 4 h at 37 °C. Activity of all samples was subtracted with MG132-treated lysates for background, and then HS and recovery samples were divided by untreated cell values to assess the change in proteasome activity. While in young cells proteasome activity was unchanged during stress and recovery (fold change around 1), senescent cells showed significantly diminished activity, 31% and 45% reduction, in HS and recovery, respectively. The mean and SE are presented for five to seven biological replicates. The t test P values are indicated; *P = 0.03 and ***P = 0.005.
Fig. 8.
Fig. 8.
The signature of repressed chaperones in aged human brains shows a proteostasis decline behavior in human senescence. Age-repressed chaperones were taken from Brehme et al. (22), as defined for three different brain regions: (A) postcentral gyrus, (B) prefrontal cortex, and (C) superior frontal gyrus. The CDF plots depict the log2 expression fold changes of the mRNAs in this signature in young/senescent, either in untreated (blue) or HS (red) cells. bg, background distribution. These chaperones show a proteostasis decline behavior in human senescent cells: they were significantly more induced in HS in young versus senescent cells, and therefore the HS curve is significantly shifted. On the other hand, aged-induced chaperones from the same tissues show no significant differences between young and senescent cells (SI Appendix, Fig. S9).

Comment in

References

    1. Haigis M. C., Yankner B. A., The aging stress response. Mol. Cell 40, 333–344 (2010). - PMC - PubMed
    1. Labbadia J., Morimoto R. I., The biology of proteostasis in aging and disease. Annu. Rev. Biochem. 84, 435–464 (2015). - PMC - PubMed
    1. Hartl F. U., Bracher A., Hayer-Hartl M., Molecular chaperones in protein folding and proteostasis. Nature 475, 324–332 (2011). - PubMed
    1. Vilchez D., Saez I., Dillin A., The role of protein clearance mechanisms in organismal ageing and age-related diseases. Nat. Commun. 5, 5659 (2014). - PubMed
    1. Ben-Zvi A., Miller E. A., Morimoto R. I., Collapse of proteostasis represents an early molecular event in Caenorhabditis elegans aging. Proc. Natl. Acad. Sci. U.S.A. 106, 14914–14919 (2009). - PMC - PubMed

Publication types

MeSH terms

Substances