. 2020 Nov 30;11(1):6120.
doi: 10.1038/s41467-020-19982-5.

Sound generation in zebrafish with Bio-Opto-Acoustics

Affiliations

Sound generation in zebrafish with Bio-Opto-Acoustics

Itia A Favre-Bulle et al. Nat Commun. .

Abstract

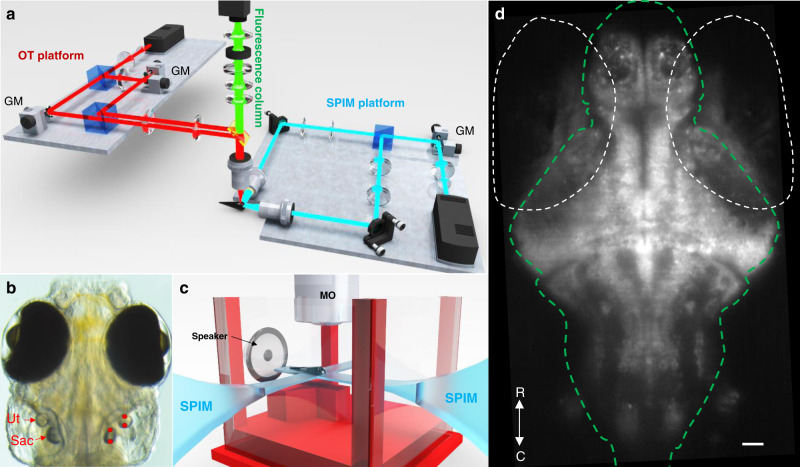
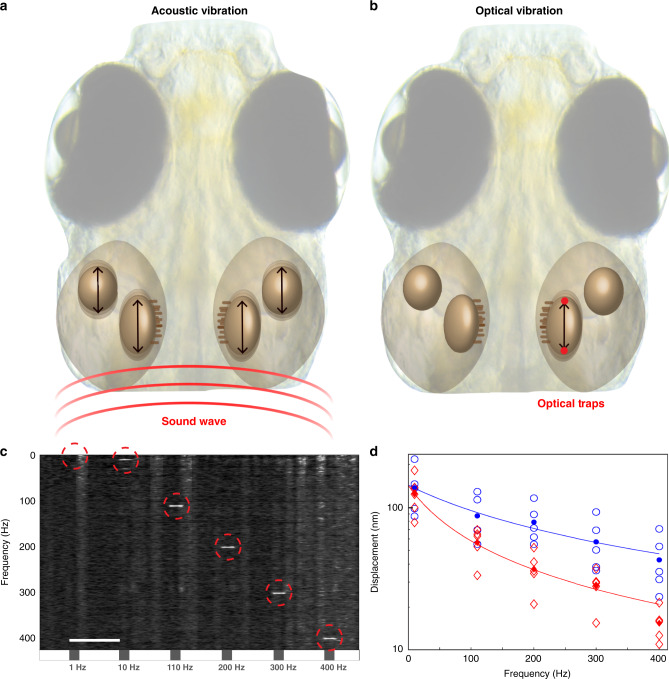
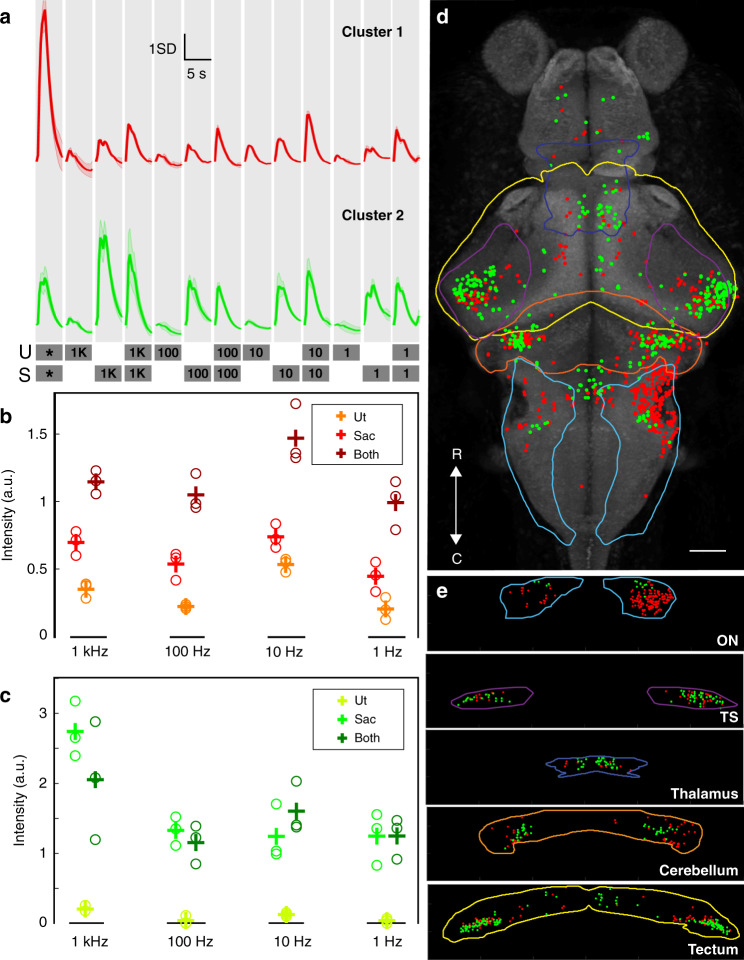
Hearing is a crucial sense in underwater environments for communication, hunting, attracting mates, and detecting predators. However, the tools currently used to study hearing are limited, as they cannot controllably stimulate specific parts of the auditory system. To date, the contributions of hearing organs have been identified through lesion experiments that inactivate an organ, making it difficult to gauge the specific stimuli to which each organ is sensitive, or the ways in which inputs from multiple organs are combined during perception. Here, we introduce Bio-Opto-Acoustic (BOA) stimulation, using optical forces to generate localized vibrations in vivo, and demonstrate stimulation of the auditory system of zebrafish larvae with precise control. We use a rapidly oscillated optical trap to generate vibrations in individual otolith organs that are perceived as sound, while adjacent otoliths are either left unstimulated or similarly stimulated with a second optical laser trap. The resulting brain-wide neural activity is characterized using fluorescent calcium indicators, thus linking each otolith organ to its individual neuronal network in a way that would be impossible using traditional sound delivery methods. The results reveal integration and cooperation of the utricular and saccular otoliths, which were previously described as having separate biological functions, during hearing.


Conflict of interest statement

The authors declare no competing interests.

Figures

Fig. 1
Fig. 1. Optical and sound stimulation of the auditory system in zebrafish.
a Optical system comprising an OT platform for the generation of two optical traps, a SPIM platform for the illumination of a single plane of zebrafish brain, and a fluorescence column for the imaging of GCaMP6s emissions. Details can be found in the “Methods” section. b OT (red dots, right) were placed at two locations within the utricular (Ut) and saccular (Sac) otoliths. The galvo mirrors (GM) on the OT platform displaced each trap from one location to the other at a frequency ranging from 1 Hz to 1 kHz. c Sketch representing the placement of a larva in a custom-built-chamber, the SPIM planes, the microscope objective (MO), and the location of the speaker. d Example of a fluorescence image recorded from one plane in one fish. The white dashed ovals indicate the eyes, and the green line delineates the brain. R, rostral; C, caudal. Scale bar indicates 10 μm.
Fig. 2
Fig. 2. Mechanics of sound perception in zebrafish.
a Schematic illustration of sound propagation from a speaker and the resulting movements of the otoliths in larval zebrafish ear. b Illustration of OT targeted to alternating sides of one otolith at high speed, and the resulting selective vibration of the targeted otolith. c Average spectrogram (normalized over frequency) of the position of the optically manipulated otoliths (both saccule and utricle combined) over time across 5 fish. Gray boxes on the timeline represent 1 s of OT stimulation. The number written under the box represents the OT frequency of the stimulation. See Supplementary Figs. 2 and 3 for more details on the movements of each type of otolith. Scale bar in c is 5 s. Diffuse vertical bands are artefacts produced by animal movements, and movements of the otolith at 1 Hz stimulation are masked by background movements. d Individual measurements of otolith displacements at different frequencies of BOA stimulation (empty circles and diamonds), displayed on a logarithmic scale. Saccule data are represented in blue and utricle in red. Filled circles and diamonds represent mean values. Fit was performed to Eq. (1), with fitting parameters describing γ and k and neglecting mass. N = 5 fish.
Fig. 3
Fig. 3. Auditory and BOA responses across the brain.
a The average profiles of two 100 Hz tone responsive clusters during acoustic and BOA stimulation. The two bottom lines detail the stimulus train. Gray boxes specify the stimulus windows (1 s of stimulation and 4 s of rest) and the otolith targeted (U, utricle; S, saccule). Numbers on the gray boxes specify the frequency of BOA stimulation in Hz. * represents a 100 Hz auditory tone from a speaker. b, c Intensity of responses of cluster 1 (b) and cluster 2 (c) to BOA on the utricle (Ut), saccule (Sac), and both at various frequencies. Circles represent peak responses in individual trials (three in total for each OT configuration), with mean values shown by “+”. d Locations of ROIs belonging to two functional clusters of auditory neurons, viewed dorsally (red for cluster 1 and green for cluster 2). Brain regions of interest are outlined with colored lines, with light blue for octavolateralis nucleus (ON), purple for torus semicircularis (TS), dark blue for thalamus, orange for cerebellum, and yellow for tectum. Data are from six fish. Scale bars, 50 μm. R, rostral; C, caudal. e Distributions of each cluster in the brain regions outlined in d, rotated to produce a coronal view.

References

    1. Gibbons, C. & Miles, R. N. Design of a biomimetic directional microphone diaphragm. In IMECE (Florida, 2000).
    1. Handzel, A. A., Andersson, S. B., Gebremichael, M. & Krishnaprasad, P. A biomimetic apparatus for sound-source localization. In 42nd IEEE International Conference on Decision and Control (IEEE Cat. No. 03CH37475), Vol. 6, 5879–5884 (IEEE, 2003).
    1. Ladich, F. & Schulz-Mirbach, T. Diversity in fish auditory systems: one of the riddles of sensory biology. Front. Ecol. Evol.4, 28 (2016).
    1. Budelmann, B. U. In The Evolutionary Biology of Hearing (eds Webster, D. B., Popper, A. N. & Fay, R. R.) (Springer New York, New York, NY, 1992).
    1. Fullard JH, Yack JE. The evolutionary biology of insect hearing. Trends Ecol. Evolution. 1993;8:248–252. doi: 10.1016/0169-5347(93)90200-9. - DOI - PubMed

Publication types

LinkOut - more resources