. 2020 Nov 30;11(1):6133.
doi: 10.1038/s41467-020-19861-z.

Essential omega-3 fatty acids tune microglial phagocytosis of synaptic elements in the mouse developing brain

Affiliations

Essential omega-3 fatty acids tune microglial phagocytosis of synaptic elements in the mouse developing brain

C Madore et al. Nat Commun. .

Abstract

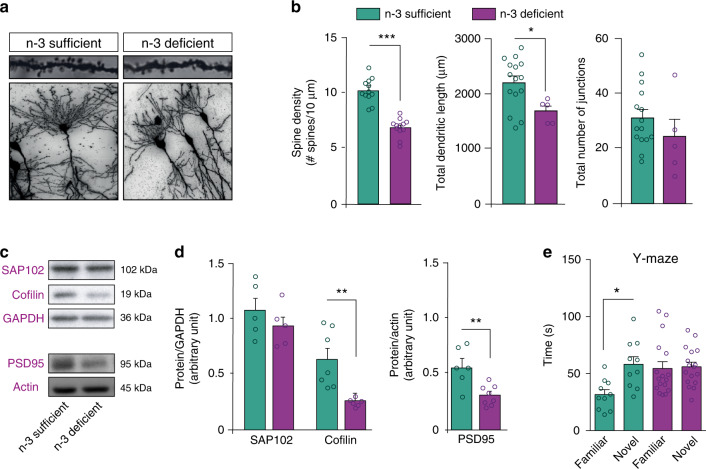
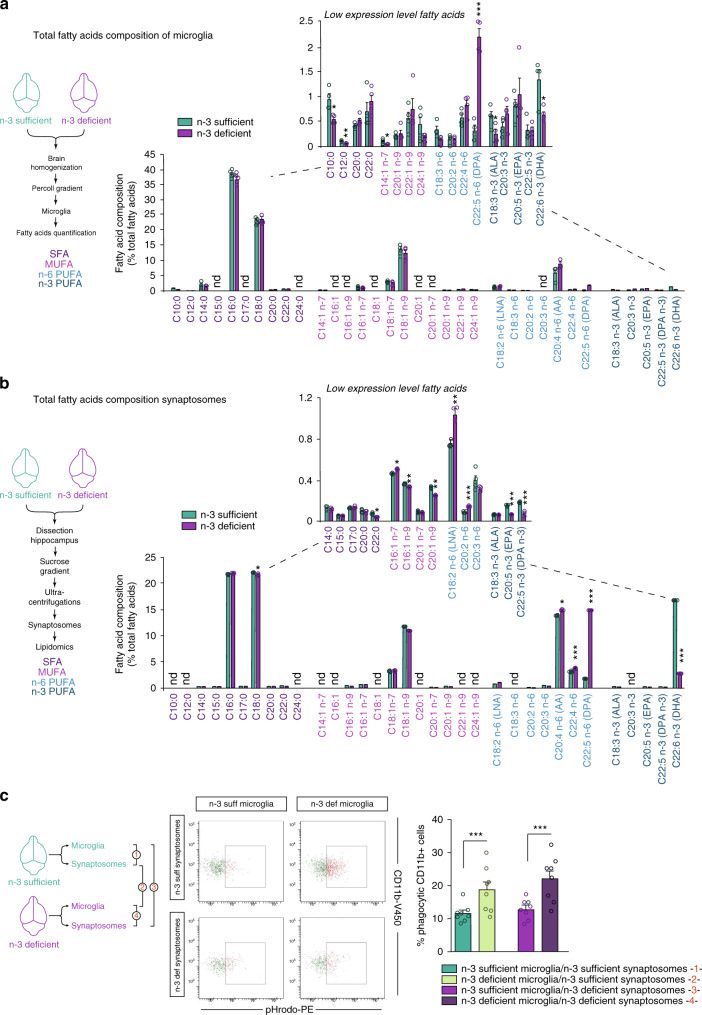
Omega-3 fatty acids (n-3 PUFAs) are essential for the functional maturation of the brain. Westernization of dietary habits in both developed and developing countries is accompanied by a progressive reduction in dietary intake of n-3 PUFAs. Low maternal intake of n-3 PUFAs has been linked to neurodevelopmental diseases in Humans. However, the n-3 PUFAs deficiency-mediated mechanisms affecting the development of the central nervous system are poorly understood. Active microglial engulfment of synapses regulates brain development. Impaired synaptic pruning is associated with several neurodevelopmental disorders. Here, we identify a molecular mechanism for detrimental effects of low maternal n-3 PUFA intake on hippocampal development in mice. Our results show that maternal dietary n-3 PUFA deficiency increases microglia-mediated phagocytosis of synaptic elements in the rodent developing hippocampus, partly through the activation of 12/15-lipoxygenase (LOX)/12-HETE signaling, altering neuronal morphology and affecting cognitive performance of the offspring. These findings provide a mechanistic insight into neurodevelopmental defects caused by maternal n-3 PUFAs dietary deficiency.


Conflict of interest statement

The authors declare no competing interests.

Figures

Fig. 1
Fig. 1. Maternal n-3 PUFA deficiency alters neuronal morphology and function.
a Representative images of tertiary apical dendrites (upper panel) and dendritic arborization (lower panel) of hippocampal CA1 pyramidal neurons from n-3 sufficient and n-3 deficient mice at P21 (Golgi staining). b Quantification of spine density, total dendritic length and total number of junctions in n-3 deficient and n-3 sufficient animals. For spine counting, n = 12 CA1 pyramidal neurons of the hippocampus, 15–45 segments per animal, 3 mice per group. Means ± SEM. Two-tailed unpaired Student’s t-test, t = 6.396, ***p < 0.0001. For dendritic arborization and total dendritic length, n = 5 neurons from 3 mice for n-3 deficient mice and n = 15 neurons from 4 mice for n-3 sufficient mice. Two-tailed unpaired Student’s t-test; Dendritic length, t = 2.501, *p = 0.0223; number of junctions: t = 1.118, p = 0.28. c Representative western blots. d Expression of scaffolding proteins in n-3 deficient mice relative to n-3 sufficient mice. Means ± SEM; n = 5–8 mice per group. Two-tailed unpaired Student’s t-test, t = 0.9986, p = 0.35, SAP102; t = 3.572, **p = 0.0044, cofilin; t = 3.529, **p = 0.0042, PSD95. e Time spent in novel vs familiar arm in the Y maze task. Means ± SEM; n = 10–17 mice per group. Two-way ANOVA followed by Bonferroni post hoc test: diet effect, F(1,50) = 5.47, p = 0.071; arm effect, F(1,50) = 10.08, p = 0.015; interaction, F(1,50) = 8.08, p = 0.029; familiar vs novel arm for n-3 diet mice: *p < 0.05. Source data are provided as a Source data file.
Fig. 2
Fig. 2. Maternal n-3 PUFA deficiency increases microglial phagocytosis and gene expression profile.
a, b Representative images (a) and quantification (b) of EM data from the CA1 region of n-3 sufficient and n-3 deficient mice. s spine, m microglial processes, t terminals, * extracellular debris, ma myelinated axons. Arrowheads point to synaptic clefts. Scale bars = 1 μm. Two-tailed unpaired Student’s t-test; t = 5.24, **p = 0.0063, cleft; t = 3.366, *p = 0.0282, spine inclusions; t = 2.601, p = 0.06, cellular inclusions; t = 2.119, p = 0.1015, extracellular digestion. c Three-dimensional reconstructions of PSD95-immunoreactivity (red) outside (arrowheads) or colocalized with (arrows) microglial cells (green). d Quantification of PSD95 and Iba1 immunoreactivity colocalization in the CA1 region of n-3 deficient and n-3 sufficient group. Means ± SEM; n = 4–6 mice per group. Two-tailed unpaired Student’s t-test; t = 2.583, *p = 0.032. e Representative bivariate dot plots of isolated microglial cells gated on CD11b+/CD45low expression from n-3 sufficient and n-3 deficient mice. f FACS analysis of phagocytic uptake of pHrodo-labeled E. Coli bioparticles by CD11b+ microglial cells from both dietary groups after 180 min of incubation (expressed as the percent of cells that are CD11b+ and PE positive). Means ± SEM; n = 3–4 per condition. Two-way ANOVA; diet effect: F(1, 20) = 5.628, *p = 0.028; time effect, F(3,20) = 10.04, p = 0.0003; Interaction, F(3,20) = 0.1771, p = 0.91. The area under the curve is presented as an independent graph in c. Two-tailed unpaired Student’s t-test, t = 1.289, p = 0.25. g Heatmap of significantly up or downregulated genes in each dietary group. Each lane represents one animal (n = 4 or 6 per group). The 20 homeostatic microglia unique genes that were significantly affected by the diet are labelled. h Number of microglial genes that are up-regulated, down-regulated or not regulated by the diet. i A transcript-to-transcript correlation network graph of transcripts significantly differentially expressed by diet groups was generated in Miru (Pearson correlation threshold r ≥ 0.85). Nodes represent transcripts (probe sets), and edges represent the degree of correlation in expression between them. The network graph was clustered using a Markov clustering algorithm, and transcripts were assigned a color according to cluster membership. j Mean expression profile of all transcripts within clusters 1, 2, and 3 where each point represents an animal and the average gene expression of all genes within that cluster for that animal. Source data are provided as a Source data file.
Fig. 3
Fig. 3. Maternal dietary n-3 PUFA deficiency exacerbates microglial phagocytosis of synaptic elements by predominantly impacting microglia.
a Fatty acid composition of microglial cells sorted from n-3 sufficient and n-3 deficient mice. Means ± SEM; n = 4 mice per group. Insert: higher magnification of low expressed fatty acids. Two-tailed unpaired Student’s t-test; t = 3.37, *p = 0.015, C10:0; t = 4.852, **p = 0.0028, C12:0; t = 2.473, *p = 0.0482, C14:1 n-7; t = 9.646, ***p < 0.0001, DPA n-6; t = 2.558, *p = 0.043, ALA; t = 2.972, *p = 0.0249, DHA; nd not detected. b Fatty acid composition of synaptosomes sorted from n-3 sufficient and n-3 deficient mice. Means ± SEM; n = 4 mice per group. Insert: higher magnification of low expressed fatty acids. Two-tailed unpaired Student’s t-test; t = 2.82, *p = 0.047, C17:0; t = 3.05, *p = 0.038, C18:0; t = 5.05, **p = 0.0072 C18:1 n-9; t = 2.99, *p = 0.04, C18:2 n-6; t = 26, ***p < 0.0001, C20:2 n-6; t = 3.57, *p = 0.023, C22:4 n-6; t = 12.68, ***p = 0.0002, DPA n-6; t = 4.49, *p = 0.011, C20:5 n-3; t = 7.12, **p = 0.0021, DHA; nd not detected. c FACS analysis of phagocytic uptake of pHrodo-labeled synaptosomes (sorted from n-3 sufficient or n-3 deficient mice) by CD11b+ microglial cells (sorted from n-3 sufficient or n-3 deficient mice). Analyses were performed 2 h post-synaptosomes application. On FACS plots: x-axis = (pHrodo intensity (PE intensity), y-axis = SSC. Means ± SEM; n = 8 per condition. Two-way ANOVA: microglial fatty acid status effect, F(1,28) = 19.77, ***p = 0.0001; synaptosomes fatty acid status effect, F(1,28) = 1.63, p = 0.2123; interaction, F(1,28) = 0.2826, p = 0.599. Source data are provided as a Source data file.
Fig. 4
Fig. 4. Maternal n-3 PUFA deficiency exacerbates microglia-mediated shaping of neuronal networks in a complement-dependent manner.
ac Representative images and quantification of C1q, CD11b, and C3aR immunostaining in coronal sections of n-3 deficient and n-3 sufficient mice hippocampus. Scale bar = 100 μm. Means ± SEM; n = 3–13 mice per group. Two-tailed unpaired Student’s t-test; t = 1.553, p = 0.135, CD11b CA1; t = 2.114, *p = 0.466, CD11b DG; t = 0.5495, *p = 0.0223 C1q CA1; t = 3.938, **p = 0.0056, C1q DG; t = 4.91, **p = 0.0027, C3aR, total hippocampus. d Protein quantification (ELISA) reveals that synaptosomes from n-3 deficient mice express more C3 than n-3 sufficient animals. Means ± SEM; n = 7–8 mice per group; Two-tailed unpaired Student’s t-test; t = 2.097, p = 0.0562. e Quantification of PSD95 protein expression in n-3 sufficient vs n-3 deficient mice treated with XVA-143 or its vehicle. Means ± SEM; n = 5–8. Two-way ANOVA followed by Bonferroni post hoc test: diet effect, F(1,21) = 11.89, p = 0.0024; treatment effect, F(1,21) = 0.1436, p = 0.708; interaction, F(1,21) = 5.977, p = 0.0234; n-3 sufficient vs n-3 deficient, **p < 0.01. f Time spent in novel vs familiar arm in the Y maze task in n-3 sufficient vs n-3 deficient mice treated with XVA-143 or its vehicle. Means ± SEM; n = 9–10 mice per group. Paired t-test: n-3 sufficient group, **p = 0.0019; n-3 deficient group, p = 0.357; n-3 sufficient + XVA-143 group, **p = 0.0013; n-3 deficient + XVA-143 group, **p = 0.0099. Source data are provided as a Source data file.
Fig. 5
Fig. 5. Maternal n-3 PUFA deficiency alters fatty acid profile in microglia.
a Quantification of free (unesterified) forms of AA, EPA, and DHA levels in microglia. Means ± SEM; n = 4 mice per group. Two-tailed unpaired Student’s t-test; t = 3, *p = 0.024, free AA; t = 6.12, ***p = 0.0009, free EPA; t = 1.149, p = 0.2942, free DHA. b Heat map of all AA-, EPA-, and DHA-derived intracellular mediators expressed by microglia. c AA- EPA- and DHA-derived mediators that are significantly modulated by early-life n-3 PUFA deficient diet. Means ± SEM; n = 4 mice per group. Two-tailed unpaired Student’s t-test; t = 2.693, *p = 0.0359, TRXA3; t = 2.867, *p = 0.0286, TRXB3; t = 3.028, *p = 0.0231, 8-HETE; t = 2.886, *p = 0.0278, 12-HETE; t = 3.656, *p = 0.0106, +/−11-HEPE; t = 3, *p = 0.024, 15S-HEPE; t = 3, *p = 0.024, LTB5; t = 1.975, p = 0.0957, 17S-HDoHE. Source data are provided as a Source data file.
Fig. 6
Fig. 6. Maternal n-3 PUFA deficiency exacerbates microglial phagocytic activity towards synapses by activating the 12/15-LOX/12-HETE signaling pathway.
a Experimental setup. b FACS analysis of phagocytic uptake of pHrodo-labeled synaptosomes by CD11b+ microglial cells in primary culture exposed to PUFAs. Means ± SEM; n = 5–6 per condition. Two-tailed unpaired Student’s t-test; ***p = 0.0005, AA; *p = 0.0118, DHA; p = 0.55, EPA; p = 0.153; DPA n-6. c, d FACS analysis of phagocytic uptake of pHrodo-labeled synaptosomes by CD11b+ microglial cells in primary culture exposed to n-6 AA-derived (c) or n-3 EPA- and DHA-derived (d) lipids. Means ± SEM; n = 6–14 per condition. AA derivatives: Two-way ANOVA: time effect, F(1,33) = 171.8, ***p < 0.0001; treatment effect, F(2,33) = 5.538, **p = 0.0084; interaction, F(2,33) = 0.686, p = 0.51. EPA and DHA derivatives: Two-way ANOVA: time effect, F(1,64)=57.25 ***p < 0.0001; treatment effect, F(2,64) = 1.462, p = 0.239; interaction, F(2,64) = 1.904, p = 0.157. e Experimental setup. f FACS analysis of phagocytic uptake of pHrodo-labeled synaptosomes by freshly sorted n-3 deficient and n-3 sufficient CD11b+ microglial cells, exposed to baicalein or its solvent. Analyses were performed 2 h post-synaptosomes application. Two-way ANOVA: microglia fatty acid status effect, F(1,51) = 12.6 ***p = 0.0008; treatment effect, F(1,51) = 16.06, p = 0.0002; interaction, F(1,51) = 0.1912, p = 0.6638. g Time spent in novel vs familiar arm in the Y maze task in P21 and P30 n-3 deficient mice treated with baicalein or its vehicle. Means ± SEM; n = 10 (P21) or 5 (P30) mice per group. Paired t-test: P21: n-3 deficient group, p = 0.5; n-3 deficient + baicalein group, p = 0.11; P30: n-3 deficient group, p = 0.57; n-3 deficient + baicalein group, *p = 0.029. Source data are provided as a Source data file.
Fig. 7
Fig. 7. The 12/15-LOX/12-HETE signaling pathway controls gene expression of the complement pathway.
a Experimental setup. b, c Quantification of cd11b and c3ar mRNA expression in freshly sorted n-3 deficient and n-3 sufficient microglia, treated with baicalein or its vehicle. Means ± SEM; n = 4–6 per group. Two-way ANOVA: cd11b: diet effect, F(1,15) = 0.57, p = 0.46; treatment effect, F(1,15) = 1.37, p = 0.26; interaction, F(1,15) = 2.48, p = 0.14; c3ar: diet effect, F(1,18) = 1.36, p = 0.26; treatment effect, F(1,18) = 1.52, p = 0.23; interaction, F(1,18) = 4.36, *p = 0.051. d Experimental setup. e, f Quantification of cd11b and c3ar mRNA expression in freshly sorted n-3 deficient and n-3 sufficient microglia, exposed to synaptosomes for 2 h and treated with baicalein or its vehicle. Means ± SEM; n = 8 per group. Two-way ANOVA followed by Bonferroni post hoc test: cd11b: diet effect, F(1,28) = 0.16, p = 0.19; treatment effect, F(1,28) = 0.92, **p = 0.0028; interaction, F(1,28) = 0.072, p = 0.36; n-3 deficient + vehicle vs n-3 deficient+ baicalein, *p = 0.014; n-3 deficient + vehicle vs n-3 deficient+ baicalein, *p = 0.029; c3ar: diet effect, F(1,28) = 0.35, **p = 0.0034; treatment effect, F(1,28) = 0.0043, p = 0.72; interaction, F(1,28) = 0.0019, p = 0.81. Source data are provided as a Source data file.

References

    1. Bazinet RP, Layé S. Polyunsaturated fatty acids and their metabolites in brain function and disease. Nat. Rev. Neurosci. 2014;15:771–785. doi: 10.1038/nrn3820. - DOI - PubMed
    1. Abedi E, Sahari MA. Long-chain polyunsaturated fatty acid sources and evaluation of their nutritional and functional properties. Food Sci. Nutr. 2014;2:443–463. doi: 10.1002/fsn3.121. - DOI - PMC - PubMed
    1. Serhan CN, Petasis NA. Resolvins and protectins in inflammation resolution. Chem. Rev. 2011;111:5922–5943. doi: 10.1021/cr100396c. - DOI - PMC - PubMed
    1. Calder PC. The relationship between the fatty acid composition of immune cells and their function. Prostaglandins Leukot. Essent. Fat. Acids. 2008;79:101–108. doi: 10.1016/j.plefa.2008.09.016. - DOI - PubMed
    1. Layé S, Nadjar A, Joffre C, Bazinet RP. Anti-inflammatory effects of Omega-3 fatty acids in the brain: physiological mechanisms and relevance to pharmacology. Pharmacol. Rev. 2018;70:12–38. doi: 10.1124/pr.117.014092. - DOI - PubMed

Publication types

MeSH terms