. 2020 Nov 30;11(1):6122.
doi: 10.1038/s41467-020-19891-7.

Lethality of SARS-CoV-2 infection in K18 human angiotensin-converting enzyme 2 transgenic mice

Affiliations

Lethality of SARS-CoV-2 infection in K18 human angiotensin-converting enzyme 2 transgenic mice

Fatai S Oladunni et al. Nat Commun. .

Abstract

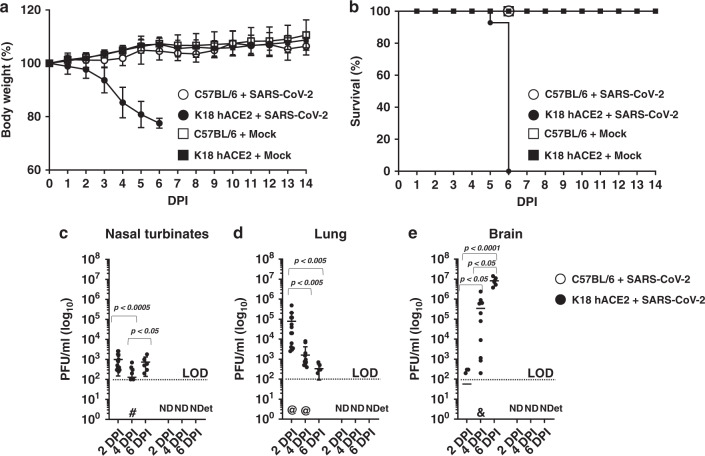
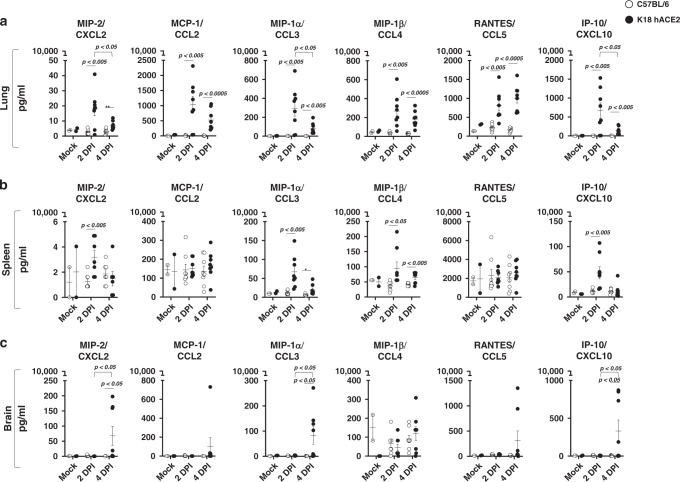
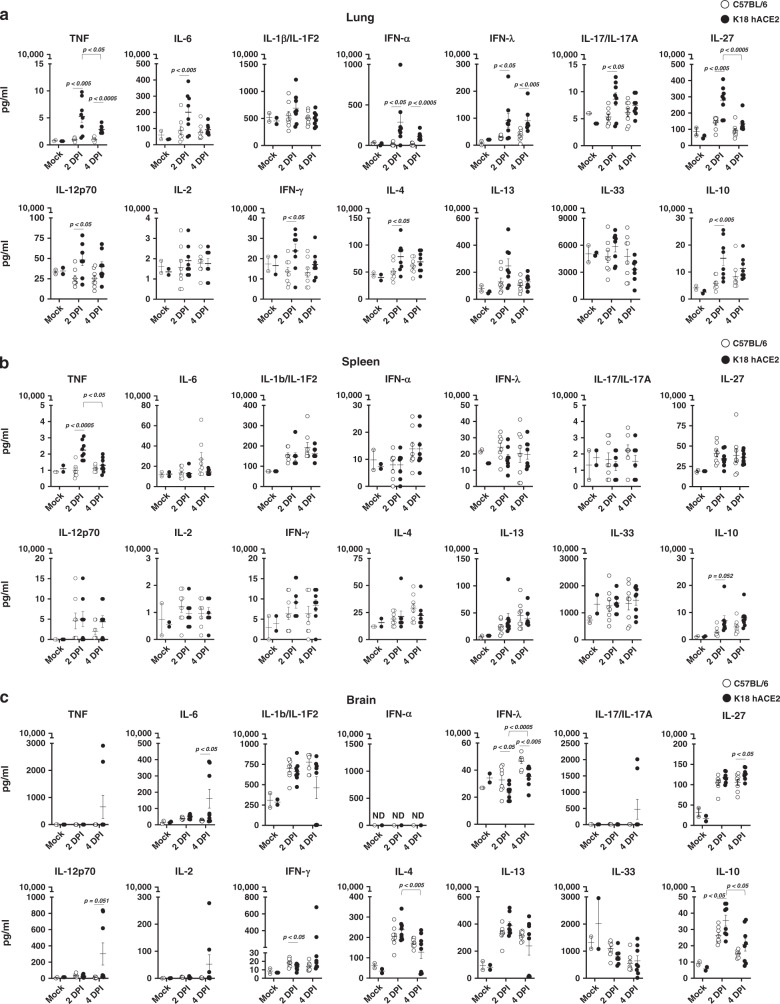
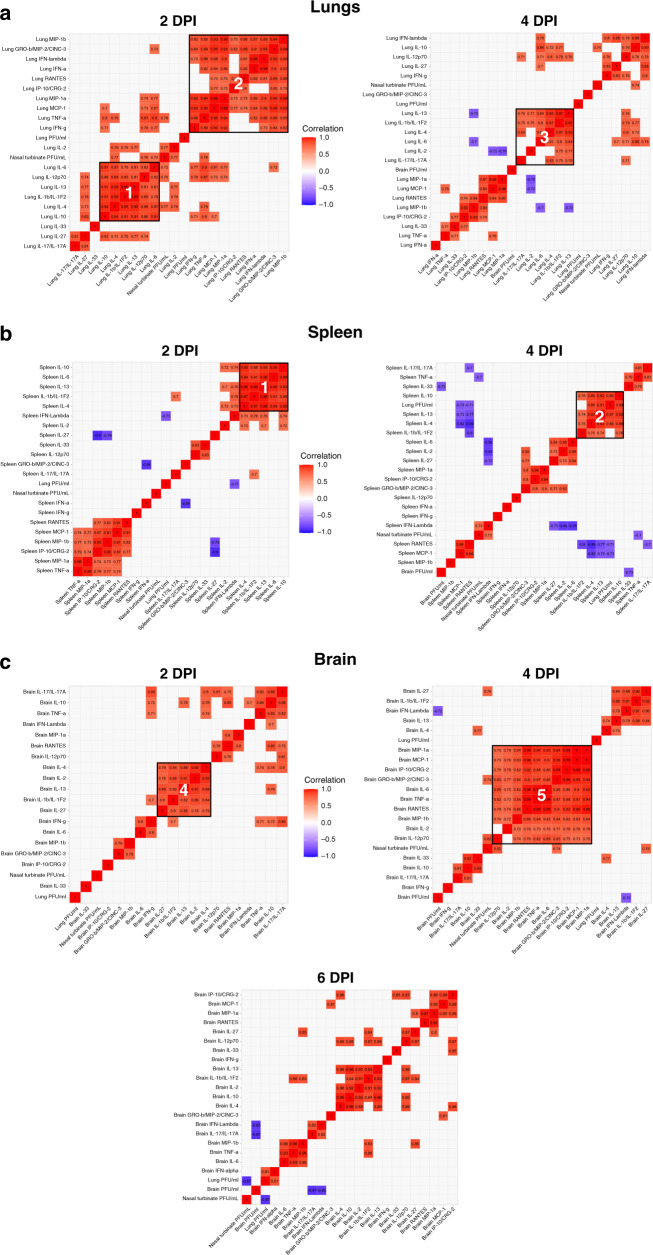
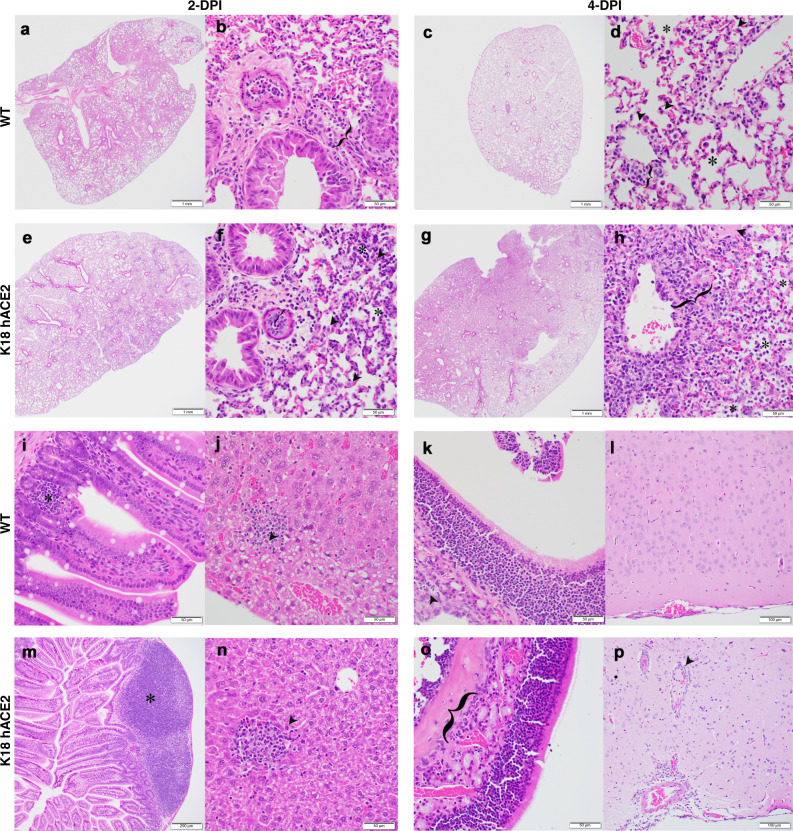
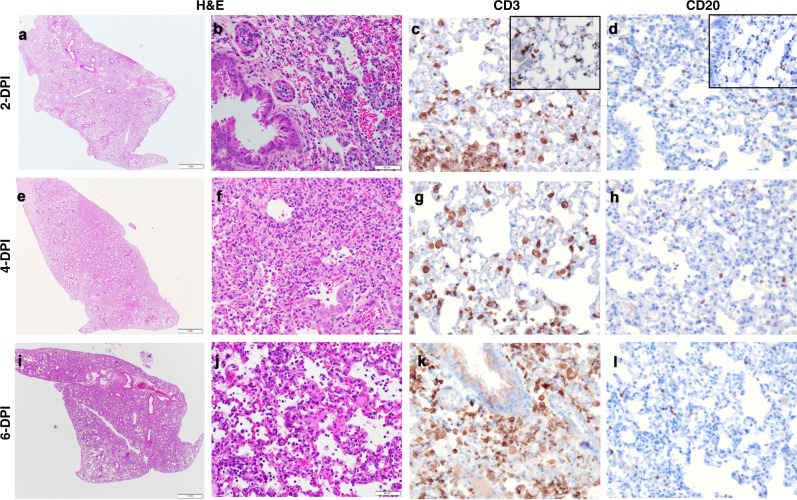
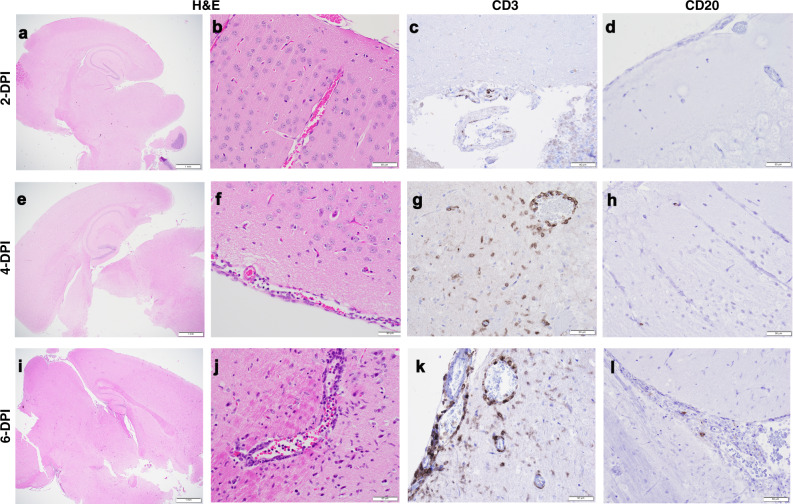
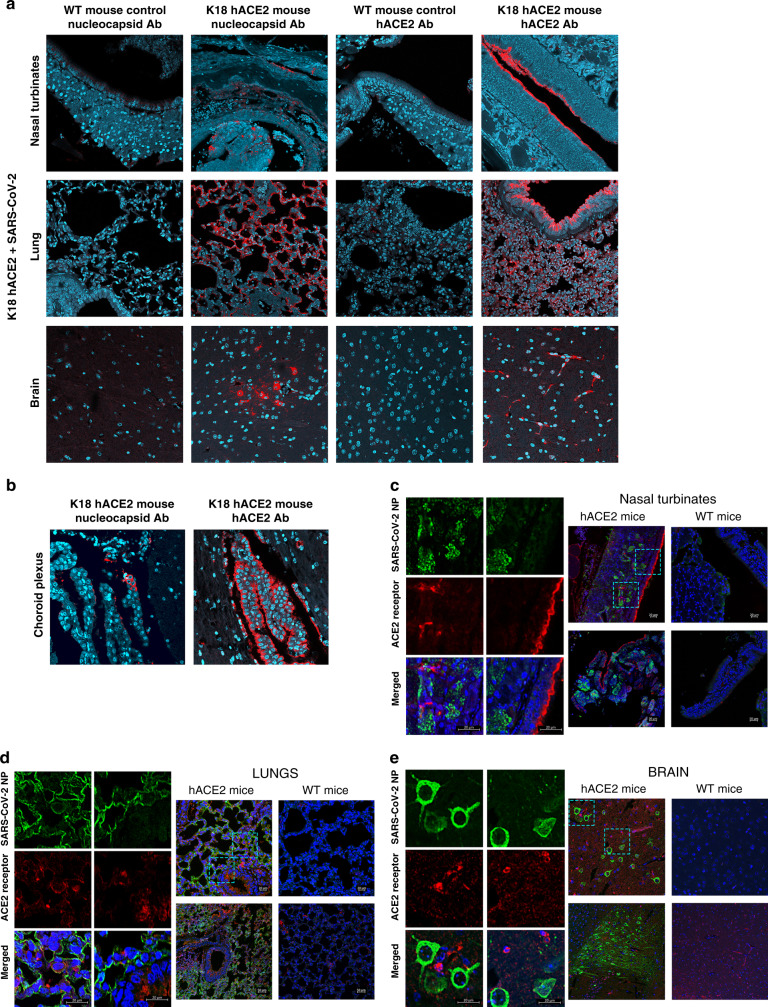
Vaccine and antiviral development against SARS-CoV-2 infection or COVID-19 disease would benefit from validated small animal models. Here, we show that transgenic mice expressing human angiotensin-converting enzyme 2 (hACE2) by the human cytokeratin 18 promoter (K18 hACE2) represent a susceptible rodent model. K18 hACE2 transgenic mice succumbed to SARS-CoV-2 infection by day 6, with virus detected in lung airway epithelium and brain. K18 ACE2 transgenic mice produced a modest TH1/2/17 cytokine storm in the lung and spleen that peaked by day 2, and an extended chemokine storm that was detected in both lungs and brain. This chemokine storm was also detected in the brain at day 6. K18 hACE2 transgenic mice are, therefore, highly susceptible to SARS-CoV-2 infection and represent a suitable animal model for the study of viral pathogenesis, and for identification and characterization of vaccines (prophylactic) and antivirals (therapeutics) for SARS-CoV-2 infection and associated severe COVID-19 disease.


Conflict of interest statement

The authors declare no competing interests.

Figures

Fig. 1
Fig. 1. Infection of K18 hACE2 transgenic and WT C57BL/6 mice with SARS-CoV-2.
K18 hACE2 transgenic and WT C57BL/6 female and male mice were mock-infected or infected i.n. with 1 × 105 PFU of SARS-CoV-2. Body weight (a, n = 14 and n = 6 for K18 hACE2 transgenic mice infected and mock-infected respectively; n = 8 for WT infected and n = 6 for WT mock infected) and survival (b, n values equal as in a) were evaluated at the indicated DPI. Mice that loss >25% of their initial body weight were humanely euthanized. Error bars represent standard deviations (SD) of the mean for each group of mice. ce K18 transgenic hACE2 (n = 34 mice distributed as n = 14 for 2 DPI, n = 14 for 4 DPI and n = 6 for 6 DPI, 50:50 male:female) and WT C57BL/6 (n = 16 mice distributed as n = 8 for 2 DPI and n = 8 for 4 DPI) mice were similarly infected and killed at 2 and 4 DPI and viral titers in different organs (nasal turbinate, trachea, lung, brain, heart, kidney, liver, spleen, small intestine, and large intestine) were determined by plaque assay (PFU/ml). Data from virus -containing organs and/or tissue samples are shown: nasal turbinates c, lungs d, and brain e. Symbols represent data from individual mouse, and bars represent the geometric means of viral titers, p < 0.05; p < 0.005; p < 0.0005; p < 0.0001. @ virus not detected in one mouse, & virus not detected in four mice, # virus not detected in six mice, ND not detected, NDet non-determined. Dotted lines indicate the limit of detection, LOD (102 PFU/ml). DPI days post infection. Data are combined from two independent experiments. Source data are provided as a Source Data file.
Fig. 2
Fig. 2. SARS-CoV-2-infected K18 hACE2 transgenic mice show a marked chemokine storm in selected tissues.
a Lung, b spleen, and c brain. Student’s t test, two-tailed, C57BL/6 vs. K18 hACE2 p < 0.05; p < 0.005; p < 0.0005; two-WAY ANOVA C57BL/6 or K18 hACE2 transgenic mice over time, p < 0.05; p < 0.005; p < 0.0005, M ± SEM, n = 8 mice (50:50 male:female per time-point studied, except mock n = 2 mice). DPI days post infection. Data are representative over two independent experiments. Source data are provided as a Source Data file.
Fig. 3
Fig. 3. SARS-CoV-2-infected K18 hACE2 transgenic mice show a marked cytokine storm in selected tissues.
a Lungs, b spleen, and c brain. Student’s t test, two-tailed, C57BL/6 vs. K18 hACE2 p < 0.05; p < 0.005; p < 0.0005; two-way ANOVA C57BL/6 or K18 hACE2 transgenic mice over time, p < 0.05; p < 0.005; p < 0.0005, M ± SEM, n = 8 mice (50:50 male:female per time-point studied, except mock n = 2 mice). DPI days post infection. Data are representative over two independent experiments. Source data are provided as a Source Data file.
Fig. 4
Fig. 4. SARS-CoV-2-infected K18 hACE2 transgenic mice reveal differentiated clusters of chemokine and cytokine correlations with clinical symptoms progression.
Hierarchically clustered Pearson correlations of measurements in a lung, b spleen, and c brain of SARS-CoV-2-infected K18 hACE2 transgenic mice. Positive correlation (Red = 1) and negative correlations (Blue = −1), with clusters (Black outlined boxes with cluster number). Non-significant values (p > 0.05 measured by Pearson’s correlation t test) were left blank; n = 8 mice (50:50 male:female per time-point studied, except mock n = 2 mice). DPI days post infection. MIP-2/CXCL2; MCP-1/CCL2; MIP-1α/CCL3; MIP-1β/CCL4; RANTES/CCL5; IP-10/CXCL10. Data are representative over two independent experiments. Source data are provided as a Source Data file.
Fig. 5
Fig. 5. K18 hACE2 transgenic mice develop rhinitis, pneumonia with associated pulmonary inflammation after infection with SARS-CoV-2.
ad and il WT C57BL/6 mice. Minimal mononuclear and neutrophilic interstitial pneumonia in WT lung at 2 DPI a, b bracket. By 4 DPI c, d minimal alveolar histiocytosis d, asterisk pneumocyte type II cells d, arrowheads, perivascular mononuclear inflammation d, bracket and rhinitis with low numbers of neutrophils k, arrowhead were variably observed. Lymphocyte aggregates in the lamina propria of the small intestine i, asterisk. Mixed mononuclear inflammation with individual hepatocellular necrosis j, arrowhead. Brain from WT 4 DPI was normal l. eh and mp K18 hACE2 transgenic mice. Interstitial pneumonia e, f associated with alveolar histiocytosis admixed neutrophils and lymphocytes f, asterisks, mild type II pneumocyte hyperplasia f, arrowhead, bronchiolar syncytia (f, arrow), endothelial cells hyperplasia and vasculitis (f, bracket) by 2 DPI. Gut-associated lymphoid tissue (GALT) with prominent germinal centers was observed (m, asterisk). Liver inflammation with variable amounts of individual hepatocellular necrosis (n, arrowhead). Greater lung involvement indicative of pneumonia (g), with inflammatory cellular accumulations and hemorrhage in alveolar spaces (h, asterisk) and interstitium (h, bracket), intra-alveolar fibrin admixed cellular debris (h, arrow), vasculitis (h, bracket), edema (h, arrowhead) by 4 DPI. Neutrophilic rhinitis observed at 4 DPI (o, bracket). Mild meningoencephalitis with vasculitis (p, arrowhead). Representative images of n = 8 (50:50 male:female per time-point and group) randomly chosen. Scale bars left images, 1 mm. Scale bars right images, 50 μm. DPI days post infection. Data are representative over two independent experiments.
Fig. 6
Fig. 6. T- and B-cell accumulation in lung of SARS-CoV-2-infected K18 hACE2 transgenic mice.
Incremental inflammation was noted histologically at 2 (a, b), 4 (e, f), and 6 (i, j) DPI. There was significant CD3 cytoplasmic immunolabeling of interstitial round cells in the lung that were morphologically consistent with lymphocytes. Alveolar and interstitial macrophages in the lungs also had strong cytoplasmic immunolabeling with CD3. Evaluation of control tissues (inset) showed CD3 antibody clearly labeling other inflammatory cells that were morphologically not consistent with T cells c, g, k. Individual positive CD20 B cells were apparent in the interstitium of the lung alveolar septa. CD20 B cells were present in similar amounts in control (inset) SARS-CoV-2-infected tissues d, h, l. Representative images of n = 6 (50:50 male:female per time-point and group) randomly chosen. Scale bars left images, 1 mm. Scale bars right images, 50 μm. Data are representative over two independent experiments.
Fig. 7
Fig. 7. T- and B-cell accumulation in brain of SARS-CoV-2-infected K18 hACE2 transgenic mice.
Normal brain shown at 2 DPI (a, b). Incremental mononuclear infiltrates were noted histologically at 4 (e, f) and 6 (i, j) DPI. There was CD3 cytoplasmic immunolabeling of rare round cells morphologically consistent with lymphocytes in the brain 2 DPI (c). Incremental meningeal, intra-parenchymal, and perivascular CD3-positive cells were observed in the brain of 4 (g) and 6 (k) DPI. Brain of 2 (d) and 4 (h) DPI were mostly negative for CD20. CD20-positive cells were rare at 6 DPI (l). The outer margins of vascular structures and in some occasions the collagenous connective tissue of the meninges exhibited non-specific staining. The brain of 2 and 4 DPI mice had rare individual intra-parenchymal CD3 cells, some of which were not morphologically consistent with round cells. Tissue time points and staining as Fig. 6. Representative images of n = 6 (three males and three females per time-point and group) randomly chosen. Scale bars left images, 1 mm. Scale bars right images, 50 μm. Data are representative over two independent experiments.
Fig. 8
Fig. 8. IHC examination of tissue from K18 hACE2 transgenic and WT C57BL/6 mice infected with SARS-CoV-2.
a WT and K18 hACE2 transgenic C57BL/6 mice nasal turbinate (top, at 2 DPI), lung tissue (middle, at 2 DPI), and brain (bottom, at 4 DPI) stained with an antibody against SARS-CoV-2 NP (red) or with antibody recognizing hACE2 receptor (red). b Infected choroid plexus in the brains of SARS-CoV-2-infected K18 hACE2 transgenic mice at 4 DPI. Left panel show that the hACE2 receptor (red) is highly expressed in the choroid plexus (all nuclei shown in aqua-blue). Right panel shows that some cells in the choroid plexus are infected with SARS-CoV-2 as these are positive to a SARS-CoV-2 NP (in red). c Nasal turbinates, d lung, and e brain from SARS-CoV-2-infected K18 hACE2 transgenic and wild-type mice at 2 DPI (bottom) and 4 DPI (top). Representative images of n = 8 for K18 hACE2 transgenic mice (50:50 male:female, per time point) and n = 2 for WT mice (50:50 male:female, per time-point) randomly chosen. Images magnified ×10 and ×20. Further magnification of selected areas (left, magnification bar 20 μm). hACE2 receptor (red), SARS-CoV-2 NP (green) as observed in nasal turbinates, lung, and brain tissues of K18 hACE2 transgenic mice (Blue: DAPI). Colocalization of hACE2 and SARS-CoV-2 NP is shown in the merged images. Data are representative over two independent experiments.

Similar articles

Cited by

References

    1. Hoffmann M, et al. SARS-CoV-2 cell entry depends on ACE2 and TMPRSS2 and is blocked by a clinically proven protease inhibitor. Cell. 2020;181:271–280 e278. doi: 10.1016/j.cell.2020.02.052. - DOI - PMC - PubMed
    1. Lu R, et al. Genomic characterisation and epidemiology of 2019 novel coronavirus: implications for virus origins and receptor binding. Lancet. 2020;395:565–574. doi: 10.1016/S0140-6736(20)30251-8. - DOI - PMC - PubMed
    1. Walls AC, et al. Structure, function, and antigenicity of the SARS-CoV-2 spike glycoprotein. Cell. 2020;181:281–292 e286. doi: 10.1016/j.cell.2020.02.058. - DOI - PMC - PubMed
    1. Yan R, et al. Structural basis for the recognition of SARS-CoV-2 by full-length human ACE2. Science. 2020;367:1444–1448. doi: 10.1126/science.abb2762. - DOI - PMC - PubMed
    1. Gheblawi M, et al. Angiotensin-converting enzyme 2: SARS-CoV-2 receptor and regulator of the renin-angiotensin system: celebrating the 20th anniversary of the discovery of ACE2. Circ. Res. 2020;126:1456–1474. doi: 10.1161/CIRCRESAHA.120.317015. - DOI - PMC - PubMed

Publication types

MeSH terms