. 2020 Nov 30;11(1):6087.
doi: 10.1038/s41467-020-19919-y.

MINPP1 prevents intracellular accumulation of the chelator inositol hexakisphosphate and is mutated in Pontocerebellar Hypoplasia

Affiliations

MINPP1 prevents intracellular accumulation of the chelator inositol hexakisphosphate and is mutated in Pontocerebellar Hypoplasia

Ekin Ucuncu et al. Nat Commun. .

Abstract

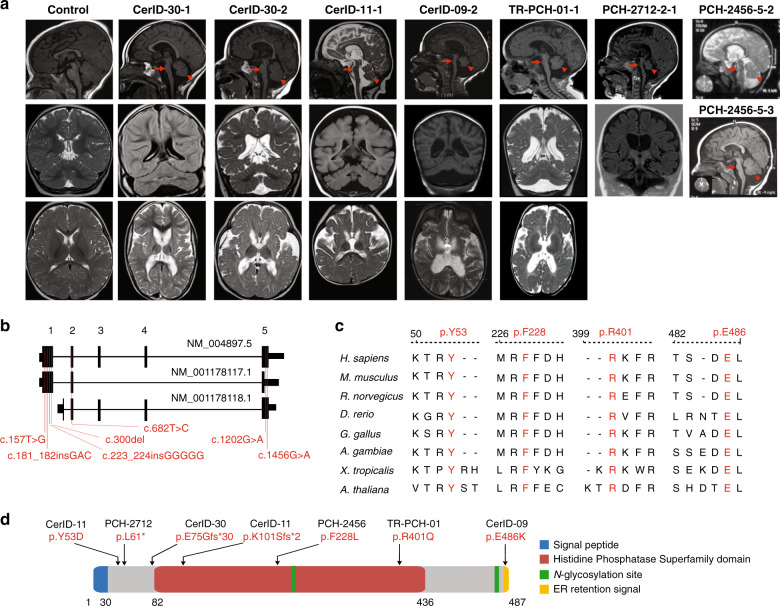
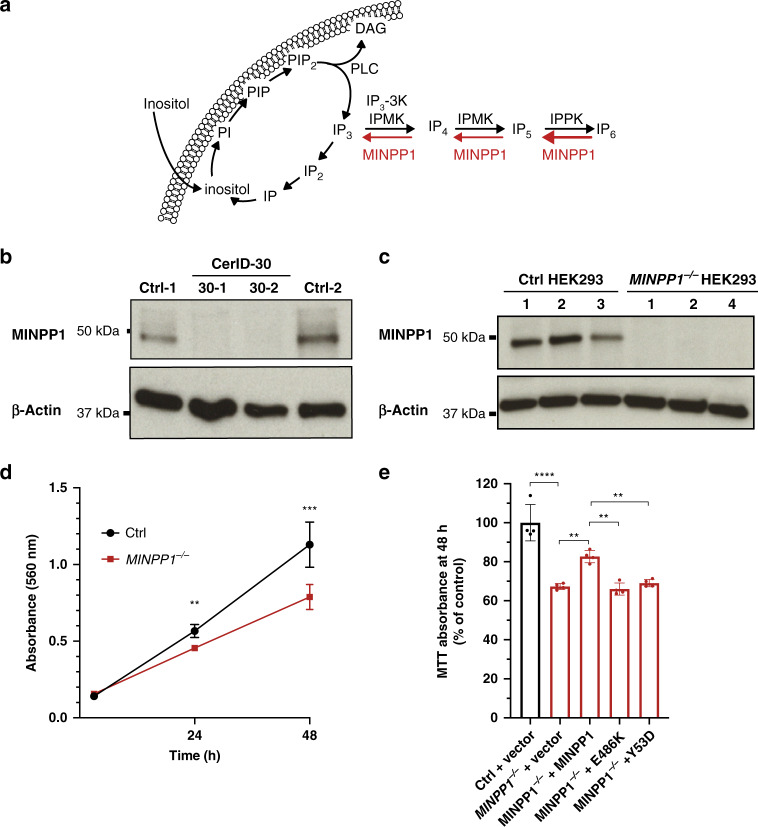
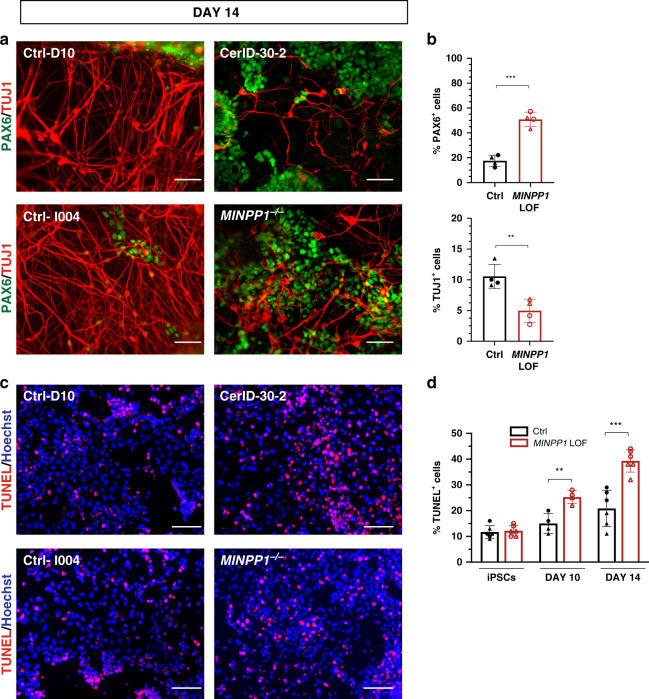
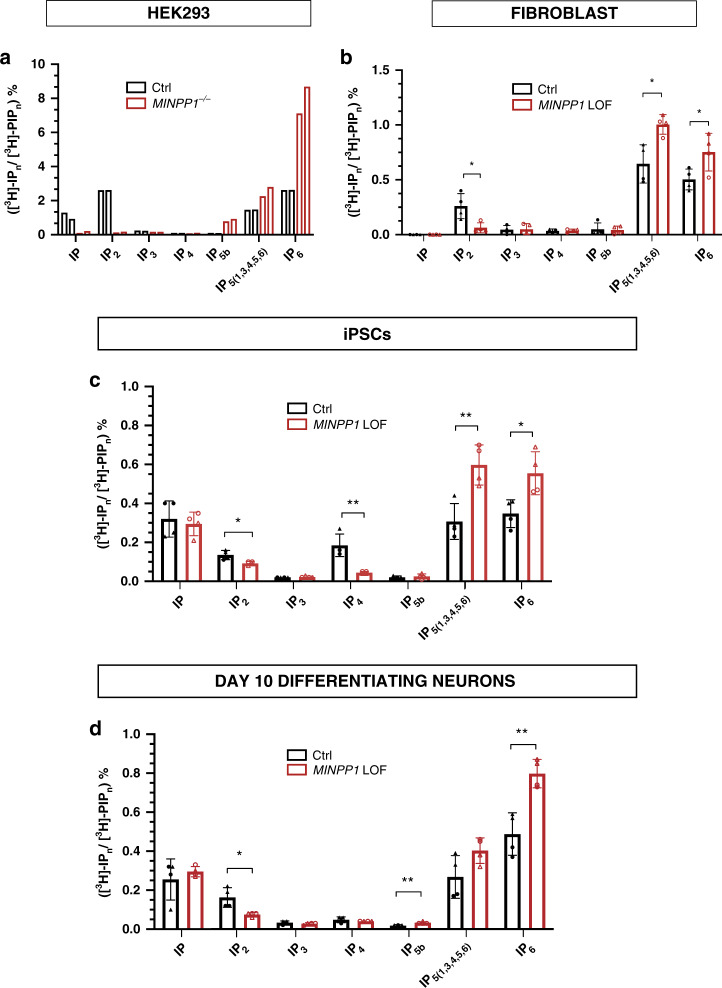
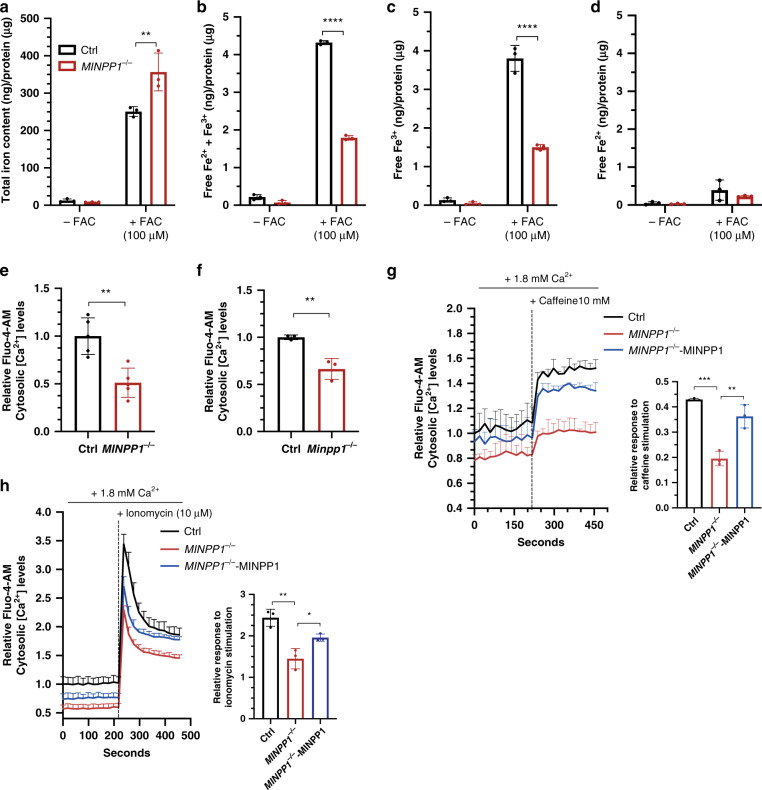
Inositol polyphosphates are vital metabolic and secondary messengers, involved in diverse cellular functions. Therefore, tight regulation of inositol polyphosphate metabolism is essential for proper cell physiology. Here, we describe an early-onset neurodegenerative syndrome caused by loss-of-function mutations in the multiple inositol-polyphosphate phosphatase 1 gene (MINPP1). Patients are found to have a distinct type of Pontocerebellar Hypoplasia with typical basal ganglia involvement on neuroimaging. We find that patient-derived and genome edited MINPP1-/- induced stem cells exhibit an inefficient neuronal differentiation combined with an increased cell death. MINPP1 deficiency results in an intracellular imbalance of the inositol polyphosphate metabolism. This metabolic defect is characterized by an accumulation of highly phosphorylated inositols, mostly inositol hexakisphosphate (IP6), detected in HEK293 cells, fibroblasts, iPSCs and differentiating neurons lacking MINPP1. In mutant cells, higher IP6 level is expected to be associated with an increased chelation of intracellular cations, such as iron or calcium, resulting in decreased levels of available ions. These data suggest the involvement of IP6-mediated chelation on Pontocerebellar Hypoplasia disease pathology and thereby highlight the critical role of MINPP1 in the regulation of human brain development and homeostasis.


Conflict of interest statement

The authors declare no competing interests.

Figures

Fig. 1
Fig. 1. Biallelic mutations in MINPP1 cause a distinct PCH phenotype.
a Midline sagittal (top), coronal (middle), and axial (bottom) brain MRIs of control and patients from families CerID-30, CerID-11, CerID-09, and TR-PCH-01, respectively. Only sagittal (top) and coronal (middle) brain MRIs were available for the patient from the family PCH-2712 and sagittal brain MRI for the patients from PCH-2456 (top and middle). Sagittal MRIs show variable degree of brainstem (arrow) and cerebellar atrophy/hypoplasia (arrowhead). b Schematic representation of the MINPP1 transcripts: NM_004897.5, NM_001178117.1, and NM_001178118.1, respectively. Exon numbers for the longest isoform NM_004897.5 are indicated above the schematic representation. Mutations are shown relative to their cDNA (NM_004897.5) position. c Multiple-sequence alignment of MINPP1 from different species. Variant amino-acid residues p.Y53, p.F228, p.R401, and p.E486 are evolutionarily conserved. d Linear schematic representation of MINPP1, showing the position of mutations with respect to predicted protein domains. Endoplasmic reticulum (ER).
Fig. 2
Fig. 2. PCH-associated mutations of MINPP1 are deleterious for protein function.
a Schematic representation of inositol phosphate cycle. myo-inositol (Inositol); phosphatidylinositol (PI); phosphatidylinositol phosphate (PIP); phosphatidylinositol 4,5-bisphosphate (PIP2); diacylglycerol (DAG); phospholipase C (PLC); inositol phosphate (IP); inositol bisphosphate (IP2); inositol 1,4,5-trisphosphate (IP3); inositol 1,3,4,5-tetrakisphosphate (IP4); inositol pentakisphosphate (IP5); inositol hexakisphosphate (IP6); inositol-polyphosphate multikinase (IPMK); I(1,4,5)P3 3-Kinase (IP3-3K); inositol-pentakisphosphate 2-kinase (IPPK); multiple inositol-polyphosphate phosphatase 1 (MINPP1). b, c Western blot analysis of MINPP1 level in patient fibroblasts and HEK293 cells with β-Actin shown as loading control. Patient fibroblasts CerID-30-1 and CerID-30-2 (b) and MINPP1/ HEK293 clones (c) show absent MINPP1. The uncropped blots are provided as a source data file and are representative of two independent experiments. d Assessment of cell proliferation by MTT assay. For each clone, MTT absorbance was measured 3, 24, and 48 h post-seeding. Values represent the mean ± s.d. of triplicate determinations from four replicates (n = 4, two-tailed student’s t-test, **p ≤ 0.01 and ***p ≤ 0.001. At 24 h, Ctrl vs. MINPP1/: p = 0.0018; at 48 h Ctrl vs. MINPP1/: p = 0.0009). e MINPP1/ HEK293 cells were transiently transfected with plasmids encoding empty vector, wild type, Y53D or E486K variant MINPP1. To assess the cell proliferation rate, MTT assay was performed 48 h post-nucleofection. The data are presented as mean percentage relative to control (Ctrl) ± s.d., with triplicate determinations from four replicates. The normalization was done with 3 h MTT assay data (n = 4, one-way ANOVA, Tukey’s post hoc test, **p ≤ 0.01 and ****p ≤ 0.0001. Ctrl vs. MINPP1/: p < 0.0001; MINPP1/ vs. MINPP1/ + MINPP1: p = 0.0029; MINPP1/ + MINPP1 vs. MINPP1/ + E486K: p = 0.0014; MINPP1/ + MINPP1 vs. MINPP1/ + Y53D: p = 0.0080). For (d) and (e), source data are provided as a source data file.
Fig. 3
Fig. 3. MINPP1 loss causes an early neuronal differentiation defect combined with an increase in apoptosis.
a Control (Ctrl-D10 (filled circle) and Ctrl-I004 (filled triangle)) and MINPP1 LOF (patient-derived (CerID-30-2 (blank circle) and MINPP1−/− (blank triangle)) iPSCs were differentiated toward neuronal lineage for 14 days. Representative images of the differentiated cells stained with early neuronal marker TUJ1 and neural progenitor marker PAX6. Hoechst was used as a nuclear stain. b Quantitative analysis of the immunofluorescence data. c Representative images of TUNEL staining during neuronal differentiation at day 14. d Quantification of the TUNEL assay during neuronal differentiation (iPSC, day 10 and day 14). All scale bars correspond to 50 μm. (For (b, c), n = 4, for (d), n = 6 for iPSCs and day 14, n = 4 for day 10. Duplicate/triplicate analysis of two independent experiments. Two-tailed student’s t-test, **p ≤ 0.01 and ***p ≤ 0.001. For (b) upper panel, Ctrl vs. MINPP1 LOF: p = 0.0001; for (b) lower panel, Ctrl vs. MINPP1 LOF: p = 0.0066; for day 10 data (d), Ctrl vs. MINPP1 LOF: p = 0.0045 and for day 14 data (d), Ctrl vs. MINPP1 LOF: p = 0.0003). The data are presented as mean percentage values ± s.d. For (b) and (d), source data are provided as a source data file.
Fig. 4
Fig. 4. MINPP1 absence leads to disruption in inositol phosphates metabolism.
ad SAX-HPLC analysis of inositol phosphate levels in MINPP1−/− HEK293 cells (a), patient fibroblasts (CerID-30-1 and CerID-30-2) (b), MINPP1 LOF (patient-derived (CerID-30-2 (blank circle) and MINPP1−/− (blank triangle)) iPSCs (c), and their day-10 differentiating neuron counterparts (d). The peaks ([3H]-IPn) were identified based on comparison to standards. [3H]-IPn levels are presented as percentage of total radioactivity in the inositol-lipid fraction ([3H]-PIPn). All error bars represent standard deviation (s.d.). (For (a), n = 2 and both experiments are represented. For (bd), n = 4, two-tailed student’s t-test, *p ≤ 0.05 and **p ≤ 0.01). IPn, inositol phosphates; PIPn, phosphatidylinositol phosphates. Source data are provided as a source data file.
Fig. 5
Fig. 5. Altered iron and calcium homeostasis in the absence of MINPP1 enzyme in HEK293 and Minpp1−/− mouse neural progenitor cells.
ad Quantification of total iron content (a), free iron (Fe2+ and Fe3+) (b), Fe3+ (c), and Fe2+ (d) levels in extracts from control and MINPP1/ HEK293 cells grown under low (−FAC) and high iron (+FAC, 100 µM) conditions. All values are normalized to the total protein concentration and represent the mean ± s.d (n = 3, two-way ANOVA Sidak test, **p ≤ 0.01 and ****p ≤ 0.0001. For (a), Ctrl vs. MINPP1−/−: p = 0.0023; for (b), Ctrl vs. MINPP1−/−: p ≤ 0.0001, and for (c), Ctrl vs. MINPP1−/−: p ≤ 0.0001). e, f Relative Fluo-4-AM cytosolic Ca2+ levels in control and MINPP1/ HEK293 cells (e), wild-type (WT) and Minpp1−/− E14 mouse neural progenitors (f). g, h Relative Fluo-4-AM cytosolic Ca2+ levels in control, MINPP1/ and MINPP1-overexpression stable line in MINPP1−/− HEK293 cells (MINPP1−/−-MINPP1) loaded either with 10 mM caffeine (g) or 10 µM ionomycin (h). The dotted line indicates the addition of either caffeine (g) or ionomycin (h). Relative response after caffeine or ionomycin stimulation (peak) is represented graphically (inset). For all of the calcium assay experiments, the data are normalized to cell number with MTT colorimetric assay and presented as mean values relative to control baseline fluorescence intensity control ± s.d. ((e) n = 5; (f) N = 3 mice, (g, h) n = 3, two-tailed student’s t-test (e, f) and one-way ANOVA, Tukey’s post hoc test (g, h), *p ≤ 0.05, **p ≤ 0.01, ***p ≤ 0.001). For (e), Ctrl vs. MINPP1−/−: p = 0.0021; for (f), Ctrl vs. Minpp1−/−: p = 0.007; for (g), Ctrl vs. MINPP1−/−: p = 0.0002; MINPP1−/− vs. MINPP1−/−-MINPP1: p = 0.0015; for h Ctrl vs. MINPP1−/−: p = 0.0018; MINPP1−/− vs. MINPP1−/−-MINPP1: p = 0.0402. For all panels, source data are provided as a source data file.

References

    1. Irvine RF, Schell MJ. Back in the water: the return of the inositol phosphates. Nat. Rev. Mol. Cell Biol. 2001;2:327–338. - PubMed
    1. Irvine RF. 20 years of Ins(1,4,5)P3, and 40 years before. Nat. Rev. Mol. Cell Biol. 2003;4:586–590. doi: 10.1038/nrm1152. - DOI - PubMed
    1. York JD. Regulation of nuclear processes by inositol polyphosphates. Biochim. Biophys. Acta. 2006;1761:552–559. doi: 10.1016/j.bbalip.2006.04.014. - DOI - PubMed
    1. Raboy V. myo-Inositol-1,2,3,4,5,6-hexakisphosphate. Phytochemistry. 2003;64:1033–1043. doi: 10.1016/S0031-9422(03)00446-1. - DOI - PubMed
    1. Shears SB. Assessing the omnipotence of inositol hexakisphosphate. Cell Signal. 2001;13:151–158. doi: 10.1016/S0898-6568(01)00129-2. - DOI - PubMed

Publication types

MeSH terms

Substances

Supplementary concepts