

Diversification of methanogens into hyperalkaline serpentinizing environments through adaptations to minimize oxidant limitation
- PMID: 33257813
- PMCID: PMC8115248
- DOI: 10.1038/s41396-020-00838-1
Diversification of methanogens into hyperalkaline serpentinizing environments through adaptations to minimize oxidant limitation
Abstract
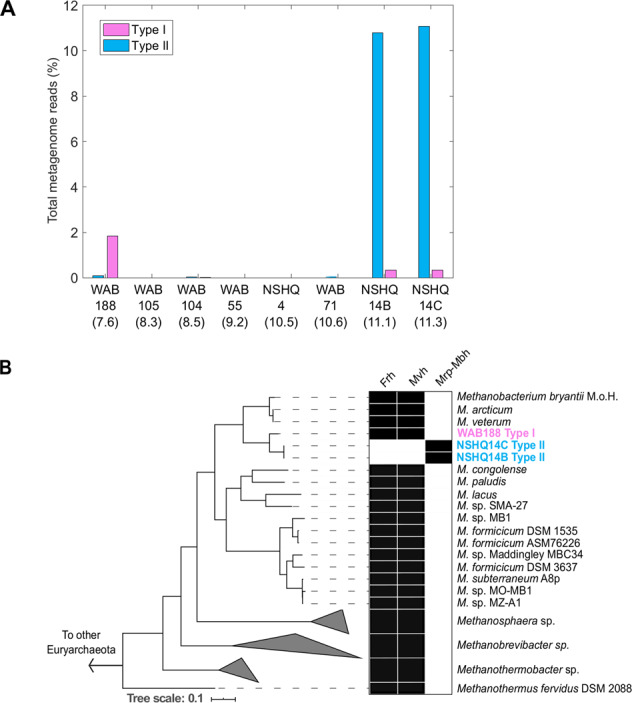
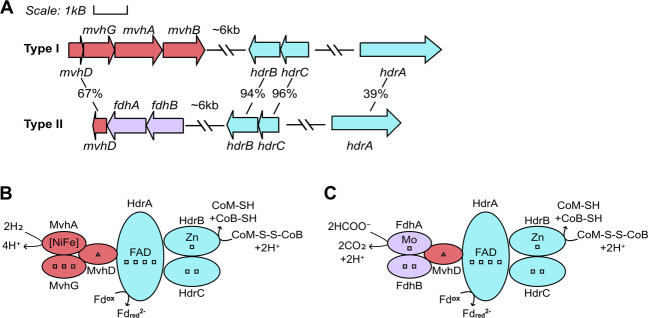
Metagenome assembled genomes (MAGs) and single amplified genomes (SAGs) affiliated with two distinct Methanobacterium lineages were recovered from subsurface fracture waters of the Samail Ophiolite, Sultanate of Oman. Lineage Type I was abundant in waters with circumneutral pH, whereas lineage Type II was abundant in hydrogen rich, hyperalkaline waters. Type I encoded proteins to couple hydrogen oxidation to CO2 reduction, typical of hydrogenotrophic methanogens. Surprisingly, Type II, which branched from the Type I lineage, lacked homologs of two key oxidative [NiFe]-hydrogenases. These functions were presumably replaced by formate dehydrogenases that oxidize formate to yield reductant and cytoplasmic CO2 via a pathway that was unique among characterized Methanobacteria, allowing cells to overcome CO2/oxidant limitation in high pH waters. This prediction was supported by microcosm-based radiotracer experiments that showed significant biological methane generation from formate, but not bicarbonate, in waters where the Type II lineage was detected in highest relative abundance. Phylogenetic analyses and variability in gene content suggested that recent and ongoing diversification of the Type II lineage was enabled by gene transfer, loss, and transposition. These data indicate that selection imposed by CO2/oxidant availability drove recent methanogen diversification into hyperalkaline waters that are heavily impacted by serpentinization.
Conflict of interest statement
The authors declare that they have no conflict of interest.
Figures


Similar articles
-
Molecular Evidence for an Active Microbial Methane Cycle in Subsurface Serpentinite-Hosted Groundwaters in the Samail Ophiolite, Oman.Appl Environ Microbiol. 2021 Jan 4;87(2):e02068-20. doi: 10.1128/AEM.02068-20. Print 2021 Jan 4. Appl Environ Microbiol. 2021. PMID: 33127818 Free PMC article.
-
Metapangenomic investigation provides insight into niche differentiation of methanogenic populations from the subsurface serpentinizing environment, Samail Ophiolite, Oman.Front Microbiol. 2023 Jul 3;14:1205558. doi: 10.3389/fmicb.2023.1205558. eCollection 2023. Front Microbiol. 2023. PMID: 37465028 Free PMC article.
-
Deep-branching acetogens in serpentinized subsurface fluids of Oman.Proc Natl Acad Sci U S A. 2022 Oct 18;119(42):e2206845119. doi: 10.1073/pnas.2206845119. Epub 2022 Oct 10. Proc Natl Acad Sci U S A. 2022. PMID: 36215489 Free PMC article.
-
Metabolism of methanogens.Antonie Van Leeuwenhoek. 1994;66(1-3):187-208. doi: 10.1007/BF00871639. Antonie Van Leeuwenhoek. 1994. PMID: 7747931 Review.
-
Energy Conservation and Hydrogenase Function in Methanogenic Archaea, in Particular the Genus Methanosarcina.Microbiol Mol Biol Rev. 2019 Sep 18;83(4):e00020-19. doi: 10.1128/MMBR.00020-19. Print 2019 Nov 20. Microbiol Mol Biol Rev. 2019. PMID: 31533962 Free PMC article. Review.
Cited by
-
An untargeted exometabolomics approach to characterize dissolved organic matter in groundwater of the Samail Ophiolite.Front Microbiol. 2023 Mar 9;14:1093372. doi: 10.3389/fmicb.2023.1093372. eCollection 2023. Front Microbiol. 2023. PMID: 36970670 Free PMC article.
-
Polyurethane-Degrading Potential of Alkaline Groundwater Bacteria.Microb Ecol. 2023 Dec 28;87(1):21. doi: 10.1007/s00248-023-02338-z. Microb Ecol. 2023. PMID: 38153543
-
A self-sustaining serpentinization mega-engine feeds the fougerite nanoengines implicated in the emergence of guided metabolism.Front Microbiol. 2023 May 15;14:1145915. doi: 10.3389/fmicb.2023.1145915. eCollection 2023. Front Microbiol. 2023. PMID: 37275164 Free PMC article.
-
Metabolic challenges and key players in serpentinite-hosted microbial ecosystems.Front Microbiol. 2023 Jul 24;14:1197823. doi: 10.3389/fmicb.2023.1197823. eCollection 2023. Front Microbiol. 2023. PMID: 37555067 Free PMC article. Review.
-
Synergistic Effects of Silica-Supported Iron-Cobalt Catalysts for CO2 Reduction to Prebiotic Organics.ChemCatChem. 2024 Mar 14;16(11):cctc.202301218. doi: 10.1002/cctc.202301218. eCollection 2024 Jun 10. ChemCatChem. 2024. PMID: 39363906 Free PMC article.
References
-
- Boyd ES, Schut GJ, Adams MWW, Peters JW. Hydrogen metabolism and the evolution of biological respiration. Microbe. 2014;9:361–7.
-
- Hoehler TM. Biogeochemistry of dihydrogen (H2). In: Sigel H, and Sigel R (eds.). Metal ions in biological systems. Vol 43. (Taylor & Francis Group, Boca Raton, FL, 2005) pp 9-48. - PubMed
-
- Weiss MC, Sousa FL, Mrnjavac N, Neukirchen S, Roettger M, Nelson-Sathi S, et al. The physiology and habitat of the last universal common ancestor. Nat Microbiol. 2016;1:1–8. - PubMed
-
- McCollom TM, Klein F, Robbins M, Moskowitz B, Berquó TS, Jöns N, et al. Temperature trends for reaction rates, hydrogen generation, and partitioning of iron during experimental serpentinization of olivine. Geochim Cosmochim Acta. 2016;181:175–200. doi: 10.1016/j.gca.2016.03.002. - DOI
