. 2021 Jan;124(1):191-206.
doi: 10.1038/s41416-020-01174-z. Epub 2020 Dec 1.

RON signalling promotes therapeutic resistance in ESR1 mutant breast cancer

Affiliations

RON signalling promotes therapeutic resistance in ESR1 mutant breast cancer

Derek Dustin et al. Br J Cancer. 2021 Jan.

Abstract

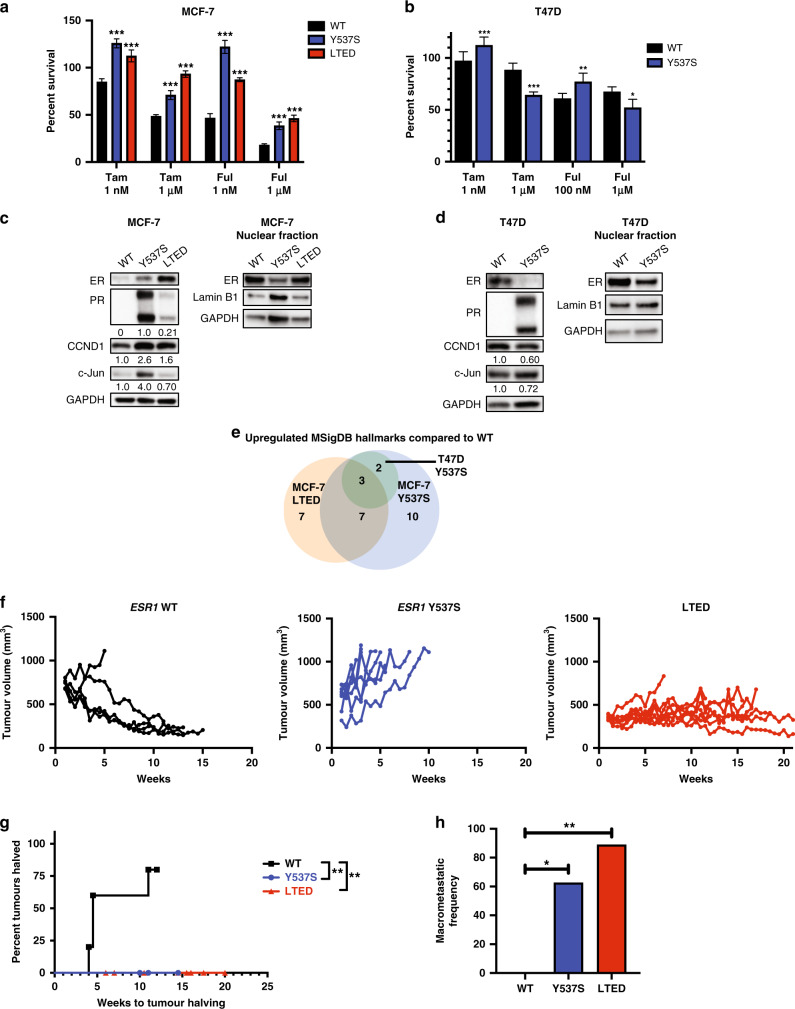
Background: Oestrogen Receptor 1 (ESR1) mutations are frequently acquired in oestrogen receptor (ER)-positive metastatic breast cancer (MBC) patients who were treated with aromatase inhibitors (AI) in the metastatic setting. Acquired ESR1 mutations are associated with poor prognosis and there is a lack of effective therapies that selectively target these cancers.

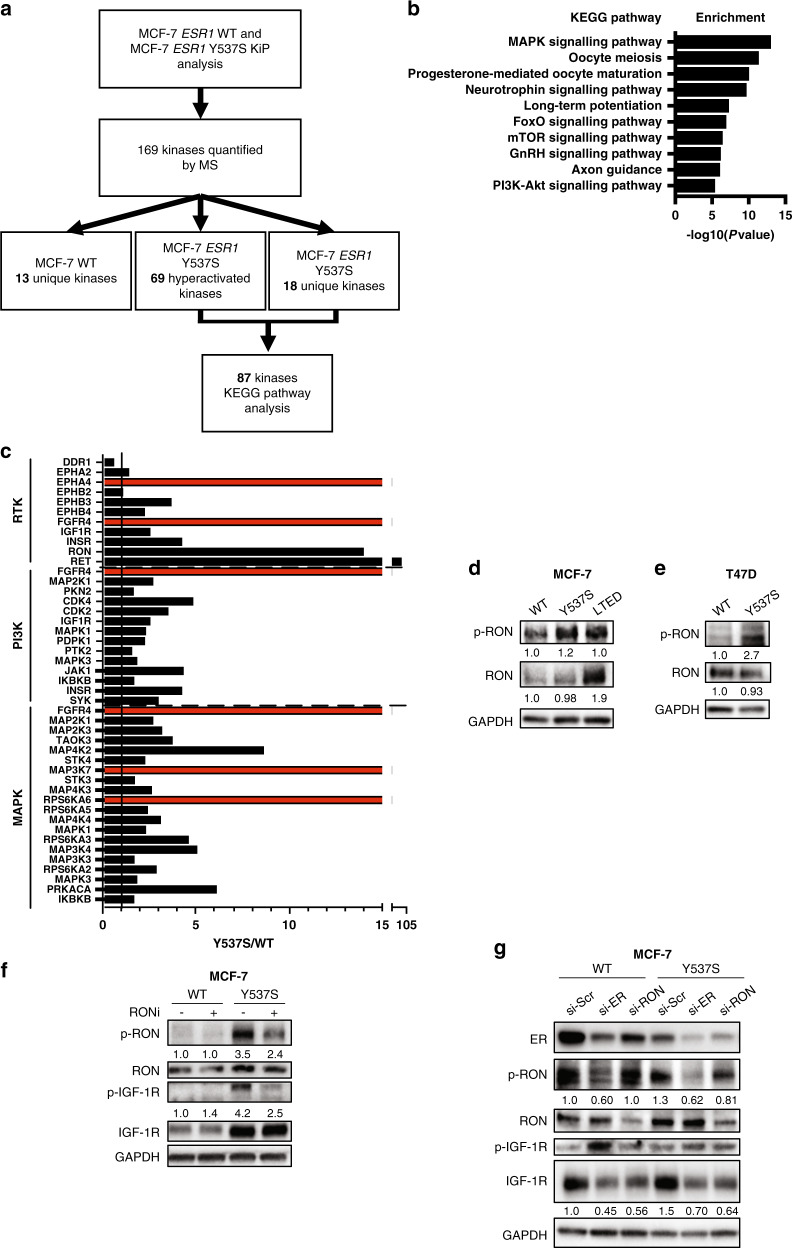
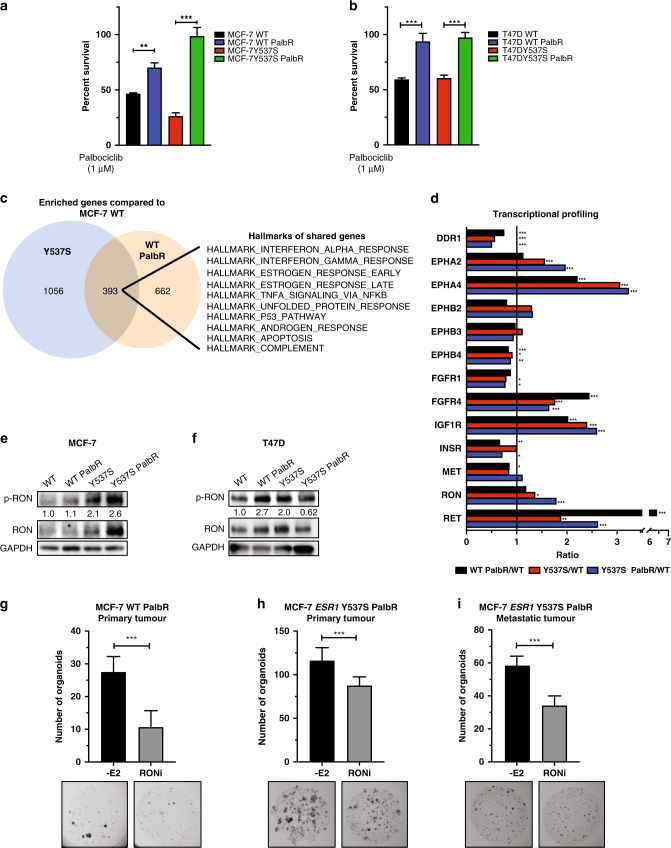
Methods: We performed a proteomic kinome analysis in ESR1 Y537S mutant cells to identify hyperactivated kinases in ESR1 mutant cells. We validated Recepteur d'Origine Nantais (RON) and PI3K hyperactivity through phospho-immunoblot analysis, organoid growth assays, and in an in vivo patient-derived xenograft (PDX) metastatic model.

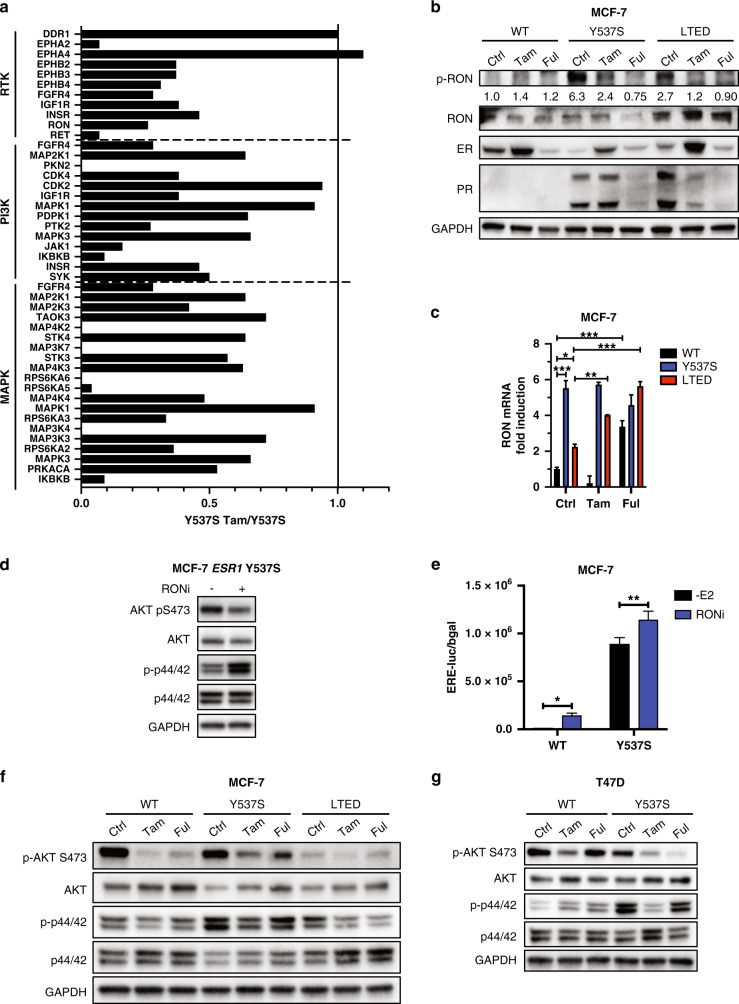
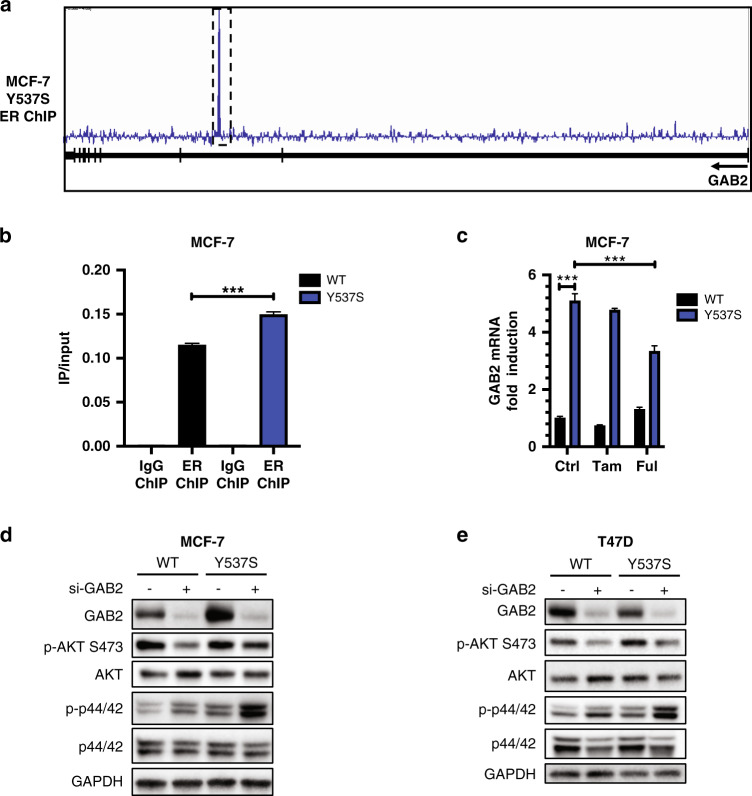
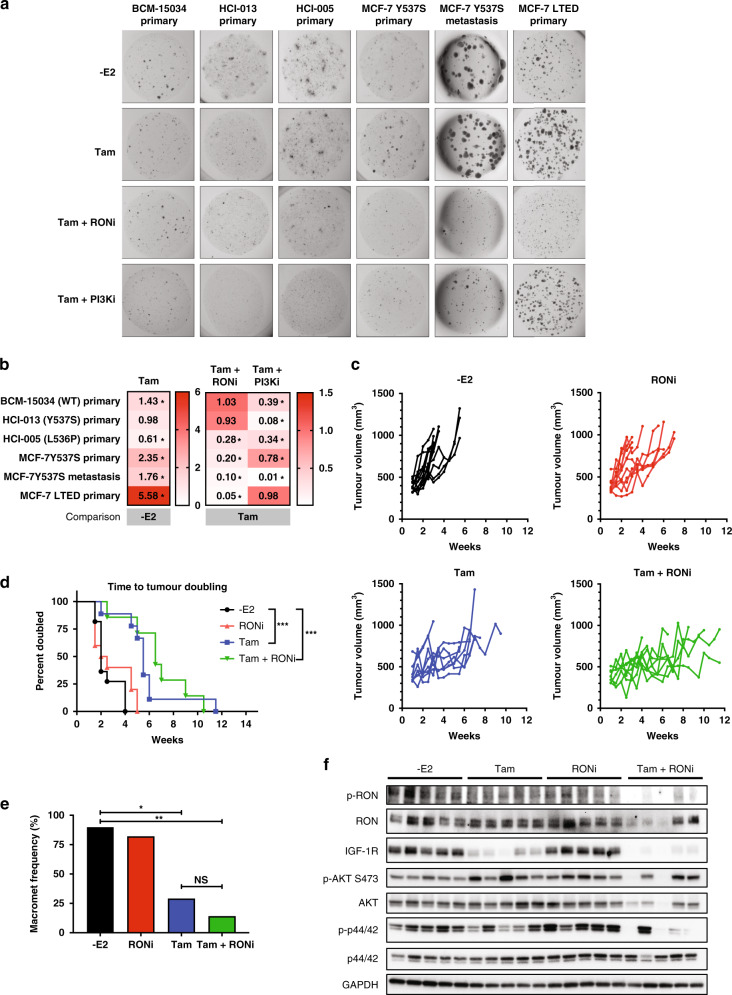
Results: We demonstrated that RON was hyperactivated in ESR1 mutant models, and in acquired palbociclib-resistant (PalbR) models. RON and insulin-like growth factor 1 receptor (IGF-1R) interacted as shown through pharmacological and genetic inhibition and were regulated by the mutant ER as demonstrated by reduced phospho-protein expression with endocrine therapies (ET). We show that ET in combination with a RON inhibitor (RONi) decreased ex vivo organoid growth of ESR1 mutant models, and as a monotherapy in PalbR models, demonstrating its therapeutic efficacy. Significantly, ET in combination with the RONi reduced metastasis of an ESR1 Y537S mutant PDX model.

Conclusions: Our results demonstrate that RON/PI3K pathway inhibition may be an effective treatment strategy in ESR1 mutant and PalbR MBC patients. Clinically our data predict that ET resistance mechanisms can also contribute to CDK4/6 inhibitor resistance.


Conflict of interest statement

ALW previously received research support from Aslan Pharmaceuticals. SAWF is a Subject Editor, member of the Editorial Board of BJC and Guest Editor of the Special Issue on Metastasis.

Figures

Fig. 1
Fig. 1. ESR1 mutant models exhibited oestrogen-independent growth and metastatic propensity.
a MTT growth assay of Tam and Ful-treated MCF-7 and b T47D cells. Percent survival is normalised to no treatment controls. Graphs represent mean + standard deviation (N = 3 replicates) one-way ANOVA was used for statistical analysis. c MCF-7 cells were cultured in charcoal-stripped serum supplemented media, underwent whole cell lysis, and analysed by immunoblot for ER-regulated proteins (left). Values below PR, CCND1 and c-Jun represent normalised densitometry of each protein compared to GAPDH. PR was not detected in WT cells; thus, relative expression was normalised to Y537S cells. Cells were cultured in charcoal-stripped supplemented media and underwent cellular fractionation (right). Nuclear fraction is shown. d T47D cells were cultured in charcoal-stripped serum supplemented media and analysed by immunoblot for ER-regulated proteins (left). Values below PR, CCND1 and c-Jun represent normalised densitometry of each protein compared to GAPDH. PR was not detected in WT cells. Cells were cultured in charcoal-stripped supplemented media and underwent cellular fractionation (right). e Venn diagram of upregulated MSigDB Hallmark gene sets in MCF-7 ESR1 Y537S and LTED cells compared to MCF-7 ESR1 WT, and T47D ESR1 Y537S compared to T47D ESR1 WT. The numbers shown are of Hallmarks with a false discovery rate < 0.25. f In vivo individual tumour growth curves of MCF-7 ESR1 WT, ESR1 Y537S and LTED tumours. g In vivo primary tumour growth of MCF-7 WT, ESR1 Y537S and LTED tumours shown by time to tumour halving after E2 withdrawal. The Mantel-Cox test was used for statistical analysis (WT N = 5, Y537S N = 8, LTED N = 9). h Metastatic frequency in MCF-7 ESR1 WT-, ESR1 Y537S- and LTED-transplanted mice (WT N = 5, Y537S N = 8, LTED N = 9). Metastatic frequency is represented by the total number of mice per group that exhibited a macrometastasis. Fisher’s Exact test was used for statistical analysis. P < 0.05 was considered statistically significant in all tests. (*p < 0.05, **p < 0.01, ***p < 0.001).
Fig. 2
Fig. 2. ESR1 mutations induced a global kinome reprogramming.
a Flowchart demonstrating the total number of kinases captured in KiP experiment and the selection of kinases used to perform KEGG pathway analysis. Hyperactivated was defined as Y537S/WT ≥ 1.5-fold. Unique was defined as having corresponding peptide detection by MS in only MCF-7 ESR1 WT or MCF-7 ESR1 Y537S cells. b KEGG pathway analysis of the hyperactivated kinases in ESR1 Y537S cells. Analysis was performed using the DAVID Bioinformatics Functional Annotation Tool. c Y537S/WT quantitative ratio of kinases in KiP analysis categorised by RTKs, PI3K, and MAPK pathways. Red bars represent Y537S-unique activated kinases. d MCF-7 cells were cultured in charcoal-stripped serum-supplemented media and analysed by immunoblot for phosphorylated and total RON. Numbers below each protein represent normalised densitometry of each protein compared to GAPDH. e T47D cells were cultured in charcoal-stripped serum-supplemented media and analysed by immunoblot for phosphorylated and total RON. Numbers below each protein represent normalised densitometry of each protein compared to GAPDH. f MCF-7 cells were cultured in full serum-supplemented media and treated with BMS-777607/ASLAN002 (RONi) for 90 min and analysed by immunoblot for phosphorylated and total RON and IGF-1R. Numbers below each protein represent normalised densitometry of each protein compared to GAPDH. g MCF-7 cells were cultured in full serum-supplemented media and transfected with indicated siRNA. Immunoblot analysis for phosphorylated and total IGF-1R was performed two days post transfection. Numbers below each protein represent normalised densitometry of each protein compared to GAPDH.
Fig. 3
Fig. 3. ET reduced RON/PI3K pathway activation.
a Fold change of kinases in KiP analysis in MCF-7 Y537S cells after treatment with Tam. X-values represent fold change of Tam-treated Y537S cells compared to untreated Y537S cells. b MCF-7 cells were cultured in 10% FBS supplemented media and treated with 1 µM Tam and 1 µM Ful for 48 h. Immunoblot analysis of phosphorylated and total RON was performed. Numbers below each protein represent normalised densitometry of each protein compared to GAPDH. c MCF-7 cells were cultured in 10% FBS supplemented media and treated with Tam and Ful for 48 h. qRT-PCR analysis of RON was performed. Graphs represent mean + standard error of the mean (N = 3 replicates). Two-way ANOVA was used for statistical analysis. d MCF-7 cells were cultured in 10% FBS supplemented media and treated with RONi for ninety minutes. Immunoblot analysis was performed for phosphorylated and total AKT and p44/42 MAPK. e MCF-7 cells were cultured in charcoal-stripped serum supplemented media and treated with RONi for 24 hours and ER transactivation assay was performed. Graphs represent mean + standard deviation (N = 3 replicates). Student’s t-test was used for statistical analysis. f MCF-7 cells were cultured in 10% FBS supplemented media and treated with 1 µM Tam and 1 µM Ful for 48 h. Immunoblot of phosphorylated and total AKT and p44/42 MAPK was performed. g T47D cells were cultured in 10% FBS supplemented media and treated with Tam and Ful for 48 h. Immunoblot of phosphorylated and total AKT and p44/42 MAPK was performed. P < 0.05 was considered statistically significant in all tests. (*p < 0.05, **p < 0.01, ***p < 0.001).
Fig. 4
Fig. 4. The Y537S mutant ER regulated key mediators of the RON/PI3K pathway.
a ER ChIP-Seq track for GAB2 gene body in MCF-7 ESR1 Y537S cells. b ER ChIP-qPCR in MCF-7 ESR1 WT and MCF-7 ESR1 Y537S cells at the binding site highlighted in a. Graphs represent mean + standard deviation (N = 3 replicates). Student’s t-test was performed for statistical analysis. c MCF-7 cells were cultured in 10% FBS supplemented media and treated with 1 µM Tam and 1 µM Ful for 48 h. qRT-PCR analysis of GAB2 was performed. Graphs represent mean + standard error of the mean (N = 3 replicates). Two-way ANOVA was performed for statistical analysis. d MCF-7 cells were cultured in 10% FBS supplemented media and transfected with scrambled (Scr) siRNA and GAB2 siRNA. Immunoblot analysis of phosphorylated and total AKT and p44/42 MAPK was performed 48 h post transfection. e T47D cells were cultured in 10% FBS supplemented media and transfected with GAB2 siRNA. Immunoblot analysis of phosphorylated and total AKT and p44/42 MAPK was performed 48 h post transfection. P < 0.05 was considered statistically significant for all tests. (*p < 0.05, **p < 0.01, ***p < 0.001).
Fig. 5
Fig. 5. ESR1 mutant intrinsic resistance predisposed cells to palbociclib resistance.
a MTT growth assay of MCF-7 and MCF-7 PalbR models after treatment with palbociclib. Mean + standard deviations are shown (N = 3 replicates). Two-way ANOVA was used for statistical analysis. b MTT growth assay of T47D and T47D PalbR models after treatment with palbociclib. Mean with standard deviations are shown (N = 3 replicates). One-way ANOVA was used for statistical analysis. c Venn diagram of upregulated genes in MCF-7 ESR1 Y537S and MCF-7 WT PalbR cells compared to MCF-7 WT. GSEA Hallmarks are of the shared upregulated genes. d Microarray profiling of RTKs in MCF-7 WT PalbR cells and ESR1 Y537S cells compared to MCF-7 WT. X-values represent microarray expression fold change ratios of average values per condition (N = 3 replicates/condition). ANOVA was performed for statistical analysis. e MCF-7 cells were cultured in 10% FBS supplemented media and analysed by immunoblot for phosphorylated and total RON. Numbers below each protein represent normalised densitometry of each protein compared to GAPDH. f T47D cells were cultured in 10% FBS supplemented media and analysed by immunoblot for phosphorylated and total RON. Numbers below each protein represent normalised densitometry of each protein compared to GAPDH. g Organoid growth assays with RONi treatment in MCF-7 WT PalbR primary tumour, h MCF-7 ESR1 Y537S PalbR primary tumour, and i) MCF-7 ESR1 Y537S PalbR metastatic tumour. Bar graphs in gi represent mean number of organoids + standard deviation (N = 3 replicates). Student’s t-test was used for statistical analysis. P < 0.05 was considered statistically significant for all tests. (*p < 0.05, **p < 0.01, ***p < 0.001).
Fig. 6
Fig. 6. Inhibition of the RON signalling pathway restored ET sensitivity.
a Representative images of organoids after a 2-week treatment with indicated inhibitors. b Heat map quantitation of treated organoids. Cell values represent quantitative ratio of the number of organoids in each treatment to the indicated comparison; Tam is relative to –E2 control; Tam + RONi and Tam + PI3Ki is relative to Tam (N = 3 replicates/treatment). One-way ANOVA and Tukey test was performed for multiple comparisons. Asterisks indicate indicated comparison was statistically significant (*p < 0.05). c Individual primary tumour growth curves of WHIM20 tumours in mice treated with -E2, RONi, Tam, or Tam + RONi. d In vivo primary tumour growth of WHIM20 PDX model with indicated treatments, represented as time to tumour doubling. The Mantel-Cox test was used for statistical analysis (-E2 N = 9, RONi N = 10, Tam N = 9, Tam + RONi N = 7) Primary tumours that did not reach predefined tumour doubling criteria were excluded from analysis. e Metastatic frequency of WHIM20 tumours (-E2 N = 11, RONi N = 11, Tam N = 7, Tam + RONi N = 7). Metastatic frequency is represented by the total number of mice per group that exhibited a macrometastasis. Animals that died prior to the defined endpoint were excluded from analysis. Fisher’s Exact test was used for statistical analysis. f Immunoblot of the RON signalling pathway in WHIM20 primary tumours with indicated treatment. Each lane represents an individual primary tumour from the indicated treatment group. Five tumours per group were analysed by immunoblot. P < 0.05 was considered statistically significant for all tests. (*p < 0.05, **p < 0.01, ***p < 0.001).

Similar articles

Cited by

References

    1. (WHO) IAfRoCIaWHO. GLOBOCAN 2018: Breast 2019. http://gco.iarc.fr/today/data/factsheets/cancers/20-Breast-fact-sheet.pdf. (2018)
    1. Early Breast Cancer Trialists’ Collaborative G. Effects of chemotherapy and hormonal therapy for early breast cancer on recurrence and 15-year survival: an overview of the randomised trials. Lancet. 365, 1687–1717 (2005). - PubMed
    1. Schiavon G, Hrebien S, Garcia-Murillas I, Cutts RJ, Pearson A, Tarazona N, et al. Analysis of ESR1 mutation in circulating tumor DNA demonstrates evolution during therapy for metastatic breast cancer. Sci. Transl. Med. 2015;7:313ra182. - PMC - PubMed
    1. Toy W, Shen Y, Won H, Green B, Sakr RA, Will M, et al. ESR1 ligand-binding domain mutations in hormone-resistant breast cancer. Nat. Genet. 2013;45:1439–1445. - PMC - PubMed
    1. Zhang QX, Borg A, Wolf DM, Oesterreich S, Fuqua SA. An estrogen receptor mutant with strong hormone-independent activity from a metastatic breast cancer. Cancer Res. 1997;57:1244–1249. - PubMed

Publication types