. 2020 Dec;2(12):1401-1412.
doi: 10.1038/s42255-020-00316-0. Epub 2020 Nov 30.

The hexosamine biosynthesis pathway is a targetable liability in KRAS/LKB1 mutant lung cancer

Affiliations

The hexosamine biosynthesis pathway is a targetable liability in KRAS/LKB1 mutant lung cancer

Jiyeon Kim et al. Nat Metab. 2020 Dec.

Abstract

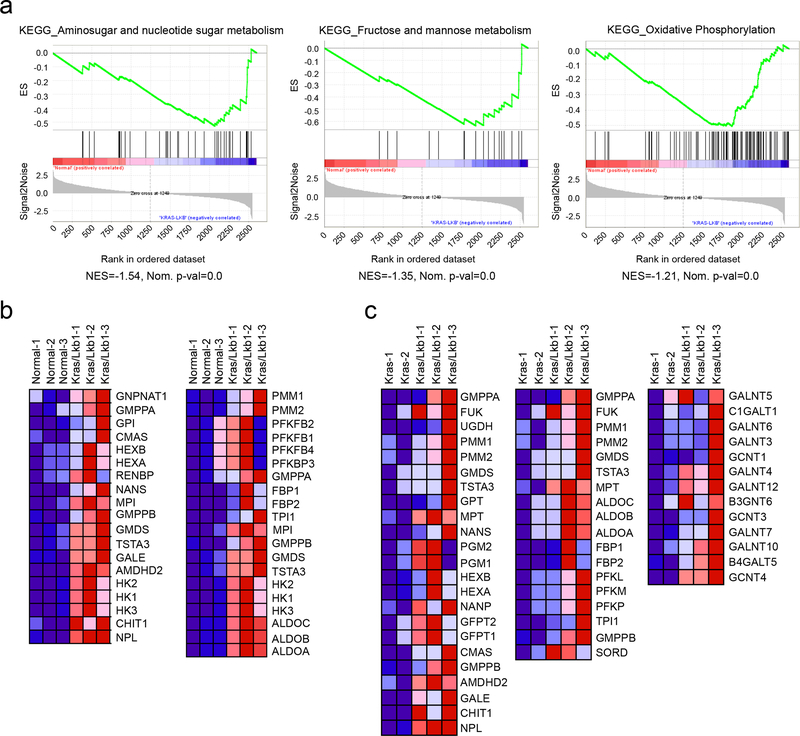
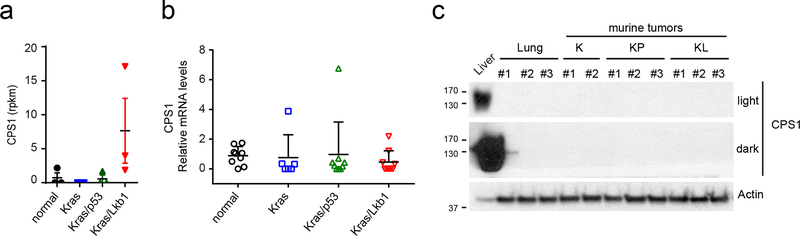
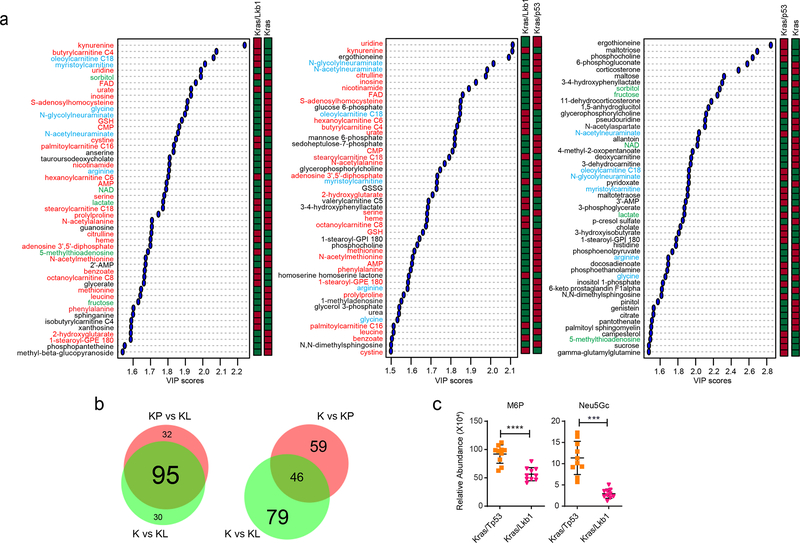
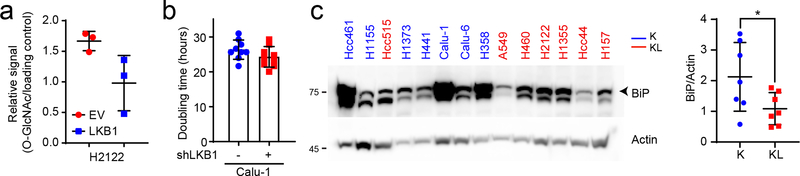
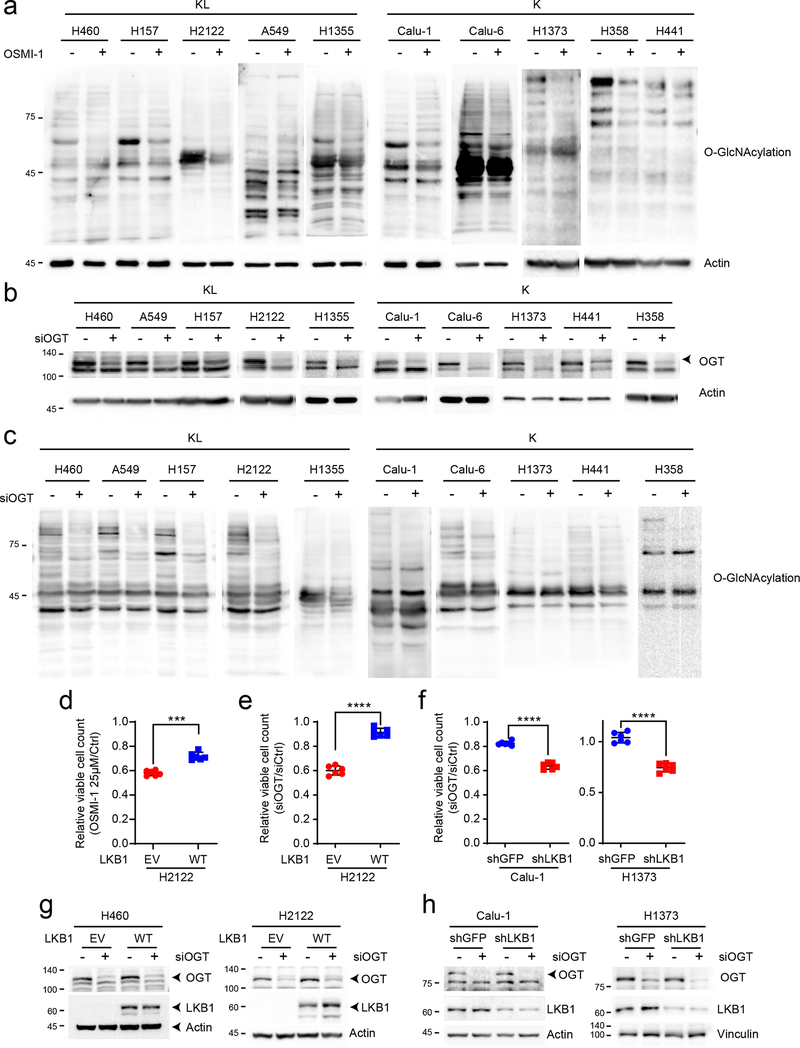
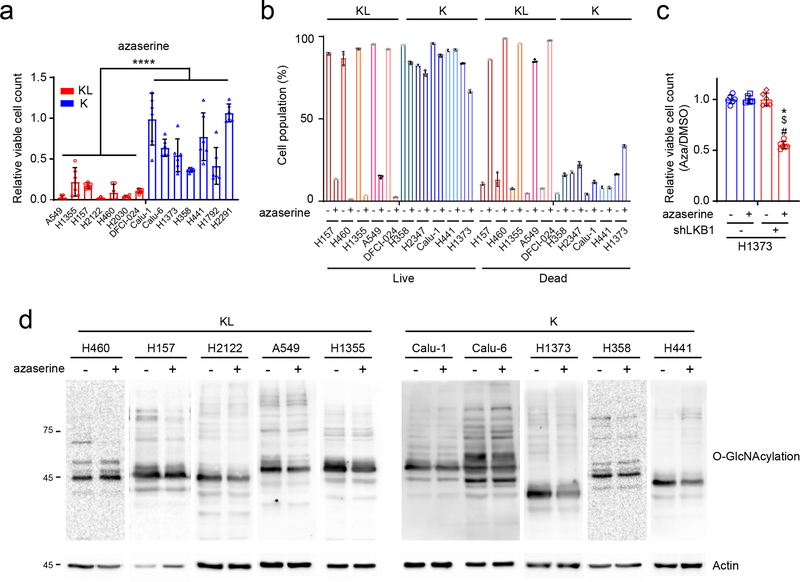
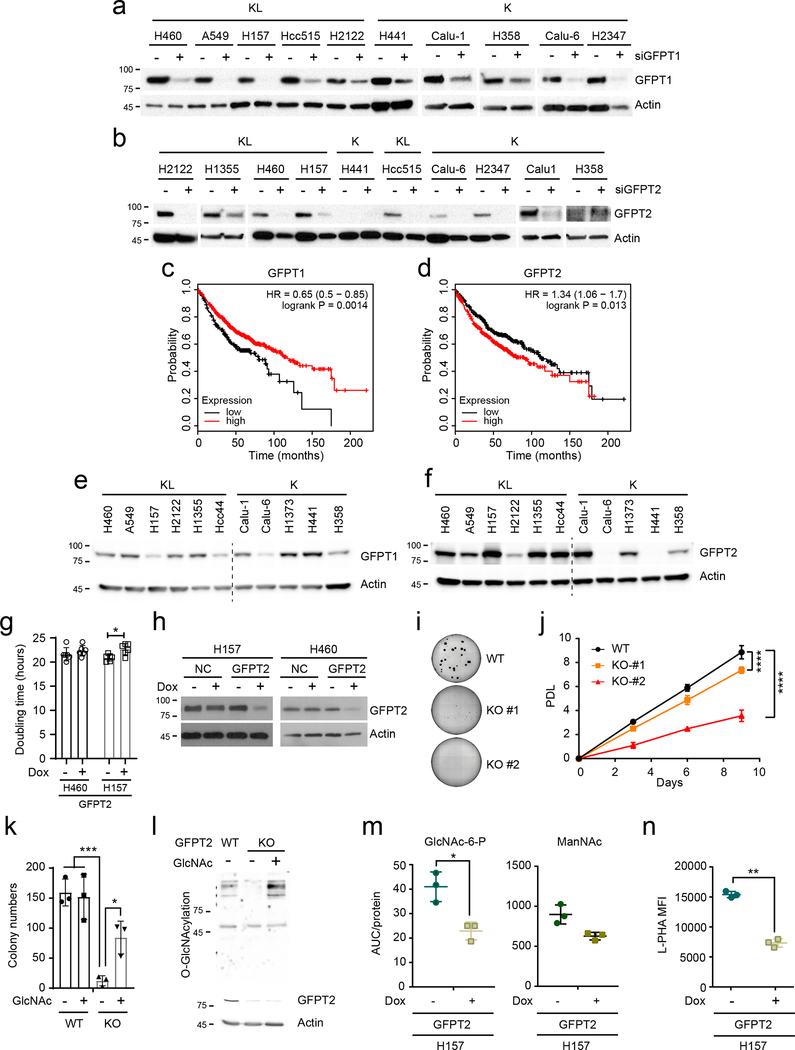
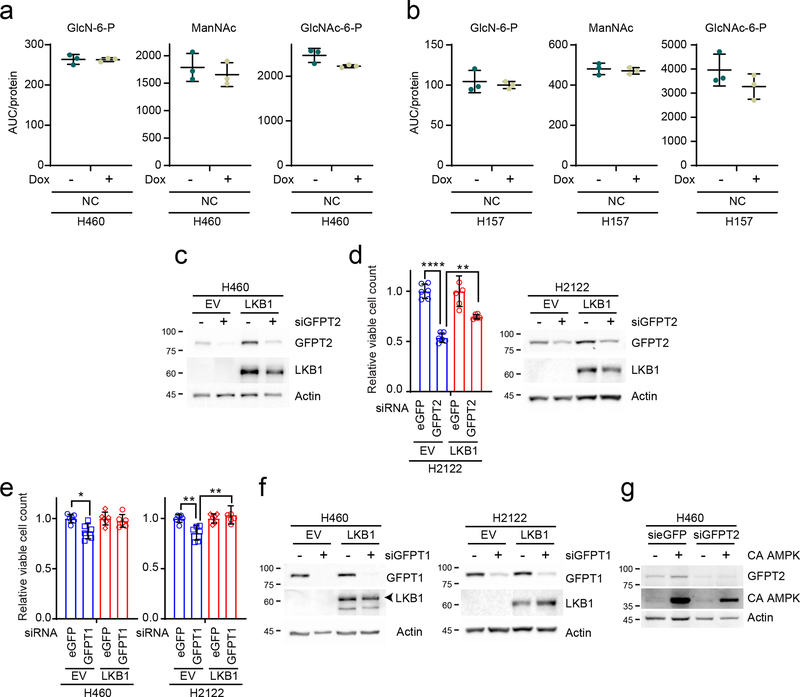
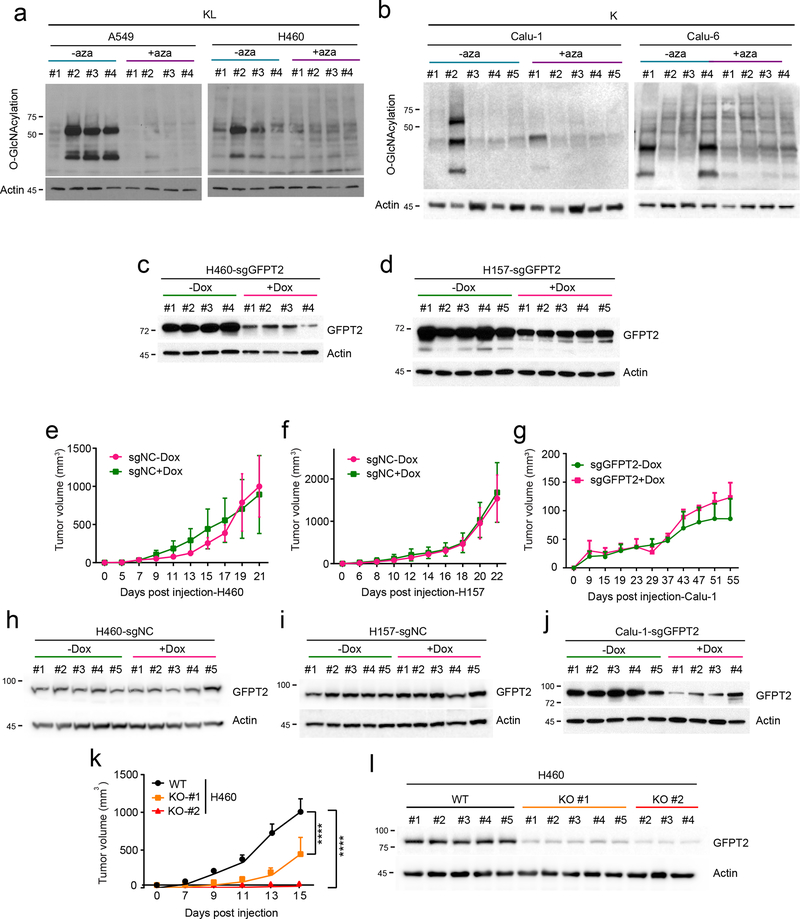
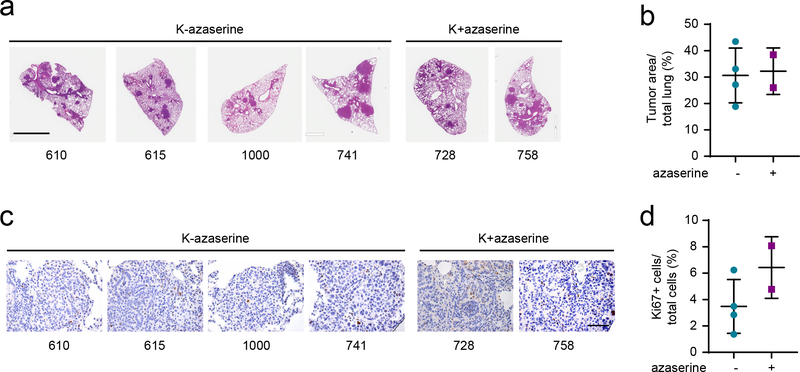
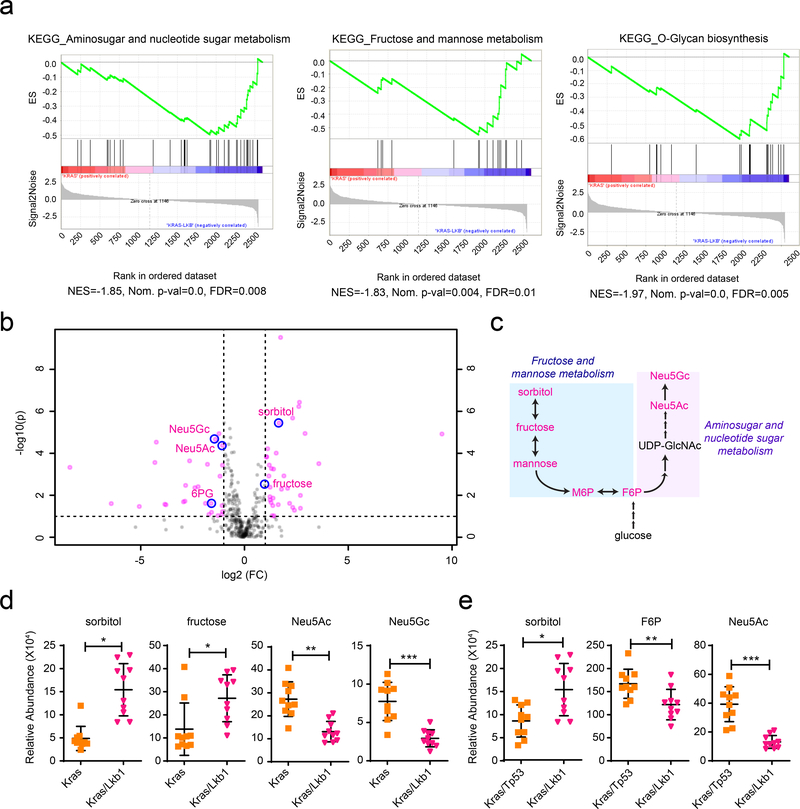
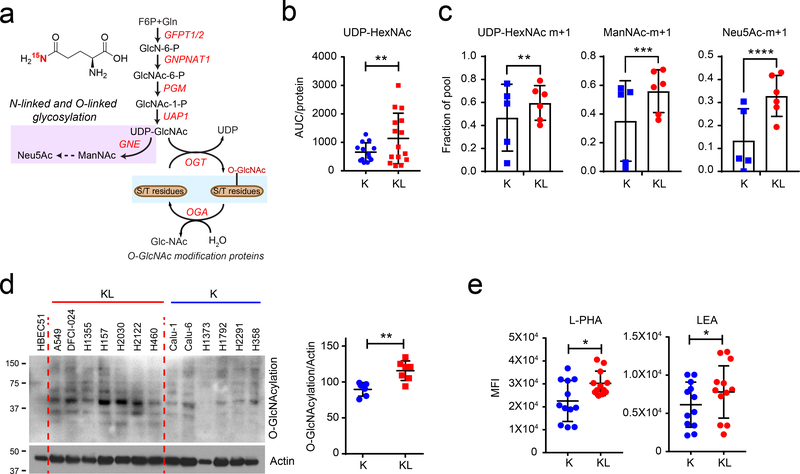
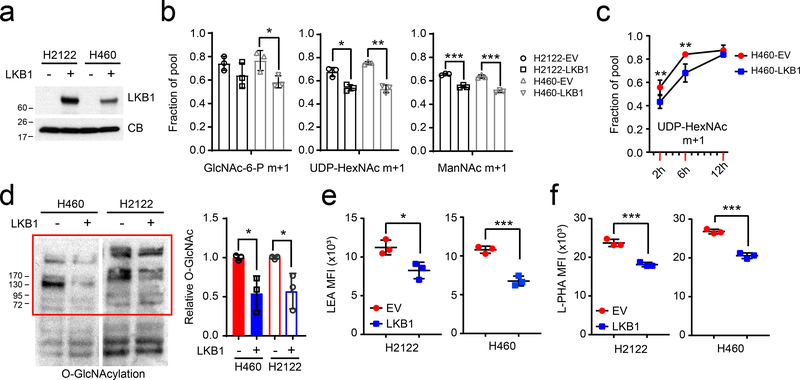
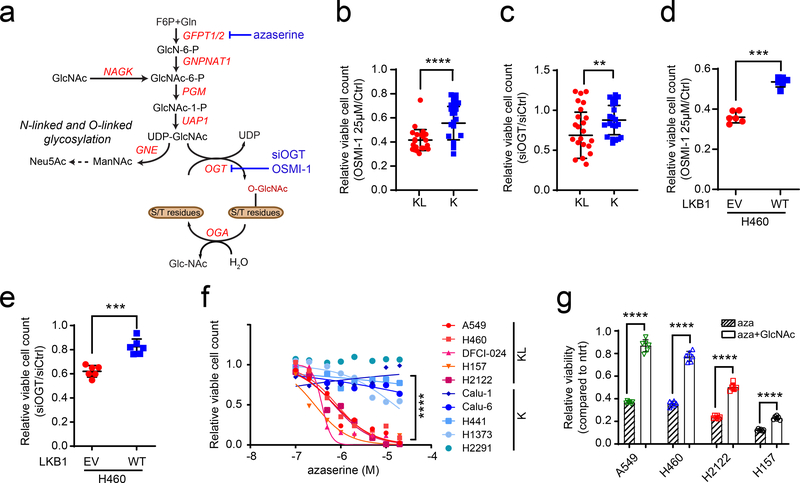
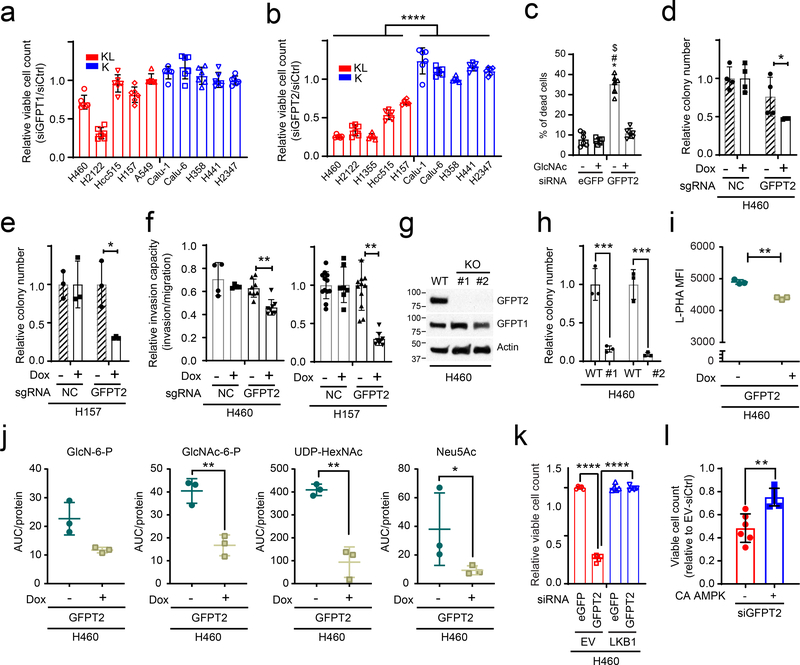
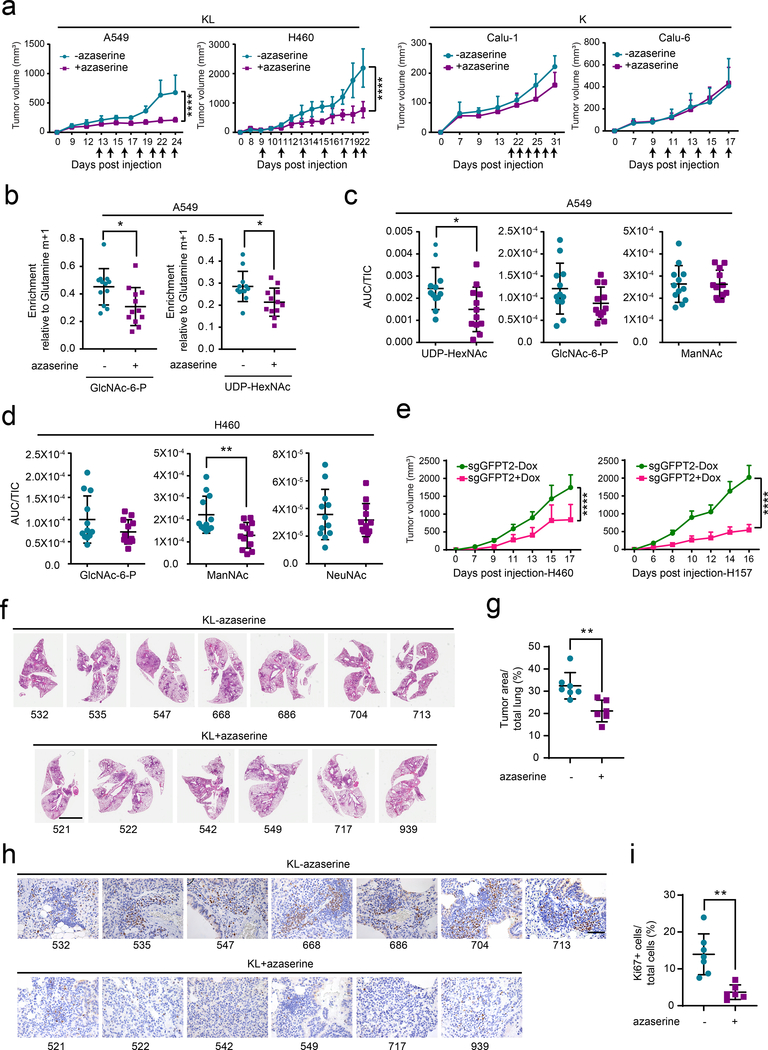
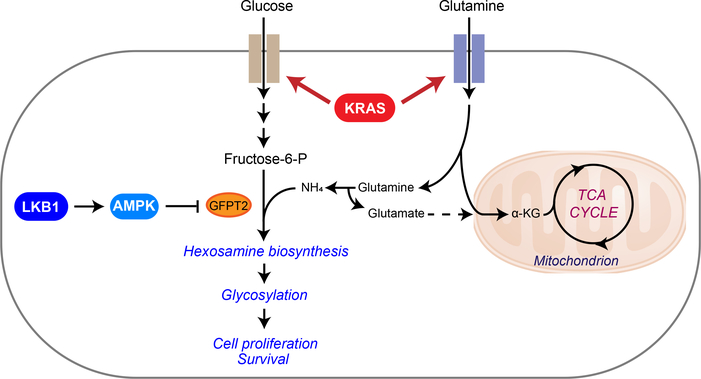
In non-small-cell lung cancer (NSCLC), concurrent mutations in the oncogene KRAS and the tumour suppressor STK11 (also known as LKB1) encoding the kinase LKB1 result in aggressive tumours prone to metastasis but with liabilities arising from reprogrammed metabolism. We previously demonstrated perturbed nitrogen metabolism and addiction to an unconventional pathway of pyrimidine synthesis in KRAS/LKB1 co-mutant cancer cells. To gain broader insight into metabolic reprogramming in NSCLC, we analysed tumour metabolomes in a series of genetically engineered mouse models with oncogenic KRAS combined with mutations in LKB1 or p53. Metabolomics and gene expression profiling pointed towards activation of the hexosamine biosynthesis pathway (HBP), another nitrogen-related metabolic pathway, in both mouse and human KRAS/LKB1 co-mutant tumours. KRAS/LKB1 co-mutant cells contain high levels of HBP metabolites, higher flux through the HBP pathway and elevated dependence on the HBP enzyme glutamine-fructose-6-phosphate transaminase [isomerizing] 2 (GFPT2). GFPT2 inhibition selectively reduced KRAS/LKB1 co-mutant tumour cell growth in culture, xenografts and genetically modified mice. Our results define a new metabolic vulnerability in KRAS/LKB1 co-mutant tumours and provide a rationale for targeting GFPT2 in this aggressive NSCLC subtype.


Conflict of interest statement

Competing interests

R.J.D. is an advisor for Agios Pharmaceuticals. J.D.M. receives cell line licensing royalties from the NIH and UTSW. The other authors declare no competing interests.

Figures

Extended Data Fig. 1
Extended Data Fig. 1. Hexosamine-related metabolic pathways are associated with KL mouse tumors.
a, GSEA between KL tumors and adjacent lungs returned “Amino sugar and nucleotide metabolism”, “Fructose and mannose metabolism”, and “Oxidative Phosphorylation” as the top ranked metabolic gene ontology terms from KEGG database. Enrichment statistics include nominal p value and nominal enrichment score (NES). b, The leading-edge genes of “Amino sugar and nucleotide sugar metabolism” (left) and “Fructose and mannose metabolism” (right) are in Extended Data Fig. 3a. The leading-edge genes of “Oxidative Phosphorylation” (not displayed here) are in Supplementary Table 3. c, The leading-edge genes of “Amino sugar and nucleotide sugar metabolism”, “Fructose and mannose metabolism” and “O-Glycan biosynthesis” in Fig. 1a.
Extended Data Fig. 2
Extended Data Fig. 2. Mouse KL tumors do not display CPS1 induction.
a, RNAseq result for CPS1 in mouse lung and mouse tumors of the indicated genotypes. Data are the average and SD of tissues from three independent mice except Kras mice (n=2). b, CPS1 expression in the tissues used in Extended Data Fig. 2a. q-rt-PCR Data are the average and SD of three fragments from three independent mice except Kras mice (three fragments from two mice). c, CPS1 protein expression in the tissues used in Extended Data Fig. 2b. Statistical significance was assessed using one-way ANOVA followed by Tukey’s post hoc test was used and there was no statistical significance among the groups.
Extended Data Fig. 3
Extended Data Fig. 3. Lkb1, but not p53, mutation significantly alters metabolism of Kras mutant mouse lung tumor.
a, Key metabolites differentiating between Kras (K) and Kras/Lkb1 (KL) tumors (left), Kras/Lkb1 (KL) and Kras/p53 (KP) tumors (middle) and Kras (K) and Kras/p53 (KP) tumors (right) (VIP>~ 1.5). Metabolites shown in all three groups are in light blue whereas ones only shown in the first and second group are in red and ones only shown in the first and third group are in green. Relative metabolite abundance is indicated in the bar, with red representing metabolite accumulation. b, Venn diagrams of Variable Importance in the Projection metabolites (VIP>1.0) between [K and KL tumor tissues] and [KP and KL tumor tissues] (left) and between [K and KP tumor tissues] and [K and KL tumor tissues]. c, Abundance of M6P and N-glycolylneuraminic acid (Neu5GC) from the metabolomics in Extended Data Fig. 3a. Individual data points are shown with mean values and SD for ten (KP) or ten (KL) mouse tumors. M6P, mannose-6-phosphate; Neu5Gc, N-glycolylneuraminic acid. Statistical significance was assessed using Wilcoxon signed rank test. *p<0.05; **p<0.01.
Extended Data Fig. 4
Extended Data Fig. 4. KL cells show lower basal levels of UPR-ER stress than K cells.
a, Relative intensity of O-GlcNAcylation to loading control in H2122 cells; O-GlcNAcylation signal was derived from the bracketed region of the blot in Fig. 3d. b, Doubling time of LKB1-proficient and -deficient Calu-1 cells (n=9). c, Left, Abundance of BiP protein in K and KL cell lines. Actin is used as a loading control. Right, Relative intensity of BiP to loading control in K and KL cells. Statistical significance was assessed using two sample unequal variance Student’s t-tests. *p<0.05. Cell counting for doubling time calculation was performed more than three times and Western blot was repeated twice.
Extended Data Fig. 5
Extended Data Fig. 5. KL cells are sensitive to inhibition of the HBP.
a, Effect of OSMI-1 treatment on global O-GlcNAcylation of K and KL cells. b, Abundance of OGT protein in K and KL cell lines transfected with a control siRNA or siRNA directed against OGT. Actin is used as a loading control. c, Effect of OGT silencing on global O-GlcNAcylation of K and KL cells. d, Relative viability of EV and LKB1-WT expressing H2122 cells following a 72hr exposure to OSMI-1 (25μM). e, Relative viability of EV and LKB1-WT expressing H2122 cells to OGT silencing for 96hr. f, Relative viability of shGFP and shLKB1-expressing Calu-1 (Left) and H1373 (Right) cells to OGT silencing for 96hr. g and h, Abundance of OGT protein in EV and LKB1 expressing KL cells (H460 and H2122) (g) and shGFP and shLKB1 expressing K cells (Calu-1 and H1373) (h) transfected with a control siRNA or siRNA directed against OGT. Actin is used as a loading control except H1373 (Vinculin is used as a loading control). Statistical significance was assessed using two-tailed Student’s t-tests. ***p<0.001; ****p<0.0001. Cell viability assays were repeated twice, and all Western blots were repeated three times or more.
Extended Data Fig. 6
Extended Data Fig. 6. KL cells are sensitive to inhibition of GFPT activity.
a, Effect of azaserine treatment (1μM) on K and KL cells’ viability (14 cell lines, n=6). Data are the average and SD of six independent cultures. b, Effect of azaserine treatment on cell death in K and KL cells (n=3). c, Relative viability of shGFP and shLKB1-expressing H1373 following a 72hr exposure to azaserine (1μM). d, Effect of azaserine treatment on global O-GlcNAcylation of K and KL cells. Actin is used as a loading control. Statistical significance was assessed using Student’s t-tests (a) and one-way ANOVA followed by Tukey’s multiple comparisons test (c). In c, *, p<0.05 comparing to shGFP without azaserine treatment; $, p<0.05 comparing to shGFP with azaserine treatment; #, p<0.05 comparing to shLKB1 without azaserine treatment. ****, p<0.0001. Cell viability assay and Western blots were repeated at least twice. FACS analysis was performed once.
Extended Data Fig. 7
Extended Data Fig. 7. KL cells are sensitive to inhibition of GFPT2.
a, Abundance of GFPT1 protein in cell lines transfected with a control esiRNA or esiRNA directed against GFPT1. Actin is used as a loading control. b, Abundance of GFPT2 protein in cell lines transfected with a control esiRNA or esiRNA directed against GFPT2. Actin is used as a loading control. c, Kaplan−Meier plot associating GFPT1 mRNA expression with survival. Dataset is from KM Plotter (http://kmplot.com/analysis/index.php?p=service&cancer=lung). d, Kaplan−Meier plot associating GFPT2 mRNA expression with survival. e, Abundance of GFPT1 in a panel of K and KL cells. Actin is used as a loading control. f, Abundance of GFPT2 in a panel of K and KL cells. Actin is used as a loading control. g, Effect of Dox-induced GFPT2 deletion on growth in a monolayer culture. Data are the average and SD of 6 replicates. h, Abundance of GFPT2 in Dox-inducible GFPT2 KO H157 (left) and H460 (right) cells with or without Dox induction. Actin is used as a loading control. i, Representative images of colonies grown in soft agar in Fig. 5g. j, Effects of a GFPT2 KO on cell proliferation (H460 cells, n = 5). k, Effect of GlcNAc on anchorage-independent growth of GFPT2 KO cells. l, Global O-GlcNAcylation of GFPT2 WT, KO and KO treated with GlcNAc. m, Abundance of GlcNAc-6-P and ManNAc in Dox-inducible GFPT2 KO H157 cells (n=3). n, Effect of Dox-inducible GFPT2 KO H157 cells on cell surface L-PHA lectin binding. Statistical significance in g, j, m, and n was assessed using two-tailed Student’s t-tests. In j, to calculate significance on repeated measurements over time, a two-way ANOVA with Tukey’s post hoc test was used. In k, statistical significance was assessed using one-way ANOVA with Tukey post hoc test. *p<0.05, **p<0.01, ***p<0.001, ****p<0.0001. Targeted metabolomics was performed once. Soft agar assay, monolayer cell growth, GFPT1 and 2, and O-GlcNAcylation western blotting were assayed twice. All other experiments were repeated three times or more.
Extended Data Fig. 8
Extended Data Fig. 8. KL cells are sensitive to inhibition of GFPT2 (cont.).
a and b, Abundance of GlcNAc-6-P, ManNAc and GlcNAc-6-P in Dox-inducible NC KO H460 (a) and H157 (b) cells (n=3). c, Abundance of GFPT2 protein in EV and LKB1-expressing H460 transfected with a control esiRNA or esiRNA directed against GFPT2. Actin is used as a loading control. d, Left, Relative viability of EV and LKB1-expressing H2122 cells after GFPT2 silencing for 96hr. Right, Abundance of GFPT2 protein in EV and LKB1-expressing H2122 cells transfected with a control esiRNA or esiRNA directed against GFPT2. Actin is used as a loading control. e, Relative viability of EV and LKB1-expressing H460 (Left) and H2122 (Right) cells after GFPT1 silencing for 96hr. f, Abundance of GFPT1 protein in EV and LKB1-expressing H2122 cells transfected with a control esiRNA or esiRNA directed against GFPT1. Actin is used as a loading control. g, Abundance of GFPT2 protein in EV and constitutively active AMPK (CA AMPK)-expressing H460 cells transfected with a control esiRNA or esiRNA directed against GFPT2. Actin is used as a loading control.
Extended Data Fig. 9
Extended Data Fig. 9. GFPT2 suppression inhibits KL tumor growth.
a, Global O-GlcNAcylation in A549 (left) and H460 (right) xenografts in presence and absence of azaserine. Actin was used as a loading control. b, Global O-GlcNAcylation in Calu-1 (left) and Calu-6 (right) xenografts in presence and absence of azaserine. Actin was used as a loading control. c and d, Abundance of GFPT2 protein in Dox-inducible GFPT2 KO H460 (c) and H157 (d) xenografts with or without Dox induction. Actin was used as a loading control. e and f, Growth of Dox-inducible NC KO H460 (e) and H157 (f) xenografts in presence and absence of Dox. Mean tumor volume and SEM are shown for each group (n=5 per group). g, Growth of Dox-inducible GFPT2 KO Calu-1 xenografts in presence and absence of Dox. Mean tumor volume and SEM are shown for each group (n=5 for GFPT2-Dox, n=4 for GFPT2+Dox). h and i, Abundance of GFPT2 protein in Dox-inducible NC KO H460 (h) and H157 (i) xenografts with or without Dox induction. Actin was used as a loading control. j, Abundance of GFPT2 protein in Dox-inducible GFPT2 KO Calu-1 xenografts with or without Dox induction. Actin was used as a loading control. k, Growth of H460 WT or GFPT2 KO (two different clones) xenografts. Mean tumor volume and SEM are shown for each group (n=5 per group).l, Abundance of GFPT2 protein in GFPT2 WT and KO (two independent clones) H460 xenografts with or without Dox induction. Note that only three mice bearing KO #2 cells developed tumors. Actin was used as a loading control. Statistical significance in f and g was assessed using two-way ANOVA followed by Sidak’s multiple comparisons test. In e and k, statistical significance was assessed using two-way ANOVA with Tukey’s multiple comparisons test. Mouse experiments were performed once. Western blots were repeated twice.
Extended Data Fig. 10
Extended Data Fig. 10. Azaserine treatment reduces KL tumor burden and proliferation.
a, Tumor area in K tumors with or without azaserine treatment was quantified with ImageJ and % of tumor burden out of total lung was analyzed. Scale bar, 3mm. b, Tumor area from Extended Data Fig. 10a was quantified with ImageJ and % of tumor burden out of total lung was analyzed. c, Representative Ki67 staining images of the same mouse tissues used in Extended Data Fig. 10a. Scale bar, 100μm. d, Ki67 positive cells and total cells within the area were quantified using ClickMaster2000. Three images per tissue were used for quantification. Statistical significance was assessed using two-tailed Student’s t-tests.
Figure 1.
Figure 1.. Altered hexosamine metabolism in KL mouse tumors.
a, Enriched KEGG pathways were identified using GSEA against C2 pathways of the MSig database in the KL mouse tumors compared with K tumors. The top three enriched pathways from the analysis are displayed. Their leading-edge genes are shown in Extended Data Fig. 1c and the complete list (FDR q-val <0.05) is available in Supplementary Tables 2. b, Volcano plot showing metabolites whose levels are significantly changed in KL tumors compared with K tumors (pink dots). Intermediary metabolites in fructose and mannose metabolism and amino sugar/nucleotide sugar metabolism are circled in blue. Neu5Gc, N-glycolylneuraminic acid; Neu5Ac, N-acetylneuraminic acid; F6P, fructose-6-phosphate. c, Schematic of the connection between metabolites in fructose and mannose metabolism and amino sugar/nucleotide sugar metabolism. Metabolites shown in Fig 1b,d,e and Extended Data Fig. 3c are in pink. d, Abundance of metabolites in amino sugar/nucleotide sugar metabolism and fructose and mannose metabolism in K and KL tumor tissues. Individual data points are shown with mean values and SD for ten K and ten KL tissues. e, Abundance of metabolites in amino sugar/nucleotide sugar metabolism and fructose and mannose metabolism in KP and KL tumor tissues. Individual data points are shown with mean values and SD for ten KP and ten KL tissues. Statistical significance was assessed using two-tailed Student’s t-test (d) and (e). **p<0.01; ****p<0.0001. Metabolomics was performed once.
Figure 2.
Figure 2.. The hexosamine biosynthesis pathway is upregulated in KL cells.
a, Schematic of the hexosamine biosynthesis pathway (HBP). Metabolites in the glycosylation pathway are in lilac and O-GlcNAcylation is in light blue. Schematic of 15N incorporation from [γ−15N]glutamine into the HBP intermediates is shown in Supplementary Data Fig. 1a. b, Abundance of UDP-HexNAc in K and KL cell lines. AUC= area under the curve. Individual data points represent replicates from each cell line and are shown with mean values and SD for five K and KL cell lines. Three replicates were analyzed for each cell line, except for H441 and H358, for which two replicates were analyzed. c, 15N labeling in UDP-HexNAc, ManNAc, and Neu5Ac in K and KL cells cultured with [γ−15N]glutamine containing media for 6 hours. Individual data points represent the average value of each cell line (3 replicates/cell line). d, Left, Global O-GlcNAcylation in K and KL cells. Human bronchial epithelial cell line HBEC51 is used as control. Right, Quantification of O-GlcNAcylation normalized by actin levels. e, Cell surface L-PHA and LEA lectin binding in K and KL cells was measured by flow cytometry. Statistical significance was assessed using two-tailed Student’s t-test (b), (c), (d), and (e). In c, statistical analysis was done with individual replicate of each cell lines (n=3/each cell line). *p<0.05; **p<0.01; ***p < 0.001; ****p<0.0001. In targeted metabolomics, single time point stable isotope labeling for ManNAc and Neu5Ac was performed once, and single time point stable isotope labeling for UDP-HexNAc was performed twice. Western blots were repeated three times or more. FACS analyses were performed twice.
Figure 3.
Figure 3.. LKB1 regulates the hexosamine biosynthesis pathway.
a, LKB1 re-expression in H460 and H2122, two KL cells. Cyclophilin B (CB) is used as loading control. b, 15N labeling in GlcNAc-6-P, UDP-HexNAc and ManNAc in empty vector (EV) control and wildtype LKB1 (LKB1) expressing H460 and H2122 cells cultured with [γ−15N]glutamine. c, Time-course of 15N labeling in UDP-HexNAc in EV and LKB1 expressing H460 cells cultured with [γ−15N]glutamine. d, Left, Global O-GlcNAcylation in EV and LKB1 expressing H460 and H2122 cells. Right, Relative intensity of O-GlcNAcylation (in red bracket) to a loading control (cyclophilin B, CB). e, Cell surface LEA lectin binding in EV and LKB1-expressing H460 and H2122 cells was measured by flow cytometry. f, Cell surface L-PHA lectin binding in EV and LKB1 expressing H460 and H2122 cells was measured by flow cytometry. Data in b and c are the average and SD of three independent cultures. In b,e,f, statistical significance was assessed using two-tailed Student’s t-test. In c, to calculate significance on repeated measurements over time, two-way ANOVA was used. Stable isotope experiments and O-GlcNAcylation western blotting were repeated twice. All other experiments were repeated three times or more. *p<0.05;**p<0.01; ***p<0.001.
Figure 4.
Figure 4.. KL cells are dependent on the rate limiting step of the hexosamine biosynthesis pathway.
a, Schematic of the hexosamine biosynthesis pathway. Enzyme/pathway targeted by each inhibitor and siRNA is shown. b, Relative viability of a panel of K and KL lines following a 72hr exposure to OSMI-1 (25μM). c, Relative viability of K and KL lines to OGT silencing for 96hr. d, Relative viability of EV and LKB1-WT expressing H460 cells following a 72hr exposure to OSMI-1 (25μM). e, Relative viability of EV and LKB1-WT expressing H460 cells to OGT silencing for 96hr. f, Dose-response curves for K and KL lines following 72hr exposure to azaserine. g, Effect of GlcNAc (40mM) on azaserine (0.5μM)-treated KL cells (four cell lines, n=6/line). Data are average and SD of three or more independent cultures. Statistical significance was assessed using unpaired t-test with Welch’s correction (b,c), two-tailed Student’s t-tests (d,e and g) Mann-Whitney U test (f); **p<0.01; ***p<0.001; ****p<0.0001. Cell viability assay of OSMI-1 with a panel of NSCLC cell lines and dose-response assay were performed three times or more. Cell viability assay of OSMI-1 with H460-EV and WT, OGT silencing assay and viability assay with azaserine treatment in the presence or absence of GlcNAc were repeated twice.
Figure 5.
Figure 5.. KL cells require GFPT2.
a and b, Sensitivity to GFPT1 (a) and GFPT2 (b) silencing in K and KL cells (n = 6). c, Rescue effect of GlcNAc supplementation on GFPT2 silencing-induced cell death (n=6). d and e, Effects of a Dox-induced GFPT2 sgRNA (GFPT2) on anchorage independent growth of H460 (d) and H157 (e) (n=4 for H460, n = 3 for H157). NC is a Dox-inducible control sgRNA. f, Effects of Dox-induced GFPT2 KO on invasion capacity of H460 and H157 cells (n=4 for H460-sgNC−/+ Dox, n=8 for H460-sgGFPT2−/+Dox, n=12 for H157 GFPT2-Dox and H157-NC-Dox, n=8 for H157 GFPT2+Dox, n=7 for H157-NC+Dox). g, Abundance of GFPT1 and 2 in parental and GFPT2 KO H460 cells. Actin was used as a loading control. h, Effects of GFPT2 KO (two clones) on anchorage independent growth of H460. i, Effect of Dox-inducible GFPT2 KO H460 cells on cell surface L-PHA lectin binding. j, Abundance of hexosamine metabolites in Dox-inducible GFPT2 KO H460 cells (n=3). sgNC is used as a Dox-inducible sgRNA control. k, Effect of LKB1 on GFPT2 silencing-induced loss of viability (n=5). l, Effect of constitutively active AMPK (CA AMPK) on GFPT2 silencing-induced loss of viability (n=6).In b, d, e, f, h, i, j, and l, statistical significance was assessed using two-tailed Student’s t-test. In c and k, statistical significance was assessed using one-way ANOVA followed by Tukey’s post hoc test was used. In c, *, p<0.05 comparing to sieGFP without GlcNAc; #, p<0.05 comparing to sieGFP with GlcNAc treatment; $, p<0.05 comparing to siGFPT2 with GlcNAc treatment. *p<0.05; **p<0.01; ***p<0.001; ****p<0.0001. Western blot was repeated three times and all other experiments were performed twice.
Figure 6.
Figure 6.. GFPT2 suppression inhibits KL tumor growth.
a, Left, Growth of A549 (left) and H460 (right) xenografts in presence and absence of azaserine (2.5mg/kg, qod for 6–7 times total, arrows indicate when azaserine was injected). Right, growth of Calu-1 (left) and Calu-6 (right) xenograft in presence and absence of azaserine. Mean tumor volume and SD are shown for each group (n=4 for A549, n=4 for H460, n=5 for both Calu-1 and Calu-6. Combined results from two independent H460 xenograft experiments (total n=8) are shown here). b, 15N labeling in GlcNAc-6-P and UDP-HexNAc in mice bearing A549 treated (purple) or non-treated (turquoise) with azaserine. c and d, Abundance of hexosamine metabolites in A549 (c) and H460 (d) xenografts in Fig. 6a. AUC/TIC=Area under the curve/total ion count. Individual data points are shown with mean values and SD for 12 sections (three fragments per tumor). e, Growth of Dox-inducible GFPT2 KO H460 (left) and H157 (right) xenografts in presence and absence of Dox. Mean tumor volume and SEM are shown for each group (n=5 per group). f, Full scan lung tissue images of non-treated KL mice (upper panel, total 7 mice) and azaserine treated mice (lower panel, total 6 mice). Scale bar, 4mm. g, Tumor area from Fig. 6f was quantified with ImageJ and % of tumor burden out of total lung was analyzed. h, Representative Ki67 staining images of the same mouse tissues used in Fig. 6f. Scale bar, 100μm. i, Ki67 positive cells and total cells within the area were quantified using ClickMaster2000. Three images per tissue were used for quantification. Statistical significance was assessed using two-tailed Student’s t-tests (b, c, d, g and i); two-way ANOVA with Sidak’s multiple comparisons test (a,e);. *p<0.05; **p<0.01; ****p<0.0001. Tumor growth studies in f and h, in vivo infusion in b, and targeted metabolomics in c and d were performed once. Tumor growth study in a and d were repeated twice.
Figure 7.
Figure 7.. Illustration of the HBP and tricarboxylic acid (TCA) cycle.
Metabolic alterations mediated by concurrent mutations of KRAS and LKB1 render cells dependent on GFPT2 for hexosamine synthesis. Uptake of glucose and glutamine is elevated by mutant KRAS, establishing the environment favoring hexosamine synthesis. LKB1 loss in the context of KRAS mutation, which leads to loss of AMPK activation, then enhances HBP through GFPT2. Increased GFPT2 activity may also contribute to the glutamate pool for anaplerosis in the mitochondria. α KG, α -ketoglutaric acid.

Similar articles

Cited by

References

    1. Ji H et al. LKB1 modulates lung cancer differentiation and metastasis. Nature 448, 807–810, doi:10.1038/nature06030 (2007). - DOI - PubMed
    1. Calles A et al. Immunohistochemical Loss of LKB1 Is a Biomarker for More Aggressive Biology in KRAS-Mutant Lung Adenocarcinoma. Clinical cancer research : an official journal of the American Association for Cancer Research 21, 2851–2860, doi:10.1158/1078-0432.Ccr-14-3112 (2015). - DOI - PubMed
    1. Skoulidis F & Heymach JV Co-occurring genomic alterations in non-small-cell lung cancer biology and therapy. Nature reviews. Cancer 19, 495–509, doi:10.1038/s41568-019-0179-8 (2019). - DOI - PMC - PubMed
    1. Skoulidis F et al. STK11/LKB1 Mutations and PD-1 Inhibitor Resistance in KRAS-Mutant Lung Adenocarcinoma. Cancer discovery 8, 822–835, doi:10.1158/2159-8290.Cd-18-0099 (2018). - DOI - PMC - PubMed
    1. Racker E, Resnick RJ & Feldman R Glycolysis and methylaminoisobutyrate uptake in rat-1 cells transfected with ras or myc oncogenes. Proceedings of the National Academy of Sciences of the United States of America 82, 3535–3538, doi:10.1073/pnas.82.11.3535 (1985). - DOI - PMC - PubMed

Publication types

MeSH terms