. 2021 Apr;39(4):510-519.
doi: 10.1038/s41587-020-0742-6. Epub 2020 Nov 30.

A comprehensive library of human transcription factors for cell fate engineering

Affiliations

A comprehensive library of human transcription factors for cell fate engineering

Alex H M Ng et al. Nat Biotechnol. 2021 Apr.

Abstract

Human pluripotent stem cells (hPSCs) offer an unprecedented opportunity to model diverse cell types and tissues. To enable systematic exploration of the programming landscape mediated by transcription factors (TFs), we present the Human TFome, a comprehensive library containing 1,564 TF genes and 1,732 TF splice isoforms. By screening the library in three hPSC lines, we discovered 290 TFs, including 241 that were previously unreported, that induce differentiation in 4 days without alteration of external soluble or biomechanical cues. We used four of the hits to program hPSCs into neurons, fibroblasts, oligodendrocytes and vascular endothelial-like cells that have molecular and functional similarity to primary cells. Our cell-autonomous approach enabled parallel programming of hPSCs into multiple cell types simultaneously. We also demonstrated orthogonal programming by including oligodendrocyte-inducible hPSCs with unmodified hPSCs to generate cerebral organoids, which expedited in situ myelination. Large-scale combinatorial screening of the Human TFome will complement other strategies for cell engineering based on developmental biology and computational systems biology.


Conflict of interest statement

Competing interests.

A.H.M.N., P.K., V.B., and G.M.C. are inventors on patents filed by the Presidents and Fellows of Harvard College. Full disclosure of G.M.C. is available on http://arep.med.harvard.edu/gmc/tech.html. A.H.M.N., P.K. and G.M.C. are co-founders and have equity in GC Therapeutics, Inc. No reagents or funding from GC Therapeutics, Inc. was used in this study.

Figures

Figure 1
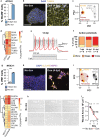
Figure 1. Creation of the Human TFome expression library and its application for cell fate engineering.
(a) Schematic of Human TFome screening for stem cell differentiation. MOI, multiplicity of infection = 0.1 ensures single TF integration per cell. FACS, fluorescence-activated cell sorting. NGS, next-generation sequencing. (b) The Human TFome screen identifies previously unreported individual TFs that induce differentiation in multiple hiPSC lines. Pie chart shows the number of differentiation-inducing TF hits in 0, 1, 2 or 3 hiPSC lines. Donut charts show the number of TF hits previously known or not known to drive differentiation upon induction. (c) Higher differentiation efficiency in PiggyBac-mediated versus lentiviral-mediated TF induction. Flow cytometry for differentiated cells based on loss of pluripotency markers at 4 dpi using NEUROG1 as a canonical differentiation-inducing TF. mean±s.e.m., n = 3 biologically independent samples per group, two-sided Student’s t-test. (d) Validation of top TF hits in individual cell lines at 4 dpi. Percentage of differentiation was calculated by loss of pluripotency markers using flow cytometry. mean±s.e.m., n = 3 biologically independent samples per group, two-sided Student’s t-test. * P < 0.05. ** P < 0.01. *** P < 0.001. Exact P-values are provided in Supplementary Table 7.
Figure 2
Figure 2. ATOH1 induces neurons and NKX3-1 induces fibroblasts in lineage-independent media.
(a) ATOH1 drives hiPSCs into 99±1% NCAM + neurons at 4 dpi. Bar plot of flow cytometry for NCAM neuronal marker compared to non-induced cells. mean±s.e.m., n = 3 biologically independent samples per group, two-sided Student’s t-test. (b) ATOH1-induced cells exhibit neuronal morphology with TUBB3 neuronal protein marker expression at 4 dpi compared to non-induced cells using immunofluorescent staining. Scale bar, 100 μm. Experiments were performed independently at least three times with similar results. (c) ATOH1-induced cells are transcriptomically similar to human brain tissue. Principal component (PC) analysis of RNA-seq samples from ATOH1-induced cells (orange) overlap with samples from human brain tissue (red), and are distinctly separated from PGP1 hiPSCs (gray). (d) ATOH1-induced cells show similar up-regulation of neuronal markers as human brain tissue. Heatmap of neuronal gene expression profiles. (e) ATOH1-induced cells are electrophysiologically functional at 14 dpi. Electrophysiology recordings by whole-cell patch clamping after current injection. (f) ATOH1-induced cells mature over time to exhibit spontaneous trains of action potentials. Bar plots of percentage of cells having each type of action potential at 7, 14, and 21 dpi. n = number of single cells. (g) NKX3-1 rapidly and efficiently induces hiPSCs into fibroblasts. Bar plot of flow cytometry for VIM fibroblast marker at 4 dpi compared to non-induced cells. mean±s.e.m., n = 3 biologically independent samples per group, two-sided Student’s t-test. (h) NKX3-1-induced cells show fibroblast morphology with ALCAM and HSP47 fibroblast protein marker expression at 4 dpi using immunofluorescent staining. Scale bar, 100 μm. Experiments were performed independently at least three times with similar results. (i) NKX3-1-induced cells are transcriptomically similar to primary fibroblasts. Principal component (PC) analysis of RNA-seq samples from NKX3-1-induced cells (orange) overlap with samples from primary fibroblasts (red), with a clear distance away from PGP1 hiPSCs (gray). (j) NKX3-1-induced cells show similar up-regulation of fibroblast markers as primary fibroblast based on RNA-seq analysis. Heatmap of fibroblast gene expression profiles. (k) NKX3-1-induced cells exhibit functionality in an in vitro wound healing assay by repairing a scratch in a confluent cell monolayer. Brightfield images of 4 dpi NKX3-1-induced cells at days 0, 1, or 2 after gap creation. Scale bar, 100μm. Experiments were performed independently at least three times with similar results. (l) Significant reduction in wound area by NKX3-1-induced cells (red), but not hiPSCs (black). Quantification of wound area in scratch assay. mean±s.e.m., n = 3 biologically independent samples per group, two-sided Student’s t-test. n.s., not significant. ** P < 0.01. *** P < 0.001. Exact P-values are provided in Supplementary Table 7.
Figure 3
Figure 3. ETV2 isoform 2 induces vascular endothelial–like cells that form perfusable blood vessels in vivo.
(a) ETV2 isoform 2 induction differentiated hiPSCs into 95±0.2% VE-Cadherin+ (CDH5) vascular endothelial-like cells, which is superior to other splice-isoforms. Bar plot of flow cytometry for VE-Cadherin vascular endothelial marker at 4 dpi compared to non-induced cells for each splice-isoform. mean±s.e.m., n = 3 biologically independent samples per group, two-sided Student’s t-test. (b) ETV2-isoform-2-induced cells exhibit homogeneous cobblestone endothelial morphology and VE-Cadherin protein marker expression at 4 dpi compared to other splice-isoforms and non-induced cells using immunofluorescent staining. Scale bar, 100 μm. Experiments were performed independently at least three times with similar results. (c) 4 dpi ETV2-isoform-2-induced cells form angiogenic tubes overnight, marked by arrowheads. Fluorescence imaging of ETV2-induced cells on thick Matrigel. Scale bar, 300μm. Experiments were performed independently at least three times with similar results. (d) ETV2-isoform-2-induced cells are transcriptomically similar to primary human umbilical cord endothelial cells (HUVECs). Principal component (PC) analysis of RNA-seq samples from ETV2-isoform-2-induced cells (orange) overlap with samples from HUVECs (red), and are distinctly apart from PGP1 hiPSCs (gray) and HUVEC-reference hiPSCs (black). (e) ETV2-isoform-2-induced cells show similar up-regulation of endothelial markers as HUVECs. Heatmap of endothelial gene expression profiles. (f) ETV2-isoform-2-induced cells homogeneously express vascular endothelial markers and lose pluripotency markers. Uniform Manifold Approximation and Projection (UMAP) plot of single cell RNA-seq (scRNA-seq) samples of ETV2-isoform-2-induced cells 4 dpi (left cluster) and hiPSCs (right cluster) showing gray (low) to red (high) for the level of gene expression of the indicated endothelial markers PLVAP, PECAM1 and CDH5 (VE-Cadherin), and pluripotency markers POU5F1/OCT4, NANOG and SOX2. (g) 4 dpi ETV2-isoform-2-induced cells form open lumens in an angiogenesis assay overnight. Transmission electron microscopy (TEM) on a cross-section of tubes of angiogenic tubes. L, lumen. Scale bar, 1 μm. Experiments were performed independently at least three times with similar results. (h) Open lumens formed by ETV2-isoform-2-induced cells have diameters similar to capillaries. Quantification of lumen diameter. mean±s.e.m., n = 3 biologically independent samples. (i) ETV2-isoform-2-induced cells transplanted subcutaneously into nude mice form mature blood vessels in vivo. Immunofluorescent staining of a tissue section from the graft for the human-specific CD31 (hCD31) vascular endothelial protein marker shows human endothelial cells lining open lumens, which are mature based on the surrounding SMA+ pericytes. Scale bar, 50 μm. Experiments were performed independently at least three times with similar results. (j) Blood vessels formed in vivo by ETV2-isoform-2-induced cells are perfused and integrated with the host circulatory system. H&E (Hematoxylin and eosin) staining of a tissue section (serial section from panel (i)) show mouse red blood cells within the capillaries. Scale bar, 50 μm. Experiments were performed independently at least three times with similar results. (k) Capillaries formed in vivo by transplanted ETV2-isoform-2-induced cells have similar density to in vivo tissues. Quantification of number of hCD31+ blood vessels. mean±s.e.m., n = 5 animals. n.s., not significant. ** P < 0.01. *** P < 0.001. Exact P-values are provided in Supplementary Table 7.
Figure 4
Figure 4. Parallel programming enable simultaneous differentiation of multiple cell types in the same dish.
(a) Schematic of parallel programming where TFs are induced and multiple cell types are produced in the same culture. (b) Parallel programming enables induced neurons, fibroblasts and vascular endothelial-like cells to co-differentiate in the same culture and conditions. Engineered hiPSC lines co-cultured in a pairwise fashion or altogether 4 dpi or not induced are immunofluorescently stained for the MAP2 neuronal marker, ALCAM fibroblast marker and VE-Cadherin (CDH5) endothelial marker. Scale bar, 100 μm. Experiments were performed independently at least three times with similar results. (c) Parallel programming of cell lines mixed at equal ratios gives rise to co-cultures with comparable proportions for each cell type at 4 dpi. Bar plot of flow cytometry for the VE-Cadherin vascular endothelial marker, VIM fibroblast marker and NCAM neuronal marker at 4 dpi compared to non-induced cells. mean±s.e.m., n = 3 biologically independent samples per group. (d) Triple parallel programmed co-cultures containing ATOH1-, ETV2-isoform-2- and NKX3-1-induced cells 4 dpi homogeneously express the expected cell type-specific markers. UMAP plot of scRNA-seq using Smart-seq2 library preparation shows three distinct populations. NKX3-1-induced cells express the COL1A1 fibroblast marker, ATOH1-induced cells express the NCAM1 neuronal marker and ETV2-induced cells express the CDH5 (VE-Cadherin) endothelial marker. Color scale from gray (low) to red (high) shows expression level of the indicated genes. (e) Triple parallel programmed cells show distinct transcriptomic signatures that correspond to expected cell type-specific markers. Heatmap of scRNA-seq showing the top ten marker genes from each cluster as computed by Student’s t-test. Single cells as rows and genes as columns.
Figure 5
Figure 5. SOX9 induces oligodendrocytes that engraft and form compact myelin in vivo and in cerebral organoids.
(a) SOX9 rapidly and efficiently programs hiPSCs into induced oligodendrocytes at 4 dpi. Bar plot of flow cytometry for O4 oligodendrocyte marker compared to non-induced cells. mean±s.e.m., n = 3 biologically independent samples per group, two-sided Student’s t-test. (b) SOX9-induced cells exhibit O4 and NG2 oligodendrocyte protein marker expression at 4 dpi compared to non-induced cells using immunofluorescent staining. Scale bar, 100 μm. Experiments were performed independently at least three times with similar results. (c) SOX9-induced cells are transcriptomically similar to primary oligodendrocytes. Principal component (PC) analysis of RNA-seq samples from SOX9-induced cells (purple) overlap with samples from primary mature oligodendrocytes (OL; orange), with similarity to oligodendrocyte progenitor cells (OPCs; red), and are distinctly separated from newly formed oligodendrocytes (OLs; brown) and PGP1 hiPSCs (gray). (d) SOX9-induced cells show similar up-regulation of oligodendrocyte markers as primary oligodendrocytes. Heatmap of oligodendrocyte gene expression profiles. (e) SOX9-induced cells form a homogeneous cluster that expresses oligodendrocyte markers and lose pluripotency markers. UMAP plot of scRNA-seq samples of SOX9-induced cells 4 dpi (right cluster) and hiPSCs (left cluster) showing gray (low) to red (high) for the level of gene expression of the indicated oligodendrocyte markers CSPG4 (NG2) and MYRF, and pluripotency markers POU5F1/OCT4, NANOG and SOX2. (f) Parallel programming of SOX9-induced oligodendrocytes and hiPSC-derived inducible neurons produces synthetic oligo-neuronal co-cultures that form compact myelin in vitro. TEM on a cross-section of the oligo-neuronal co-culture in the photo-micropatterned microchannels. M, myelin. A, axon. Scale bar, 100 nm. Experiments were performed independently at least three times with similar results. (g) Quantification of G-ratio for myelin compaction is within the physiological range. mean±s.e.m., n = 6 independent samples. (h) Transplanted SOX9-induced cells engraft and express MBP in Shiverer (MBP knock-out) mice at 2.5 months. Immunofluorescent staining of a brain tissue section for the MBP myelin marker after PBS injection or SOX9-induced cell transplantation into Shiverer mice. PBS, phosphate buffered saline. Scale bar, 200 μm. Experiments were performed independently at least three times with similar results. (i) Transplanted SOX9-induced cells form compact myelin in Shiverer mice. TEM of a cross-section from PBS-injected or SOX9-induced cell transplantation into Shiverer mice. Scale bar, 600 nm. Experiments were performed independently at least three times with similar results. (j) Shiverer mice with transplanted SOX9-induced cells have significantly more myelinated axons than PBS-injected animals. Quantification of the number of myelinated axons from PBS-injected or SOX9-induced cell transplantation into Shiverer mice. mean±s.e.m., n = 12 micrographs taken at distinct locations derived from two PBS-injected animals and n = 21 micrographs taken at distinct locations derived from three animals with cell transplantation, two-sided Student’s t-test. (k) Schematic of orthogonal programming where engineered hiPSCs for TF-inducible differentiation are incorporated at the genesis of developmentally inspired cerebral organoids to synthetically accelerate myelination. (l) Orthogonal programming of inducible SOX9 cells within cerebral organoids accelerated expression of the MOG myelin marker. Immunofluorescent staining of a cerebral organoid section for MOG myelin marker and NeuN neuronal marker in orthogonally induced versus non-induced organoids. Scale bar, 100μm. Experiments were performed independently at least three times with similar results. (m) SOX9 orthogonally programmed organoids for compact myelin. TEM of myelin in a cerebral organoid. Yellow region magnified on right. M: myelin, A: axon. Scale bar, 200 nm. Inset scale bar, 100 nm. Experiments were performed independently at least three times with similar results. (n) Quantification of G-ratio for myelin compaction in cerebral organoids shows physiological resemblance. mean±s.e.m., n = 3 biologically independent samples. *** P < 0.001. Exact P-values are provided in Supplementary Table 7.

References

    1. Davis RL, Weintraub H, Lassar AB. Expression of a single transfected cDNA converts fibroblasts to myoblasts. Cell. 1987;51:987–1000. - PubMed
    1. Takahashi K, Yamanaka S. Induction of pluripotent stem cells from mouse embryonic and adult fibroblast cultures by defined factors. Cell. 2006;126:663–676. - PubMed
    1. Zhang Y, et al. Rapid single-step induction of functional neurons from human pluripotent stem cells. Neuron. 2013;78:785–798. - PMC - PubMed
    1. Parekh U, et al. Mapping Cellular Reprogramming via Pooled Overexpression Screens with Paired Fitness and Single-Cell RNA-Sequencing Readout. Cell systems. 2018;7:548–555. e548. - PMC - PubMed
    1. Tsunemoto R, et al. Diverse reprogramming codes for neuronal identity. Nature. 2018;557:375–380. - PMC - PubMed

Publication types

Substances