. 2021 Apr;39(4):431-441.
doi: 10.1038/s41587-020-0731-9. Epub 2020 Nov 30.

Targeted nanopore sequencing by real-time mapping of raw electrical signal with UNCALLED

Affiliations

Targeted nanopore sequencing by real-time mapping of raw electrical signal with UNCALLED

Sam Kovaka et al. Nat Biotechnol. 2021 Apr.

Abstract

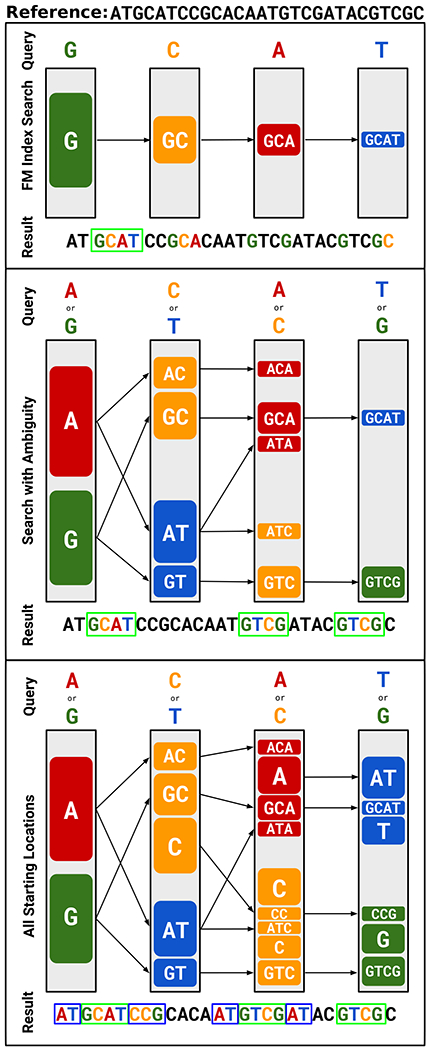
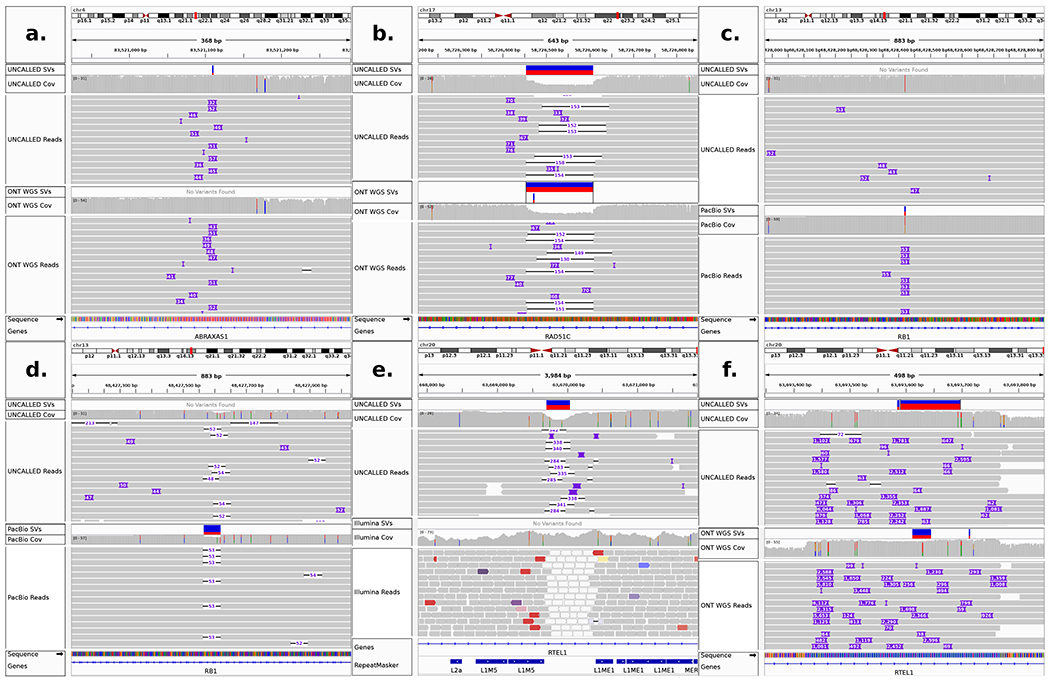
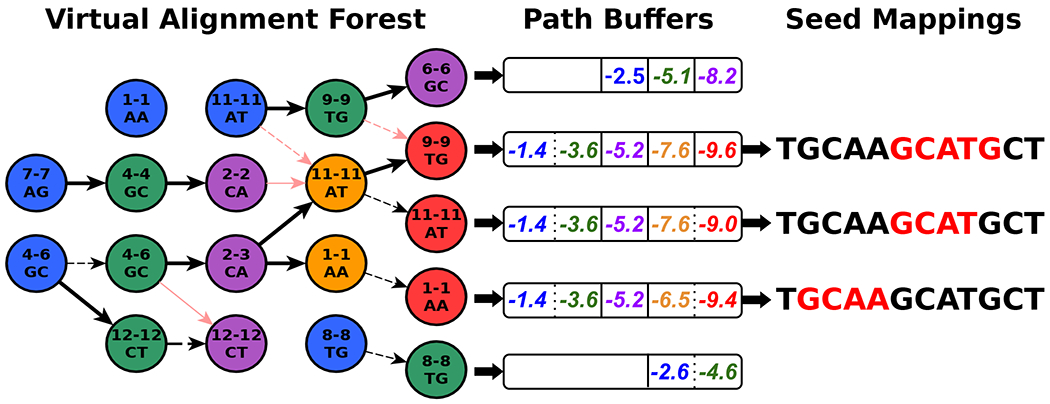
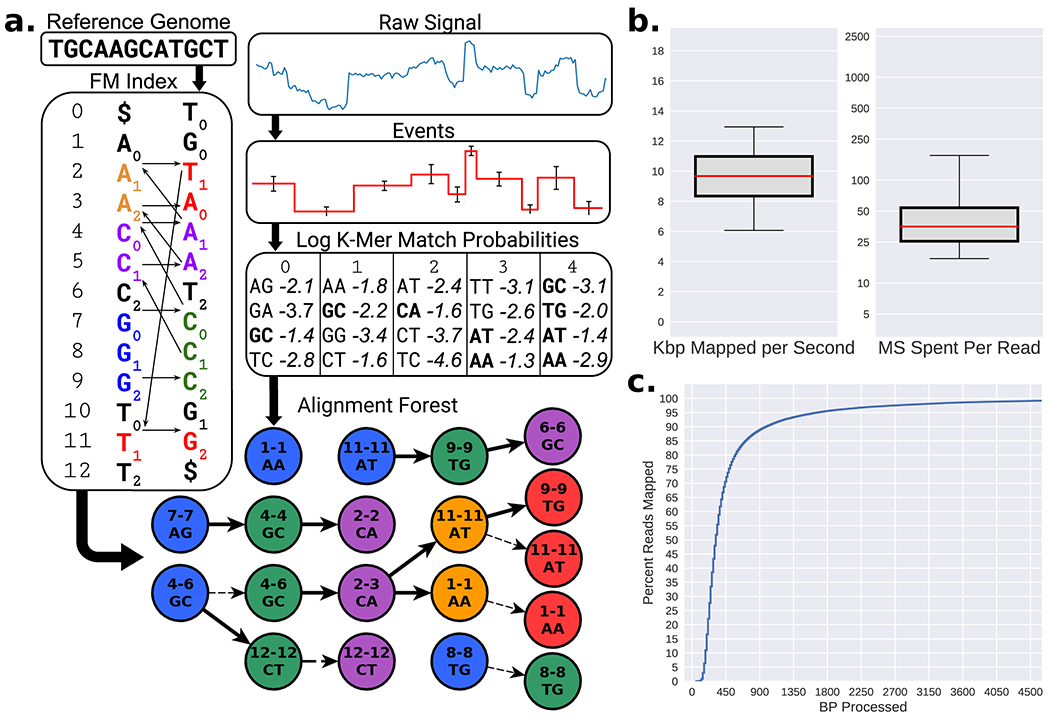
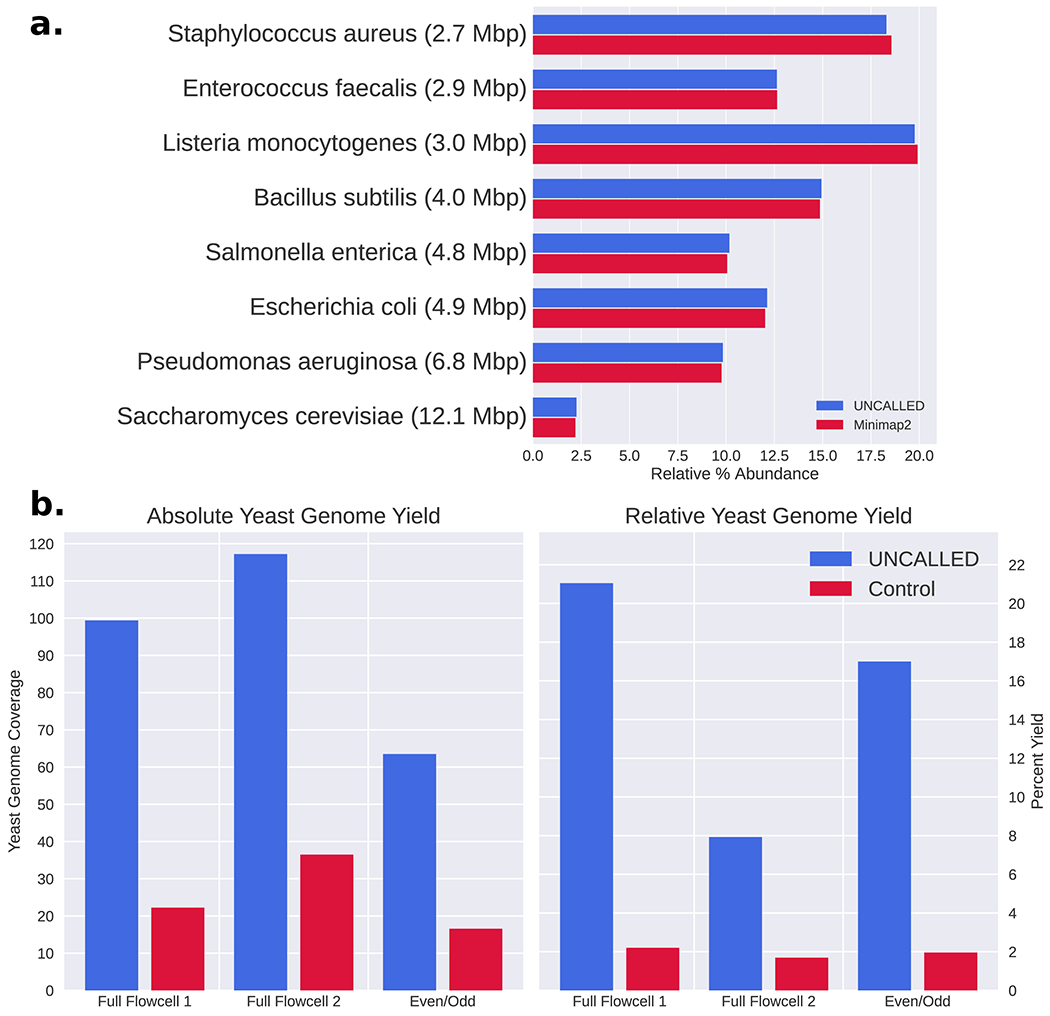
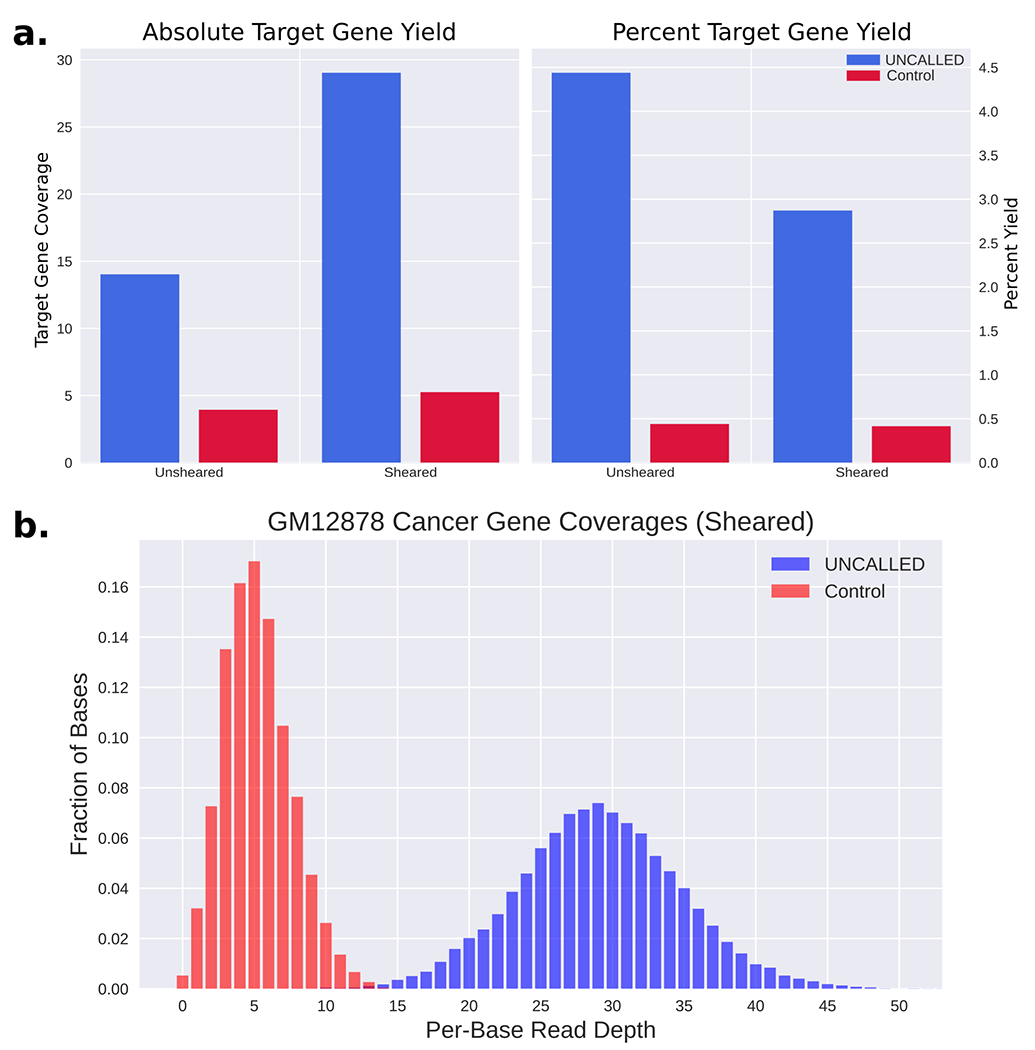
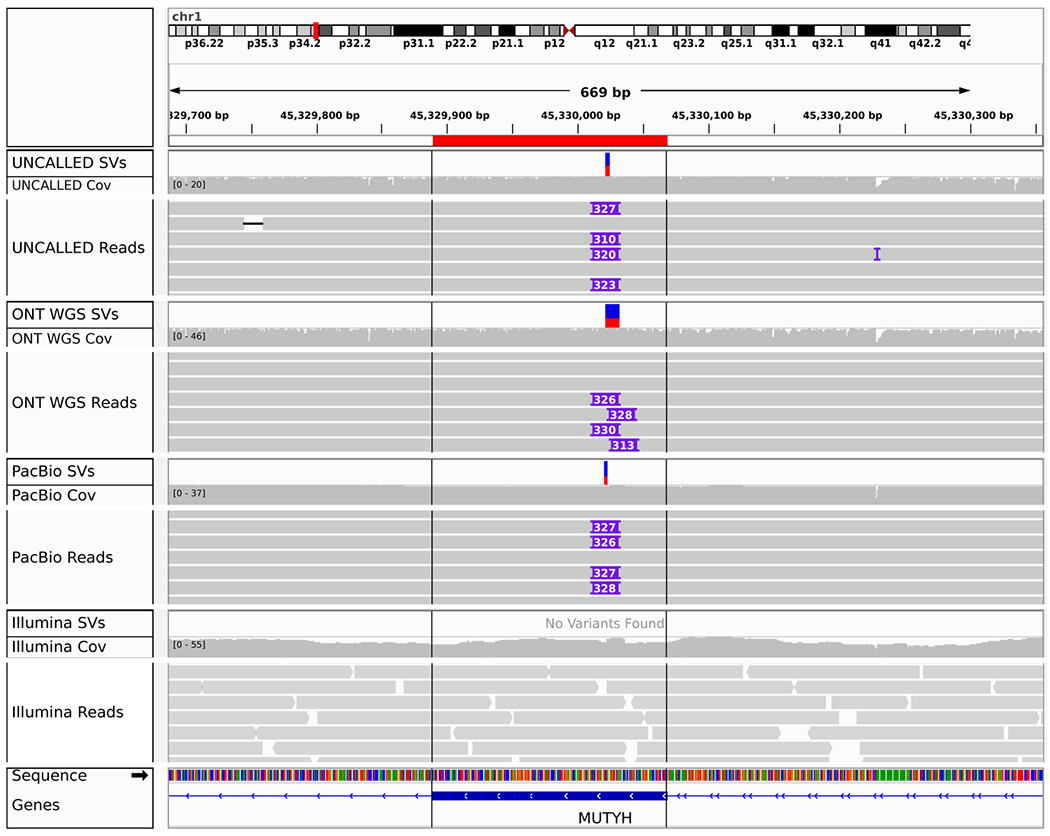
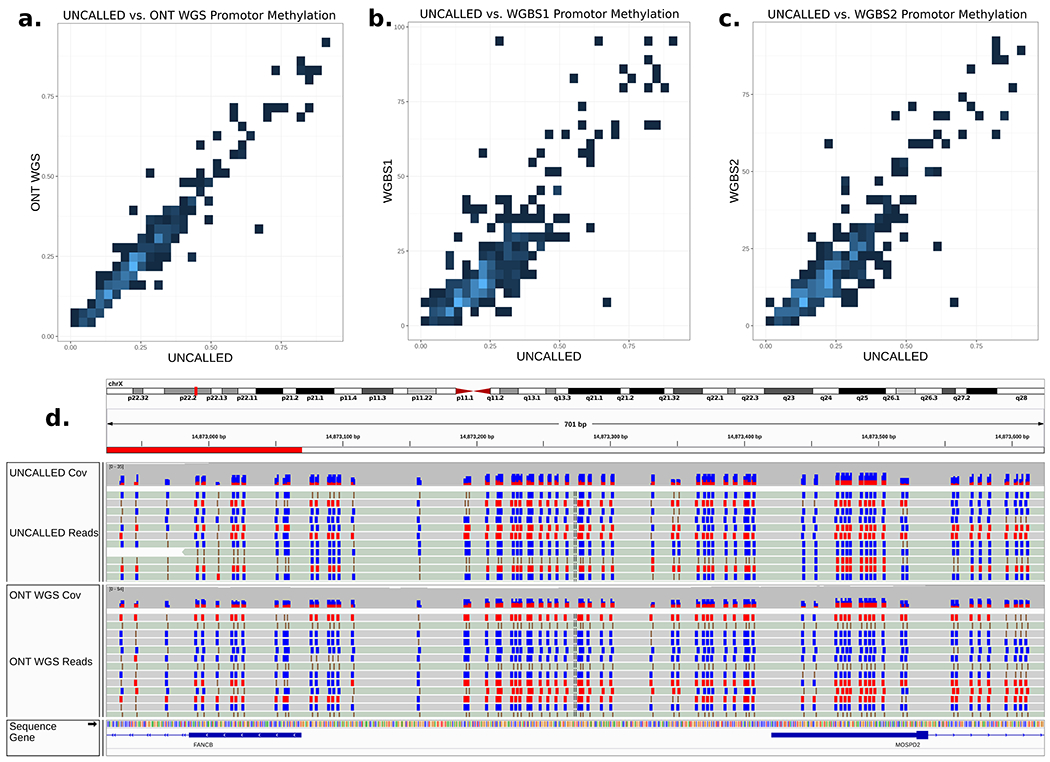
Conventional targeted sequencing methods eliminate many of the benefits of nanopore sequencing, such as the ability to accurately detect structural variants or epigenetic modifications. The ReadUntil method allows nanopore devices to selectively eject reads from pores in real time, which could enable purely computational targeted sequencing. However, this requires rapid identification of on-target reads while most mapping methods require computationally intensive basecalling. We present UNCALLED ( https://github.com/skovaka/UNCALLED ), an open source mapper that rapidly matches streaming of nanopore current signals to a reference sequence. UNCALLED probabilistically considers k-mers that could be represented by the signal and then prunes the candidates based on the reference encoded within a Ferragina-Manzini index. We used UNCALLED to deplete sequencing of known bacterial genomes within a metagenomics community, enriching the remaining species 4.46-fold. UNCALLED also enriched 148 human genes associated with hereditary cancers to 29.6× coverage using one MinION flowcell, enabling accurate detection of single-nucleotide polymorphisms, insertions and deletions, structural variants and methylation in these genes.


Figures

Extended Data Figure 1.
FM Index alignment examples. (top) FM index alignment of a standard DNA sequence, where the size of each box represents the number of possible locations. (middle) FM alignment of a sequence where every position could be one of two bases. Base ambiguity is analogous to the k-mers we consider for every event. (bottom) Same as middle but alignments starting from all positions are found by filling in the gaps between ranges from previous alignments.
Extended Data Figure 2.
Match Probability Thresholds (a) Relationship between natural log probability thresholds (x-axis), the mean number of k-mers that match above each threshold per event (blue), the fraction of events that match their correct k-mer above each threshold (red). The values for r9.4 chemistry are shown here. (b) The FM index range lengths assigned to different probability thresholds for the E. coli reference. This function varies depending on the reference used.
Extended Data Figure 3.
Pore activity during Zymo “full flowcell 1” sequencing runs. (a) Percent of channels that are labeled active throughout zymo bacterial depletion UNCALLED and control runs, based on the percent of signal labeled “pore” or “strand” in the MinKNOW duty times. Curves are smoothed by taking the mean of 92 minute windows, which smooths over mux scans. (b) Number of channels which are “alive” throughout the run, meaning they have the capacity to sequence reads, based on when the last read was produced. This is distinct from the duty time plots in that a channel may not produce a read for several hours but still be considered “alive”.
Extended Data Figure 4
GM12878 gene enrichment run duty times in the (a) unsheared run and (b) sheared run. Nuclease flushes were carried out at 24 and 48 hours in both runs. Curves plotted as in Extended Data Figure 3. Note: we observed that a large patch of channels were marked as inactive after the second flush in the unsheared UNCALLED run, which can occur because of bubbles introduced when loading.
Extended Data Figure 5.
SVs confirmed by applying sensitive parameters in Sniffles and SURVIVOR or which required manual inspection to correct. (a) Insertion detected by UNCALLED but not by ONT WGS because most reads represented it as < 50bp. (b) Insertion detected by ONT WGS but not by UNCALLED because of low-complexity sequence. The overlapping deletion on the other haplotype also likely made the insertion difficult to resolve. (c) Insertions detected by UNCALLED but not by PacBio because of low-complexity sequence. (d) Deletion detected by PacBio but not by UNCALLED. (e) Deletion detected by UNCALLED (and all other long-read datasets) but not by Illumina reads, likely because of surrounding repetitive elements. Note that white read alignments indicate low mapping quality. (f) Sniffles called two SVs in this locus in both UNCALLED and ONT WGS, while it appears to represent a single duplication. SURVIVOR merged the ONT WGS SVs but not the UNCALLED SVs, causing a falsely unmatched SV. This is a known issue with SURVIVOR and this case was manually corrected.
Extended Data Figure 6.
Durations of gaps between reads on channel 109 of the Zymo Full Flowcell 1 UNCALLED run. X-axis indicates when a read ended, Y-axis indicates how long until the next read begins (log scale). Dashed vertical lines indicate mux scans, which often correspond to when gap characteristics change due to pore transitions. The horizontal red line is at one standard deviation over the median gap length for the entire run (including other channels), which is the threshold the simulator uses to define active and inactive periods as represented by the top blue and red bars respectively.
Extended Data Figure 7.
(a) Outline of the ReadUntil simulator. Inputs are sequencing summaries of an UNCALLED run and a control run, in addition to the corresponding UNCALLED PAF file and the raw reads from the control run. The overall “pattern” of the simulation is generated from the UNCALLED run: for each channel, gaps between the end of a read and the start of the next are separated into “short” and “long”, where the long gaps are used to define broadly active and inactive periods of the channel (see Extended Data Figure 6) and the short gaps are stored in a series queues. The read chunks and durations are loaded from the control run. Each channel’s reads are stored in a queue and are output in the same order in which they were sequenced, but the exact time that they are output may vary between channels because of ejections. When all reads are output from a channel, the queue “repeats” and outputs the same reads again. Short gaps are stored in similarly operating queues, each associated with a channel and scan interval. Scan intervals are periods between two mux scans which are synchronized across all channels. The read chunks and durations are loaded from the control run. (b) Illustration of how simulations can be shortened by scaling down the active/inactive periods and scan intervals, but leaving the read and short gap duration unchanged.
Extended Data Figure 8.
Simulated results of targeting sets of human genes: (a) absolute enrichment with respect to gene count, (b) absolute enrichment with respect to reference size, (c) true positive rate with respect to gene count, (d) true positive rate with respect to reference size. True positive rates were computed based on reads where the first 1,350bp of each read fully aligns to the target reference according to minimap2. Note that reference size includes the 5Kbp surrounding each gene/exon, while the level of enrichment is calculated based on coverage of the target sequence only (see Supplementary Table 8).
Extended Data Figure 9.
Representation of alignments in path buffers. The “Virtual Alignment Forest” is a more detailed version of the one in Fig. 1a. Pink edges mark paths that were pruned out due to lower probability in order to maintain the tree structure. Shaded backgrounds mark paths that have not been pruned out and are therefore represented in path buffers, and darker shading indicates that part of the path is represented in multiple buffers. “Path Buffers” store cumulative log probabilities that can be used to compute a rolling mean log probability as mapping progresses, as well as “stay” versus “move” events represented by dotted versus solid lines. Seed mappings are inferred from the FM index coordinate which are also stored in the buffers.
Figure 1.
Figure 1.
UNCALLED algorithm and performance on Escherichia coli data. (a) Overview of the algorithm: inputs are an FM index built from the DNA reference, and the raw nanopore signal. The signal is converted to events, and the log probabilities of events matching each k-mer is computed. All paths through the FM-index that are consistent with k-mers that match each event above a threshold are searched, conceptually forming a forest of trees (Extended Data Figure 1 for more details). (b) Boxplots showing the speed of UNCALLED mapping 100,000 E. coli reads to the E. coli K12 reference genome in kilobases per second (left) and total number of milliseconds required to map reads (right). Center lines represent the median, box limits represent upper and lower quartiles, whiskers represent 5% and 95% confidence intervals. (c) Percent of the mapped reads that can be confidently placed within a certain number of basepairs of sequencing. Note the ONT MinION sequences at approximately 450bp/sec. Only reads that were mapped by UNCALLED are considered in b and c.
Figure 2.
Figure 2.
UNCALLED results on the Zymo mock microbial community (a) Barchart of the relative abundances of each genome based on mapping 100,000 reads from a control run to all references using UNCALLED and minimap2. (b) Results of UNCALLED ReadUntil depletion of bacterial genomes in order to enrich yeast sequences, including (left) a barplot of the coverage of the yeast genome in the UNCALLED and control runs, and (right) a barplot of the percent of the yield from the yeast genome in the UNCALLED and control runs. In Full Flowcell 1 UNCALLED produced 3,737,989 reads and Control produced 802,603 reads, in Full Flowcell 2 UNCALLED produced 9,288,338 reads and Control produced 3,581,419 reads, and in Even/Odd UNCALLED produced 4,545,501 reads and Control produced 1,265,826 reads.
Figure 3.
Figure 3.
Human cancer gene enrichment using UNCALLED, (a, left) Barplot of the coverage over all 148 target genes in the UNCALLED and control runs. (a, right). Barplot of the percent of the yield from the target genes in the UNCALLED and control runs. In the unsheared run UNCALLED produced 2,532,783 reads and Control produced 627,660 reads, and in the sheared run UNCALLED produced 7,672,160 reads and Control produced 1,394,420 reads. (b) Distribution of per-base coverage over every nucleotide in the target genes in the sheared UNCALLED run. Control ranges from 0x to 15x coverage, while UNCALLED ranges from 7x to 57x coverage.
Figure 4.
Figure 4.
IGV visualization of a heterozygous Alu insertion in an exon of the MUTYH gene detected by UNCALLED, ONT WGS, and PacBio HiFi reads. This was not detected by Illumina reads, likely because short reads cannot span the length of the Alu repeat.
Figure 5.
Figure 5.
(a) Heatmap showing the estimated level of methylation in promoters across the targeted 148 gene regions associated with hereditary cancer in the 29.6x coverage sheared GM12878 UNCALLED run versus a 51.1x whole-genome sequencing (WGS) ONT run. (b,c) Comparison between UNCALLED promoter methylation estimates and two GM12828 whole-genome bisulfite sequencing (WGBS) runs. (d) IGV visualization at the transcription start site of FANCB on chromosome X. Each individual read tends to be fully methylated or fully non-methylated, likely due to X inactivation. Blue boxes indicate hypomethylated CpG sites, red boxes indicate hypermethylated CpG sites.

Comment in

References

    1. Miga KH et al. Telomere-to-telomere assembly of a complete human X chromosome. bioRxiv 735928 (2019) doi: 10.1101/735928. - DOI - PMC - PubMed
    1. Sedlazeck FJ, Lee H, Darby CA & Schatz MC Piercing the dark matter: bioinformatics of long-range sequencing and mapping. Nat. Rev. Genet 19, 329–346 (2018). - PubMed
    1. Simpson JT et al. Detecting DNA cytosine methylation using nanopore sequencing. Nat. Methods 14, 407–410 (2017). - PubMed
    1. Rang FJ, Kloosterman WP & de Ridder J From squiggle to basepair: computational approaches for improving nanopore sequencing read accuracy. Genome Biol. 19, 90 (2018). - PMC - PubMed
    1. Quick J et al. Real-time, portable genome sequencing for Ebola surveillance. Nature 530, 228–232 (2016). - PMC - PubMed

References (Online Methods)

    1. David M, Dursi LJ, Yao D, Boutros PC & Simpson JT Nanocall: an open source basecaller for Oxford Nanopore sequencing data. Bioinformatics 33, 49–55 (2017). - PMC - PubMed
    1. Welford BP Note on a Method for Calculating Corrected Sums of Squares and Products. Technometrics 4, 419–420 (1962).
    1. Langmead B, Trapnell C, Pop M & Salzberg SL Ultrafast and memory-efficient alignment of short DNA sequences to the human genome. Genome Biol. 10, R25 (2009). - PMC - PubMed
    1. Kim D, Langmead B & Salzberg SL HISAT: a fast spliced aligner with low memory requirements. Nat. Methods 12, 357–360 (2015). - PMC - PubMed
    1. Gog S & Petri M Optimized succinct data structures for massive data. Softw. Pract. Exp 44, 1287–1314 (2014).

Publication types