. 2020 Dec;52(12):1346-1354.
doi: 10.1038/s41588-020-00740-8. Epub 2020 Nov 30.

Improving the trans-ancestry portability of polygenic risk scores by prioritizing variants in predicted cell-type-specific regulatory elements

Affiliations

Improving the trans-ancestry portability of polygenic risk scores by prioritizing variants in predicted cell-type-specific regulatory elements

Tiffany Amariuta et al. Nat Genet. 2020 Dec.

Abstract

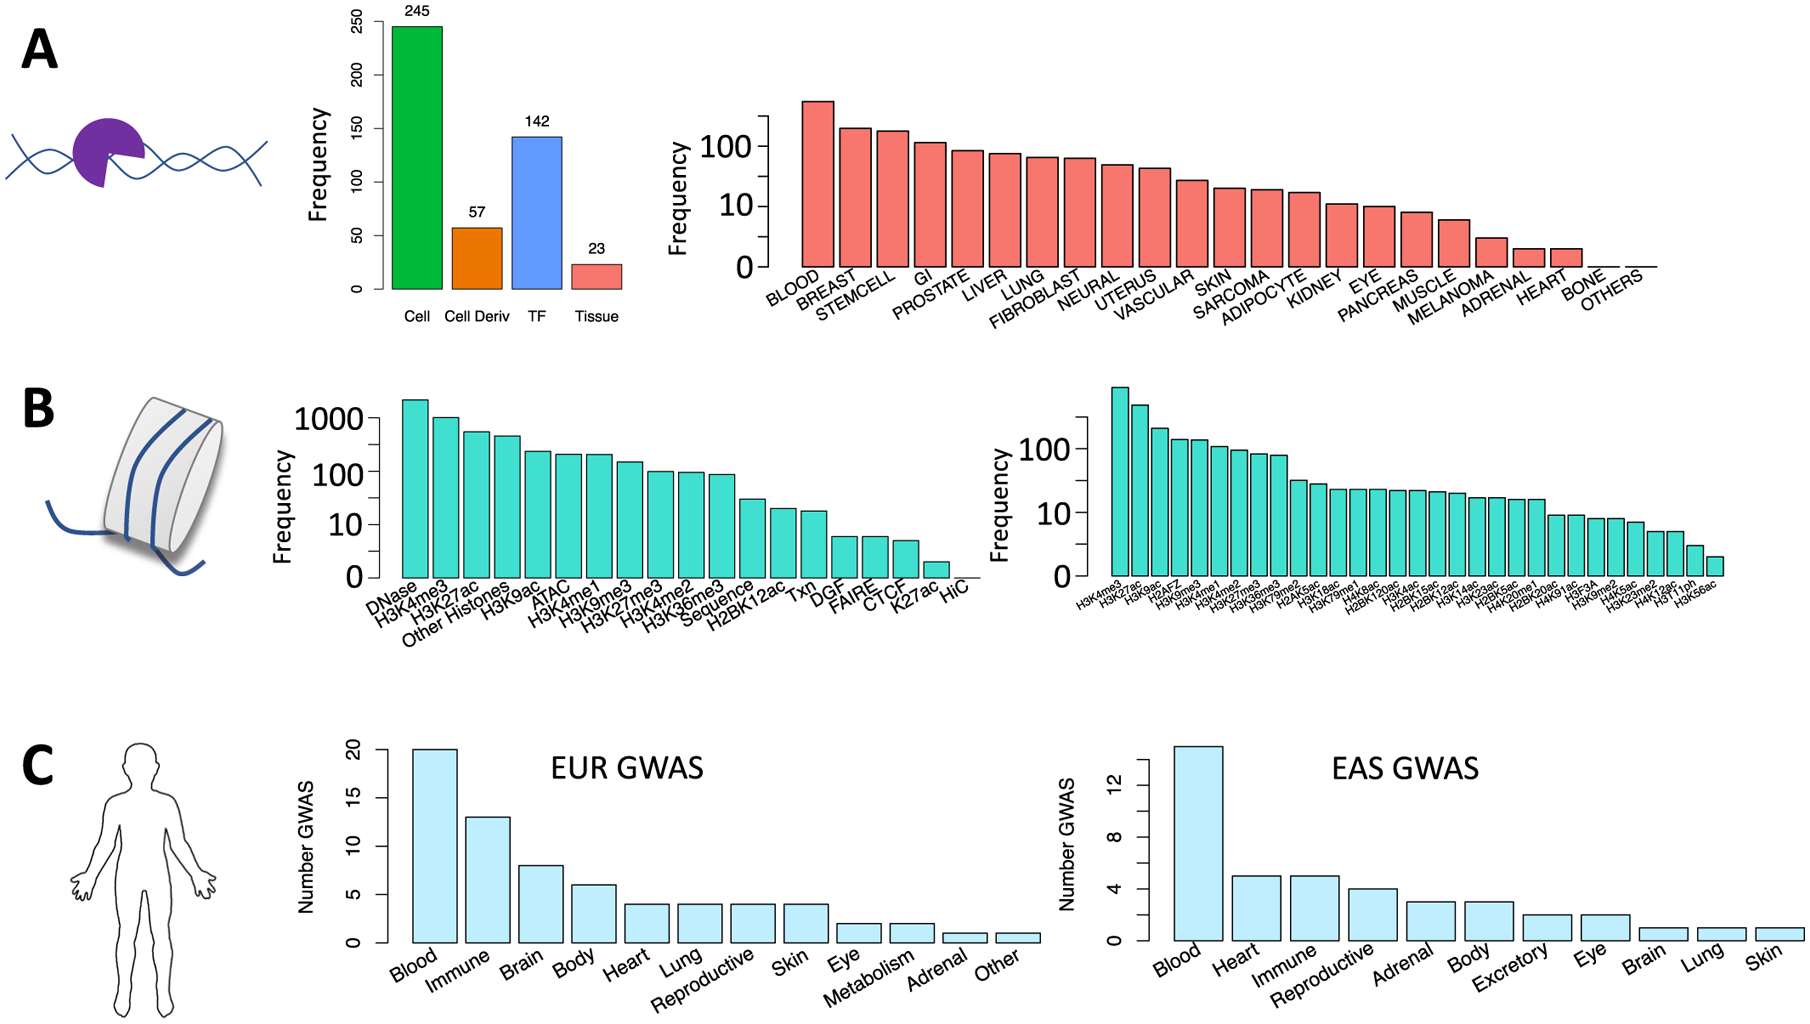
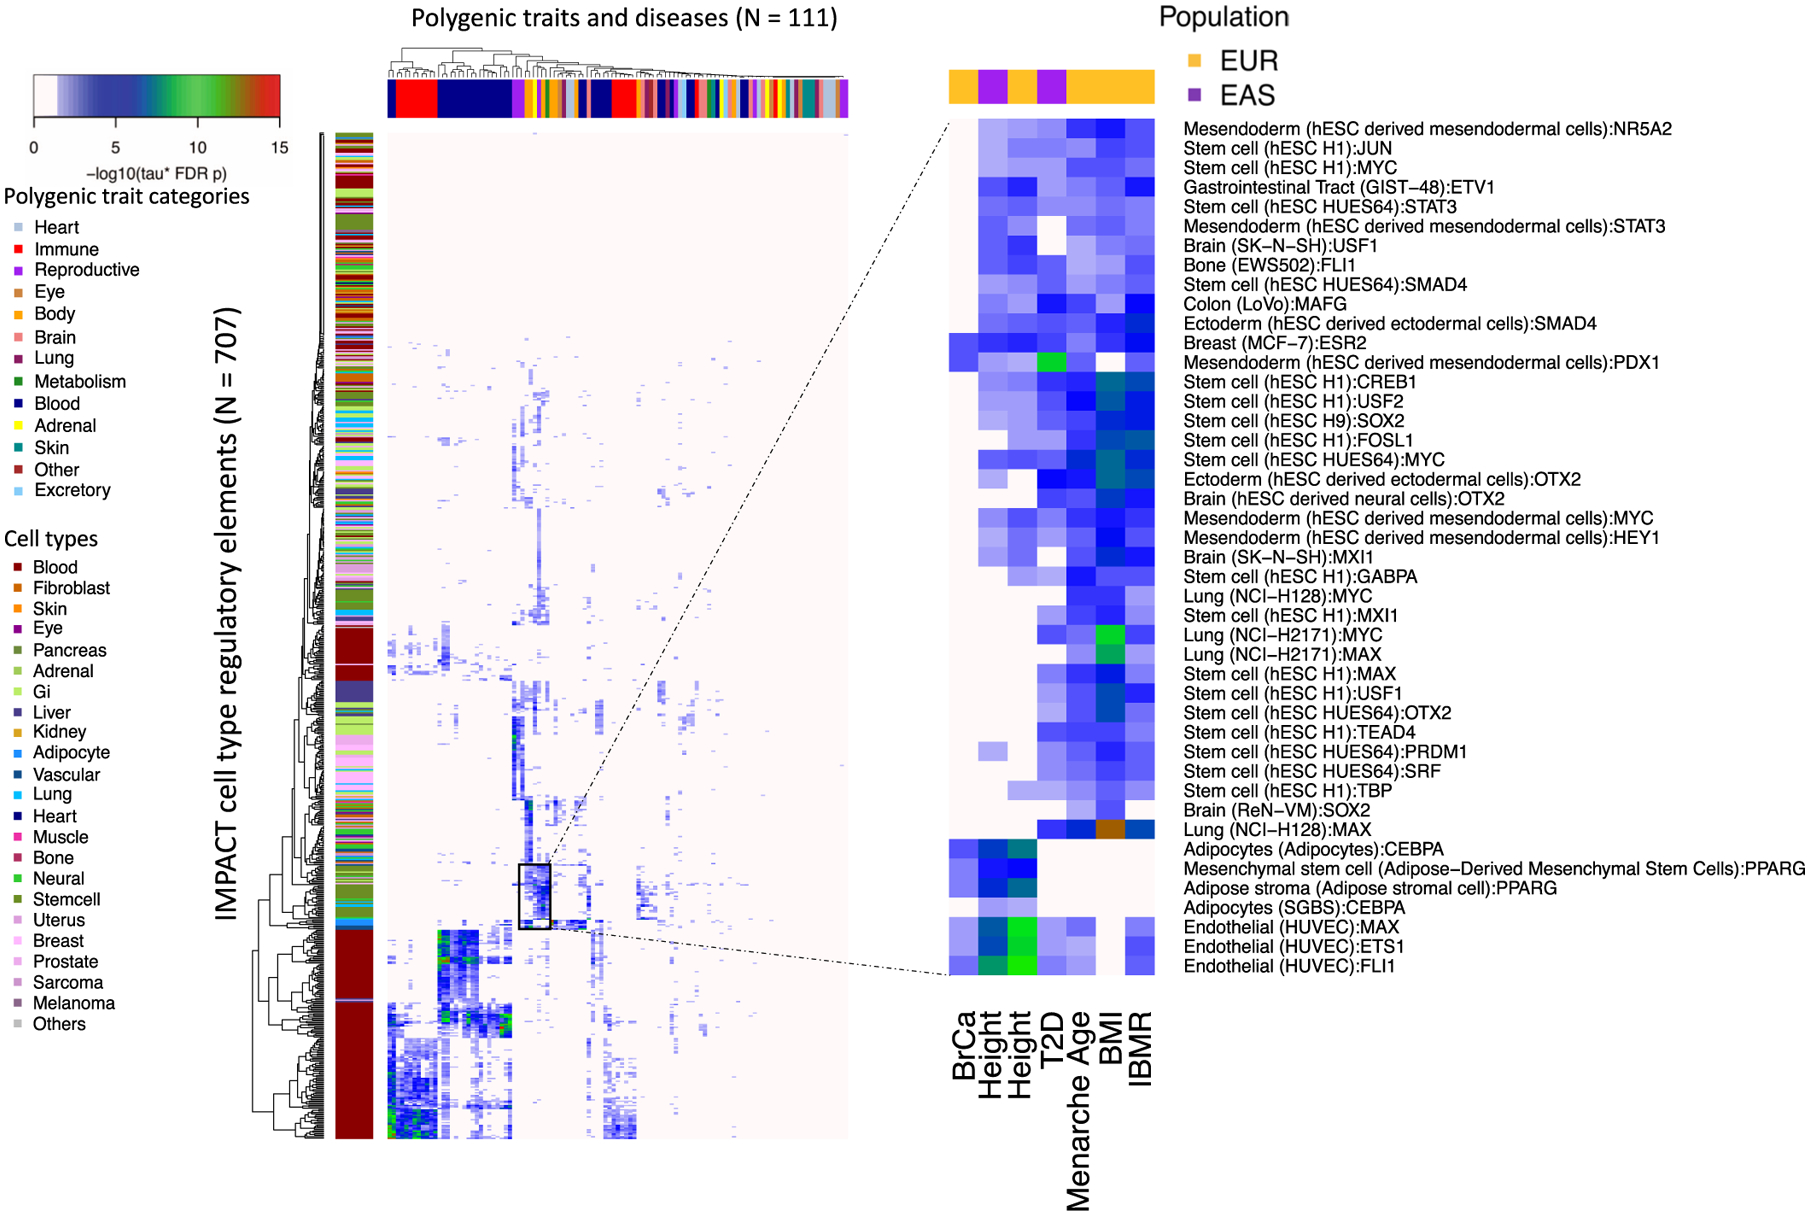
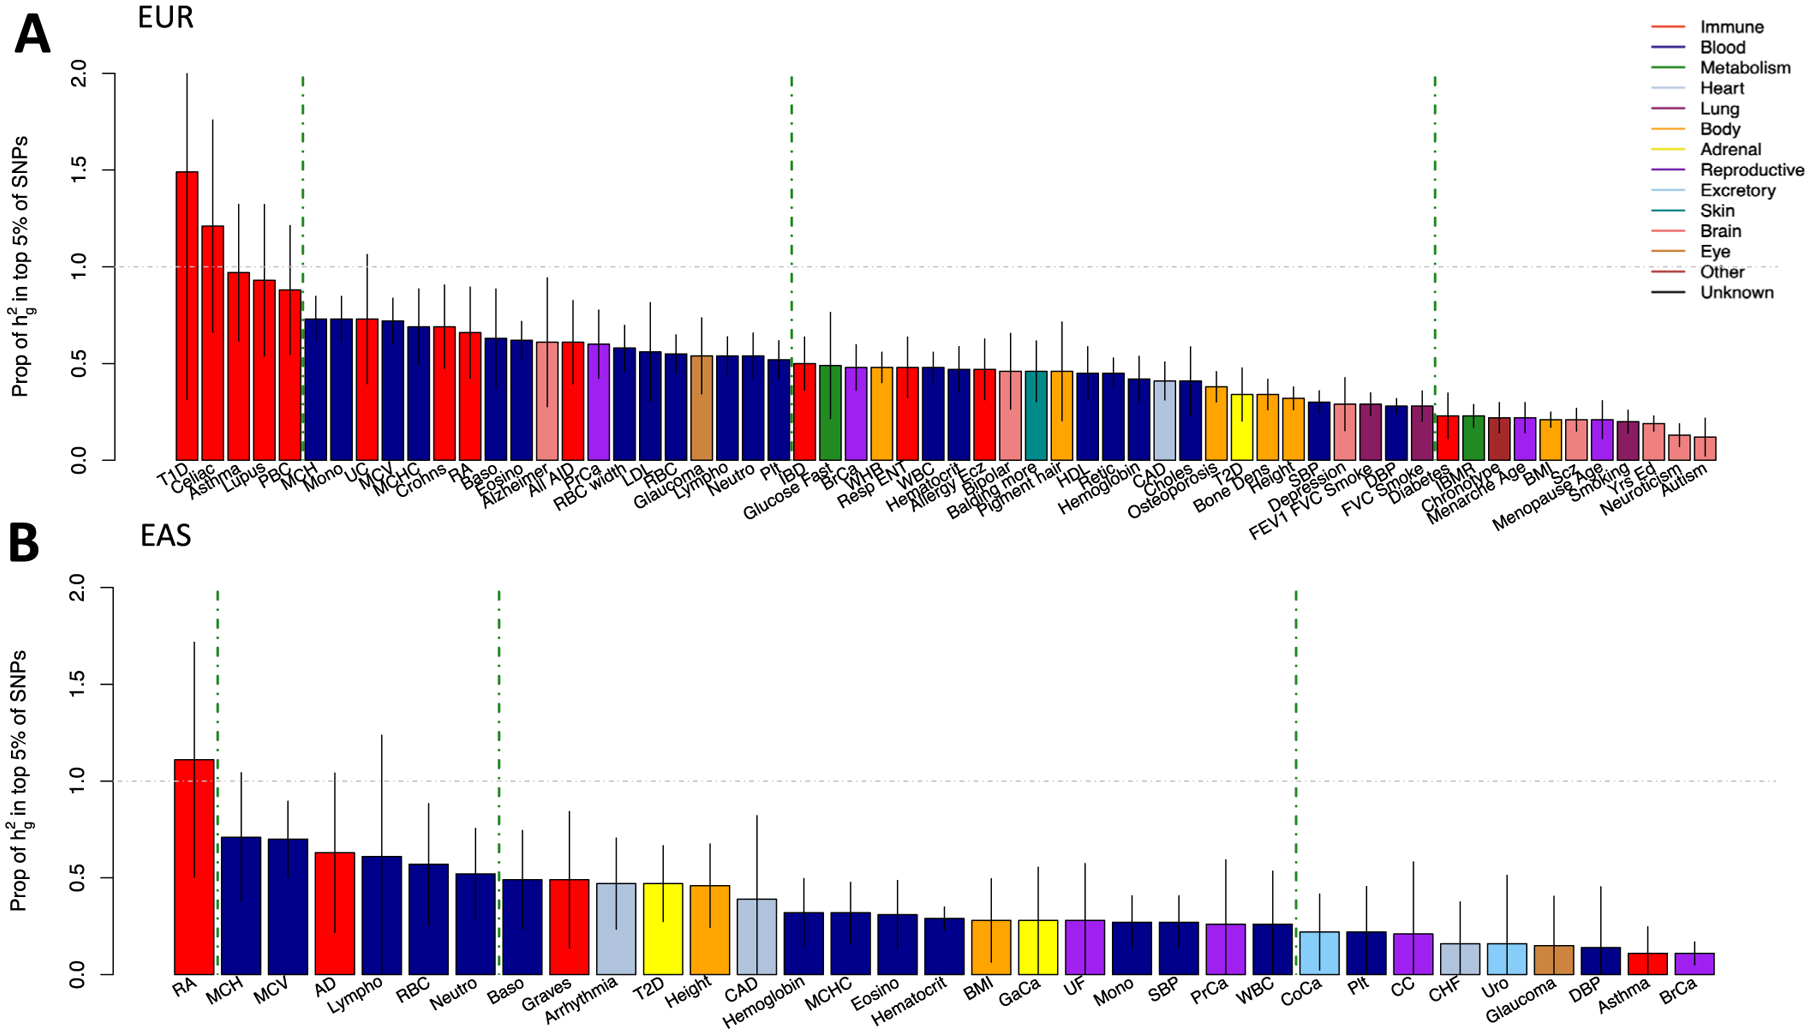
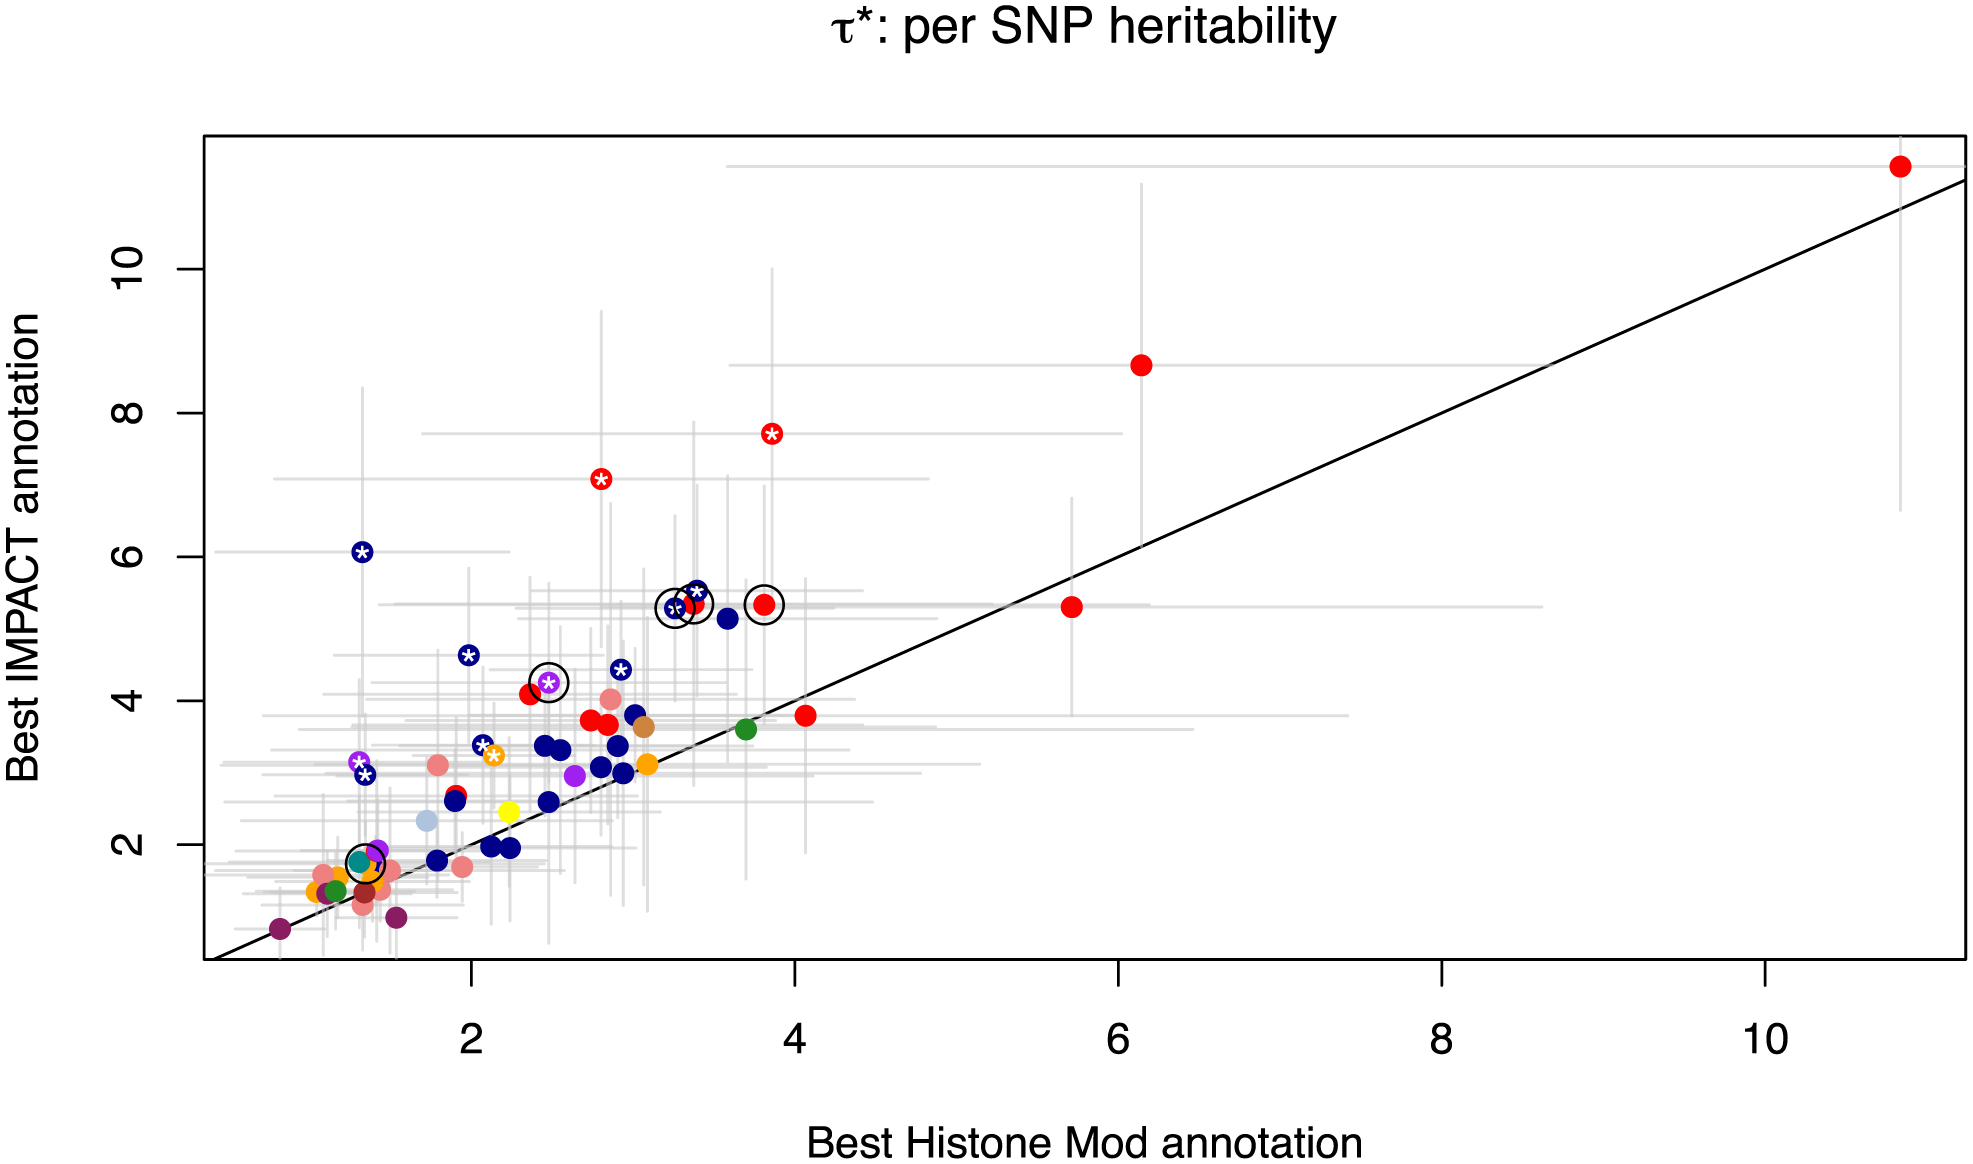
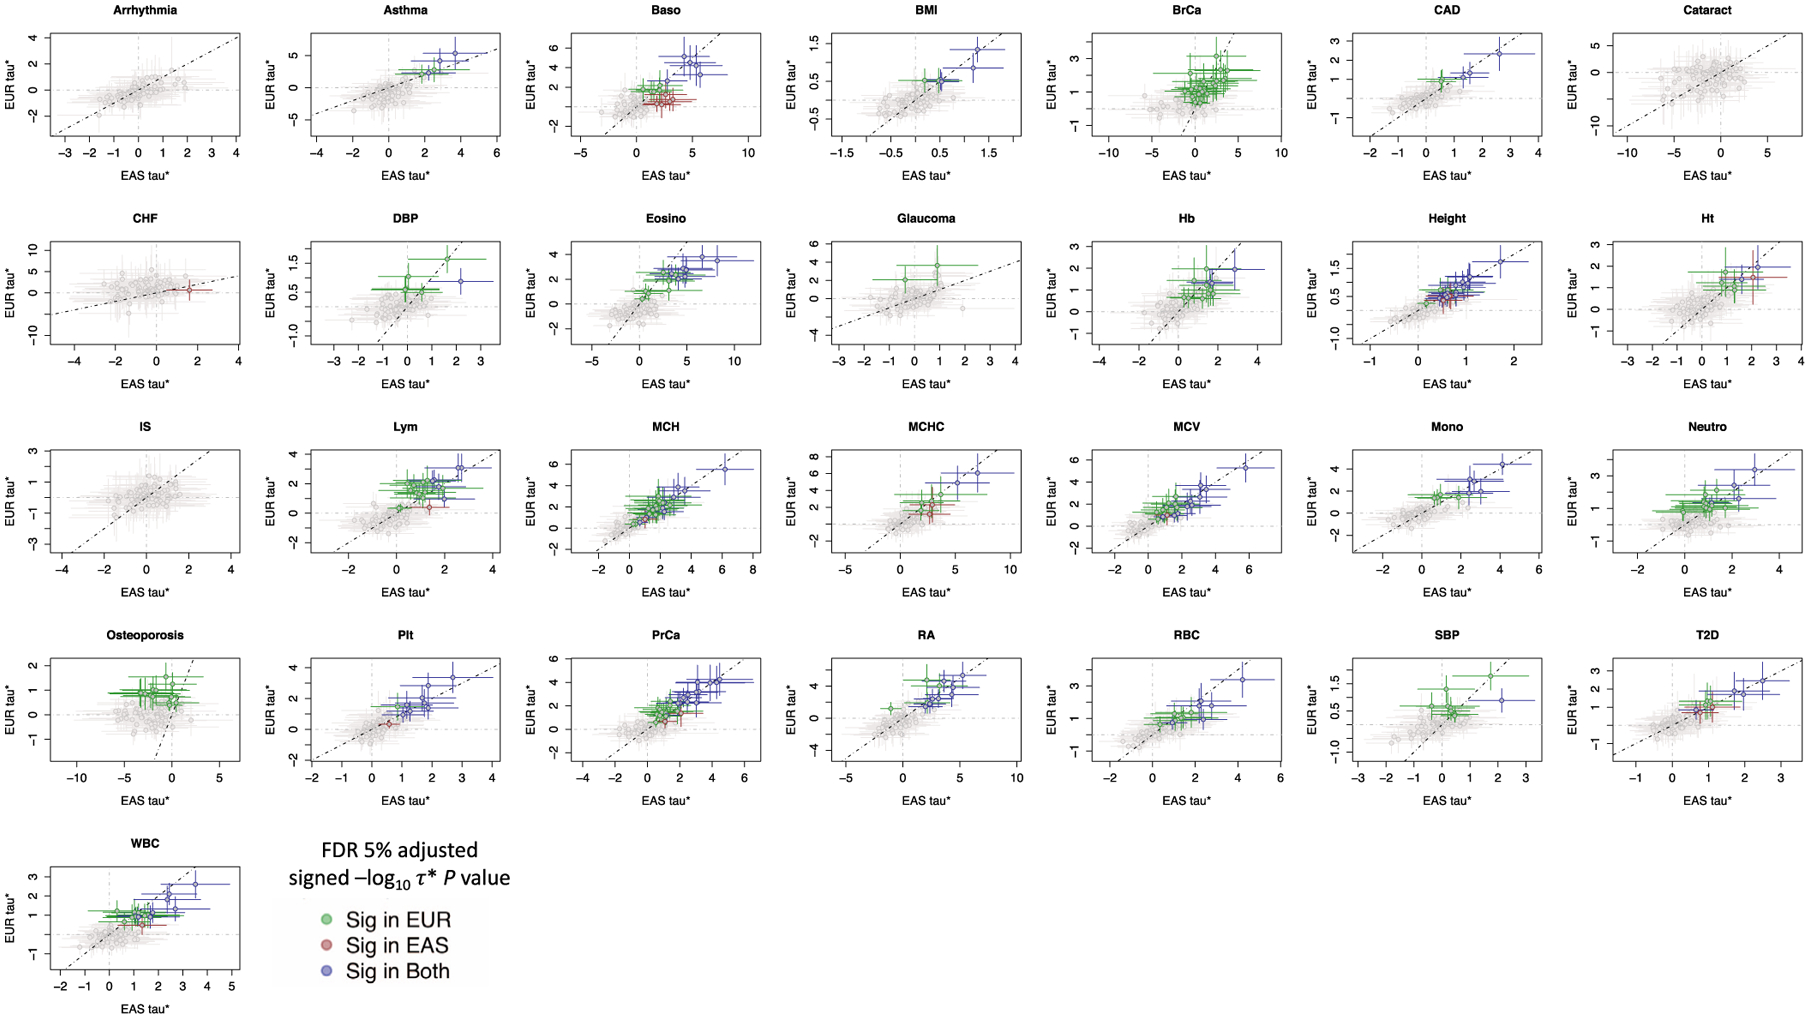
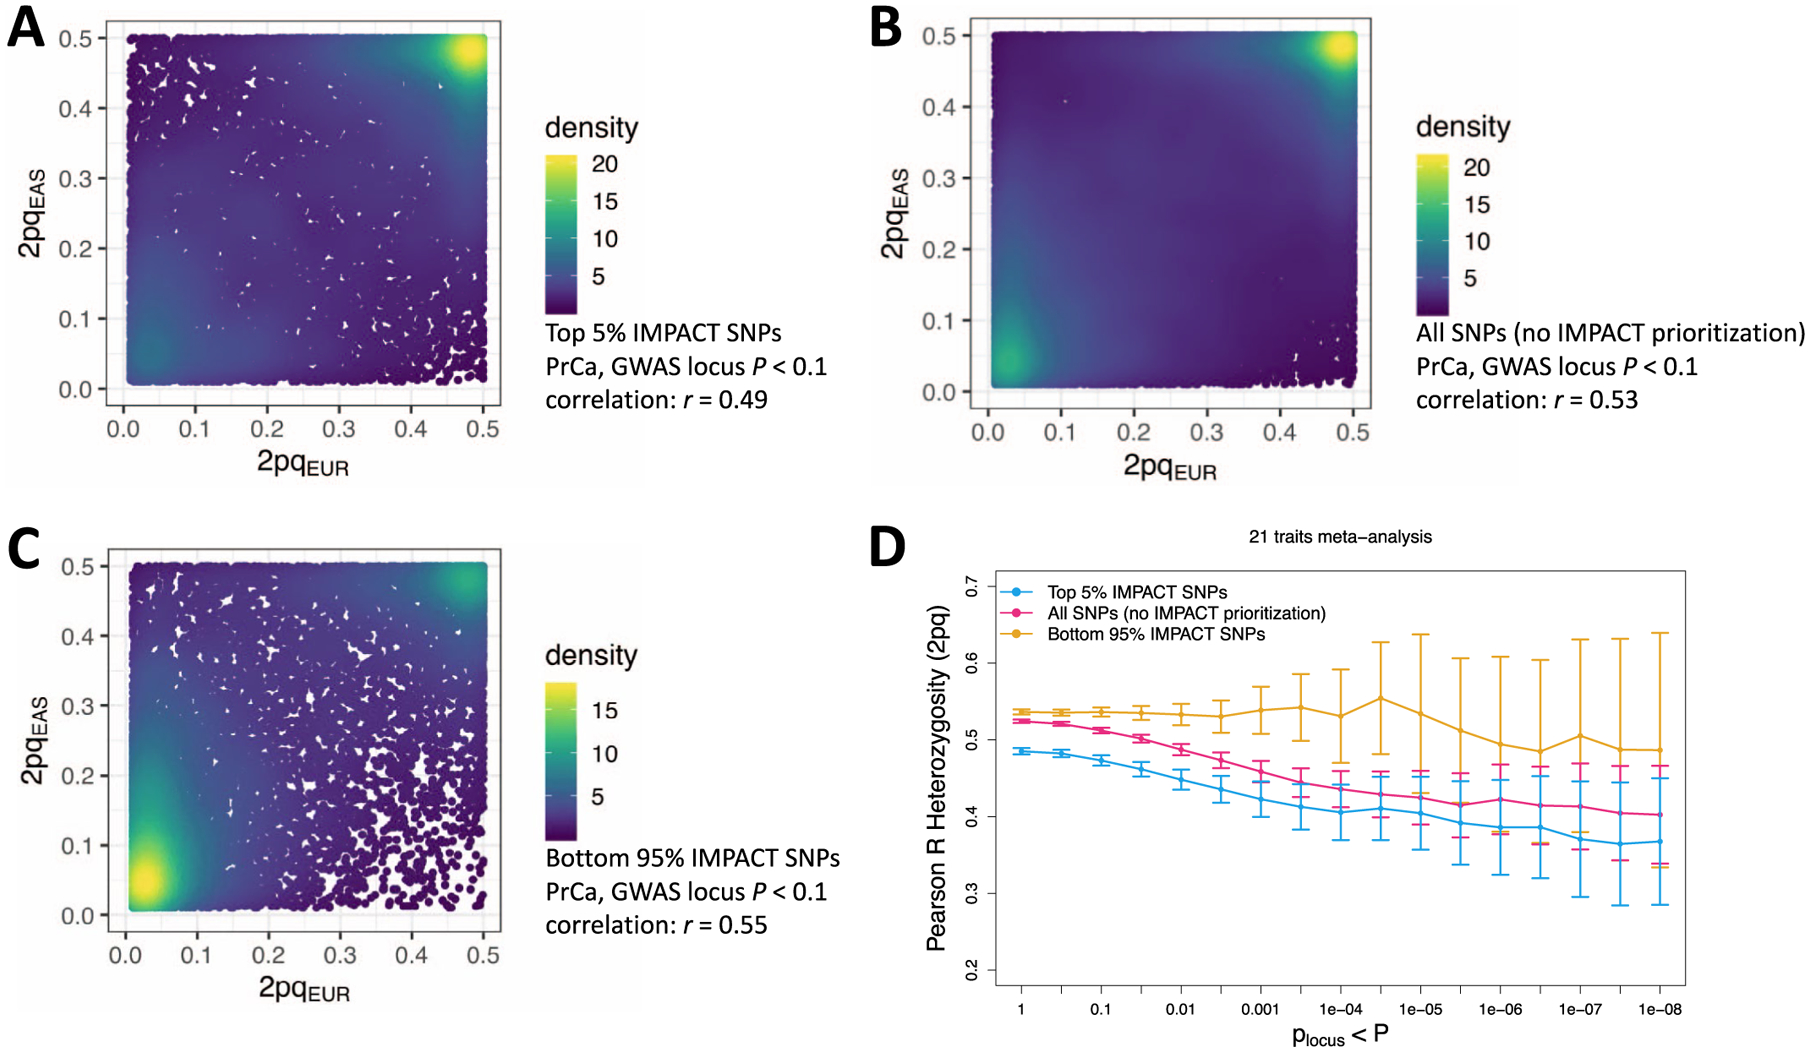
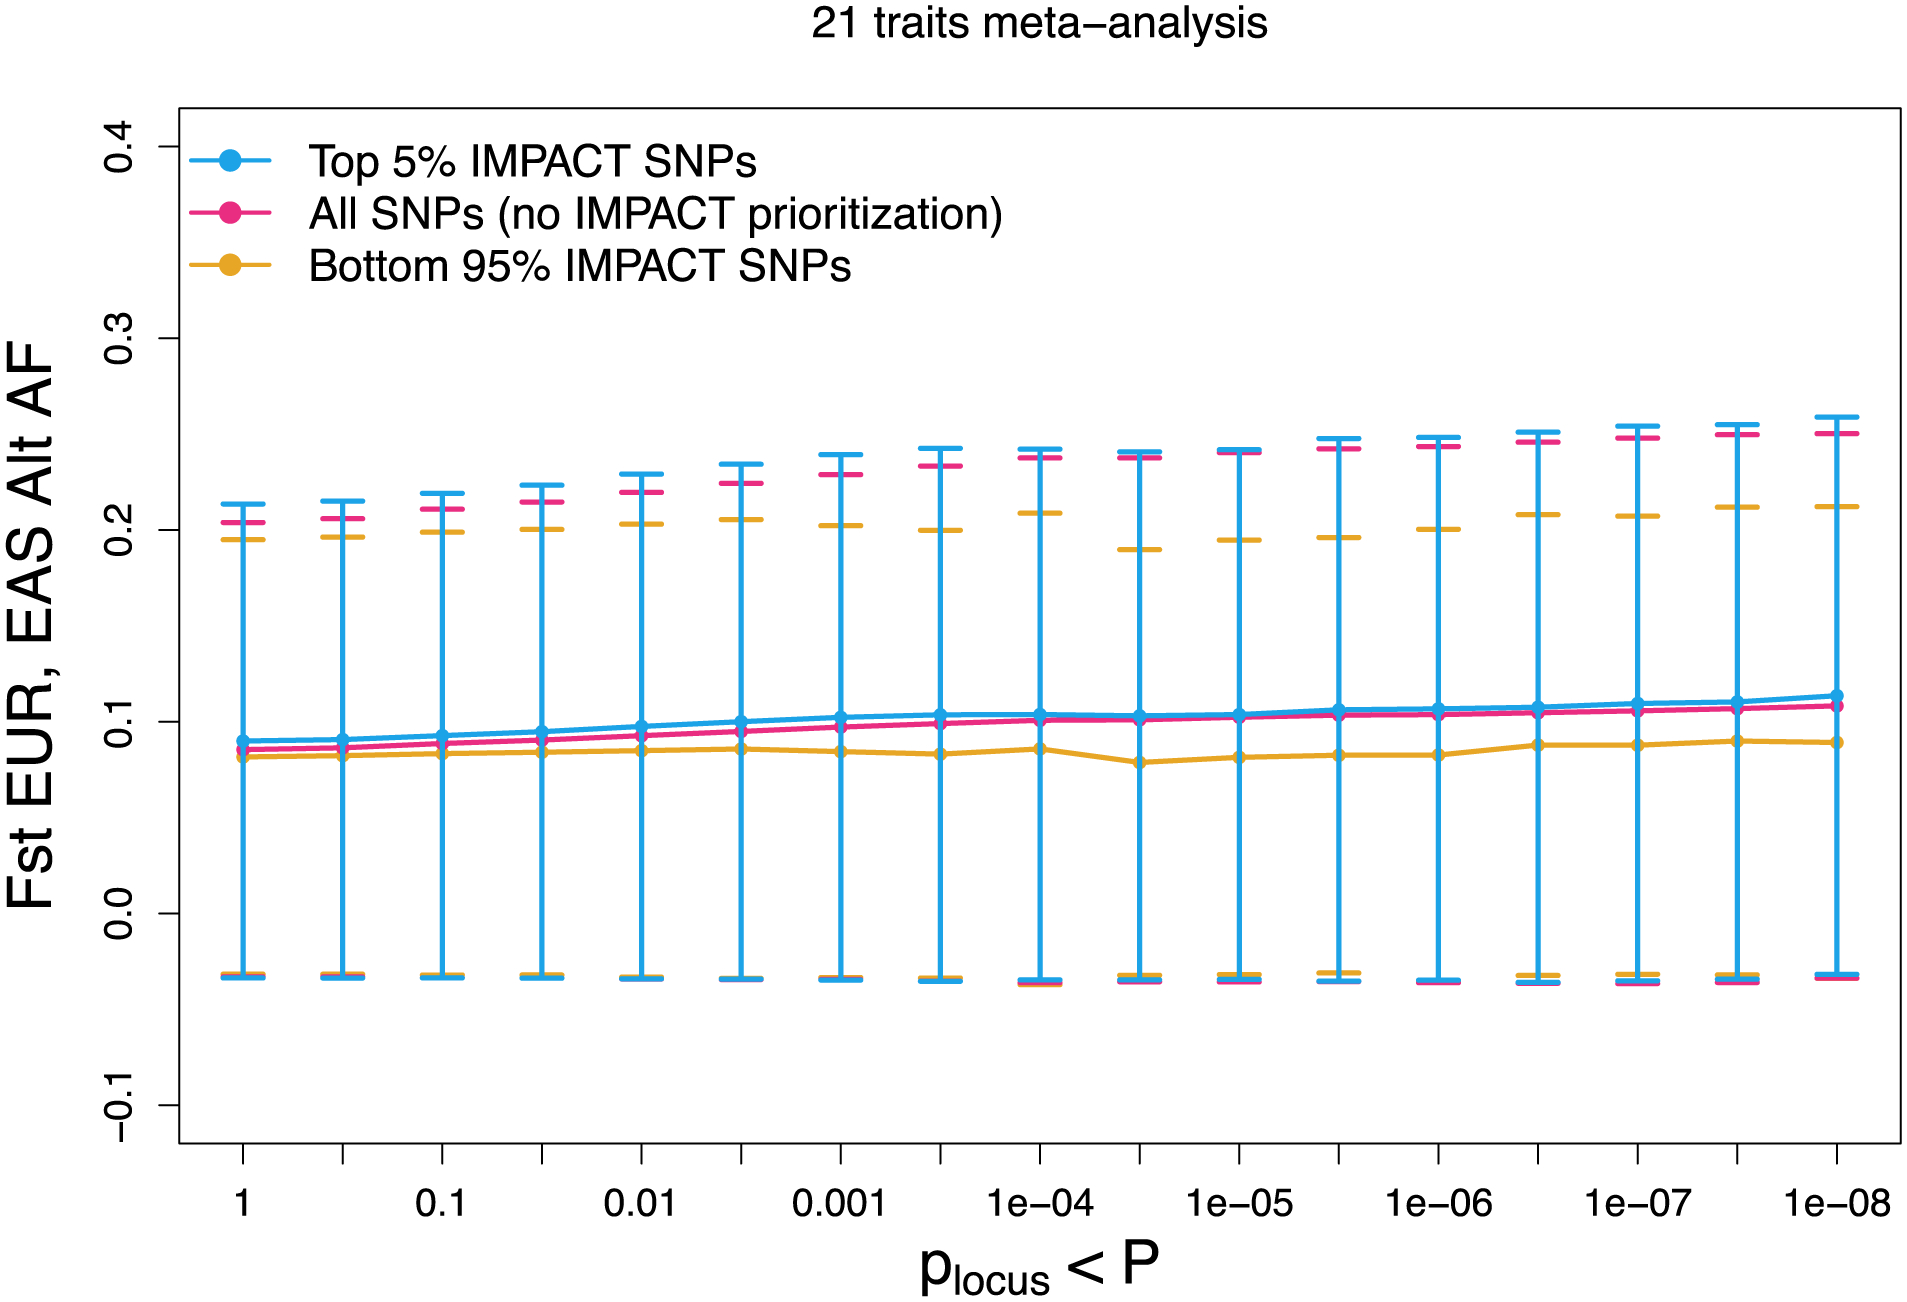
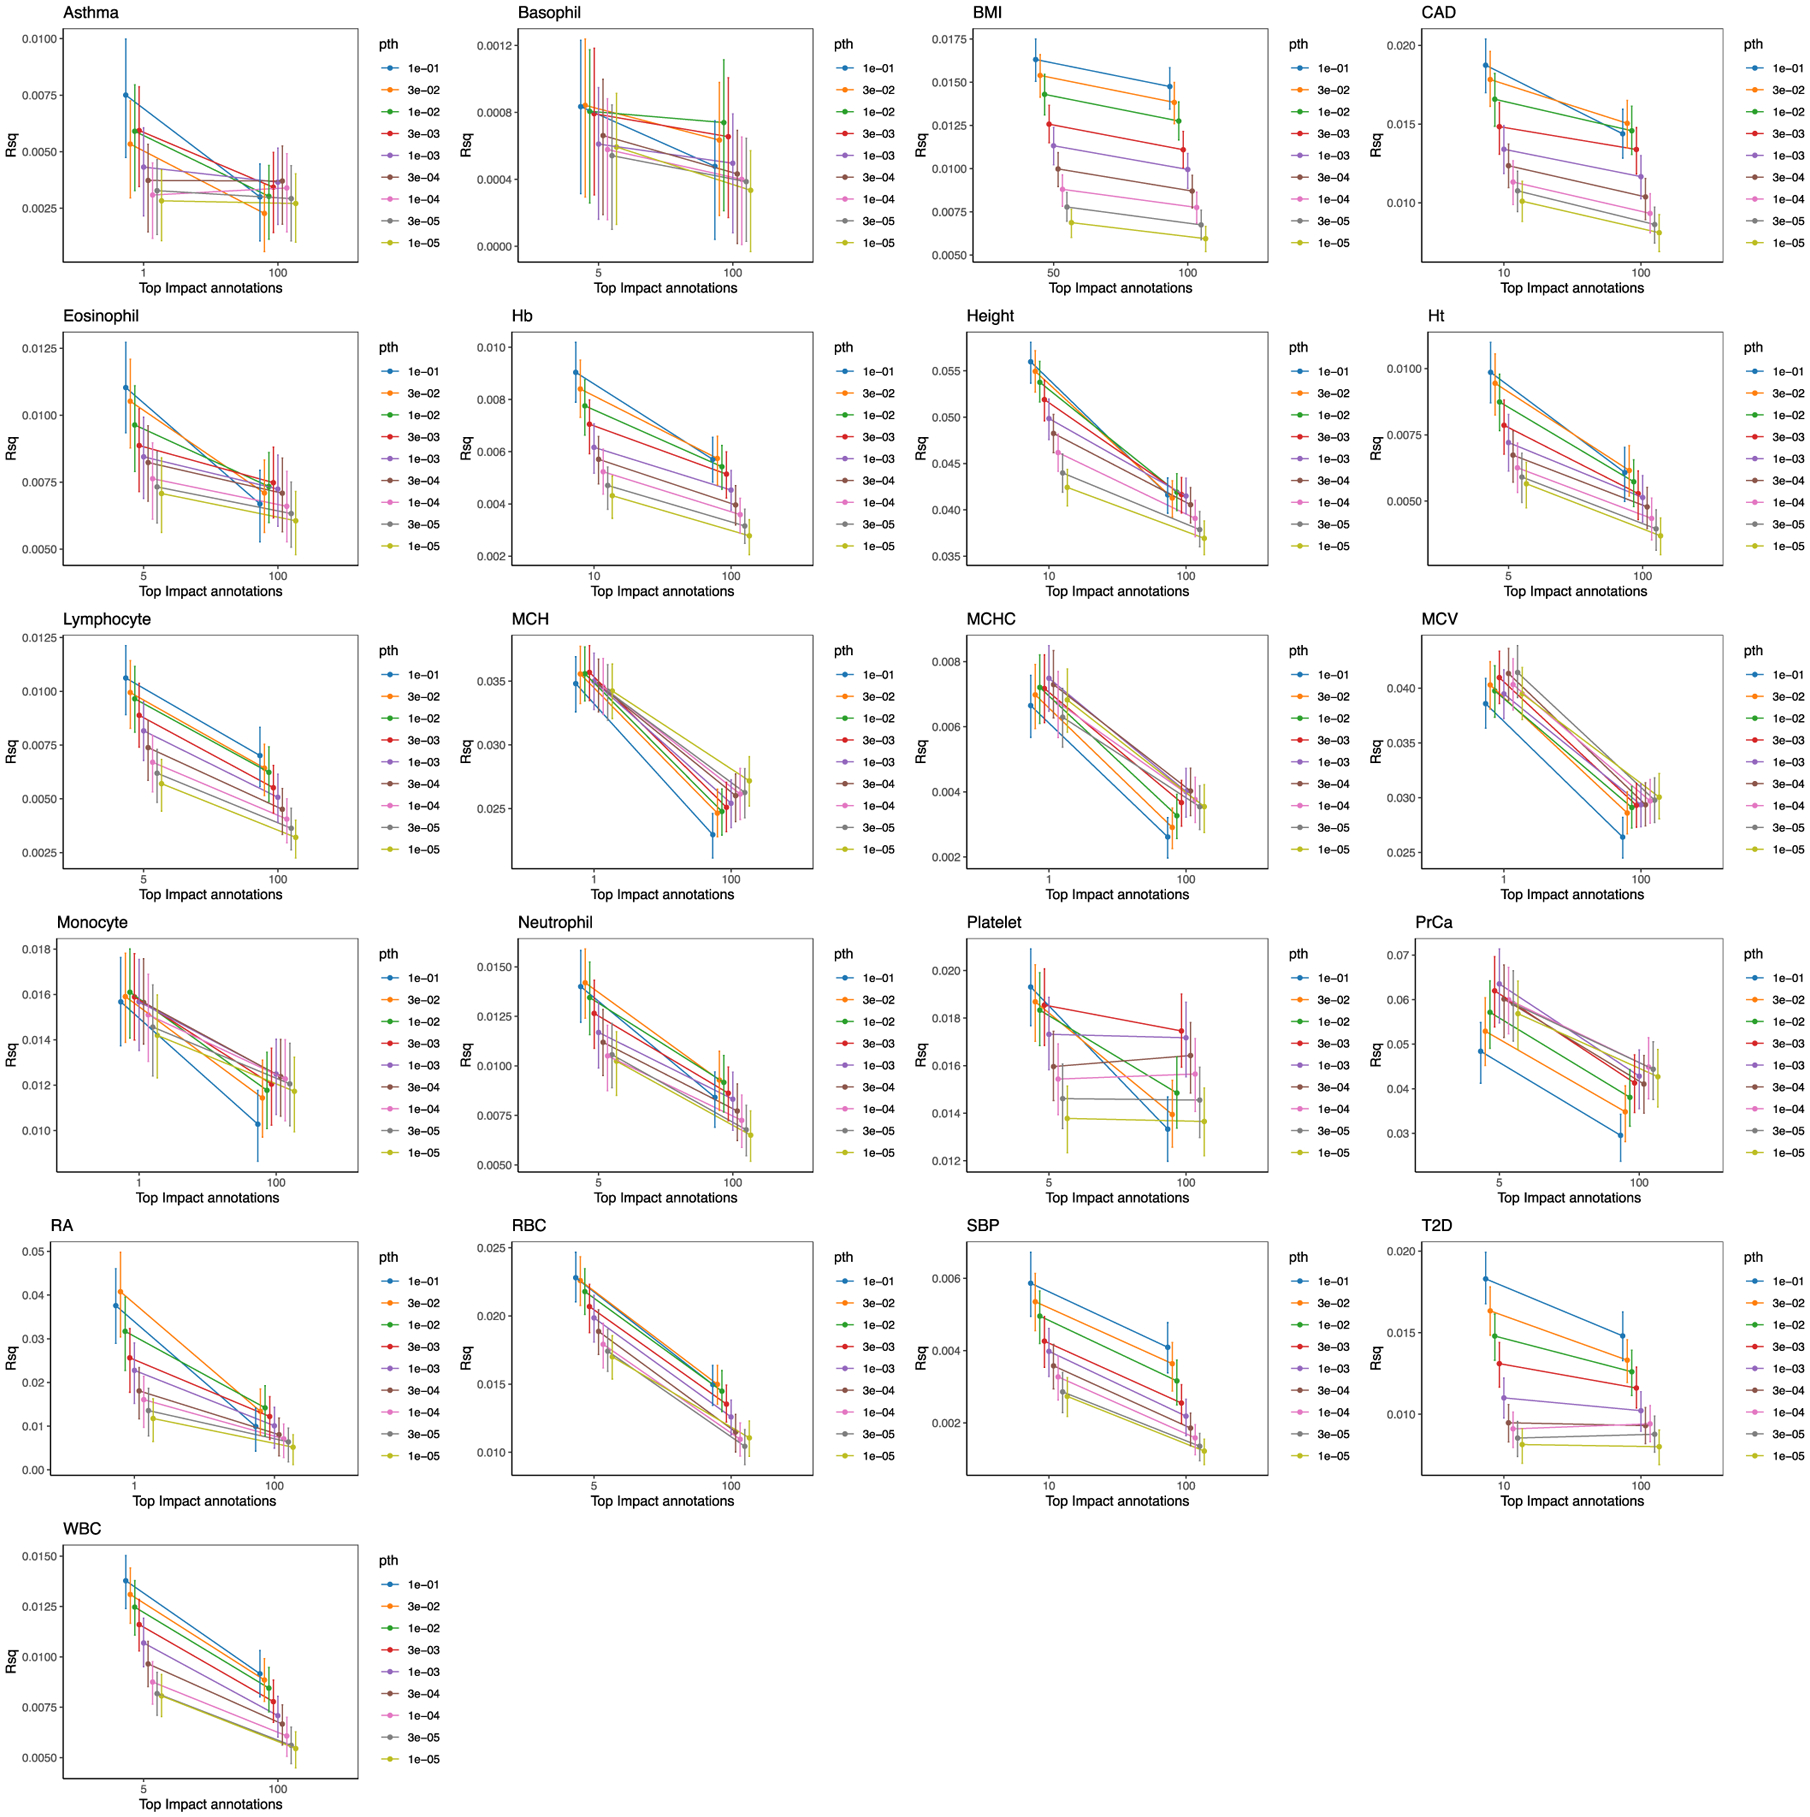
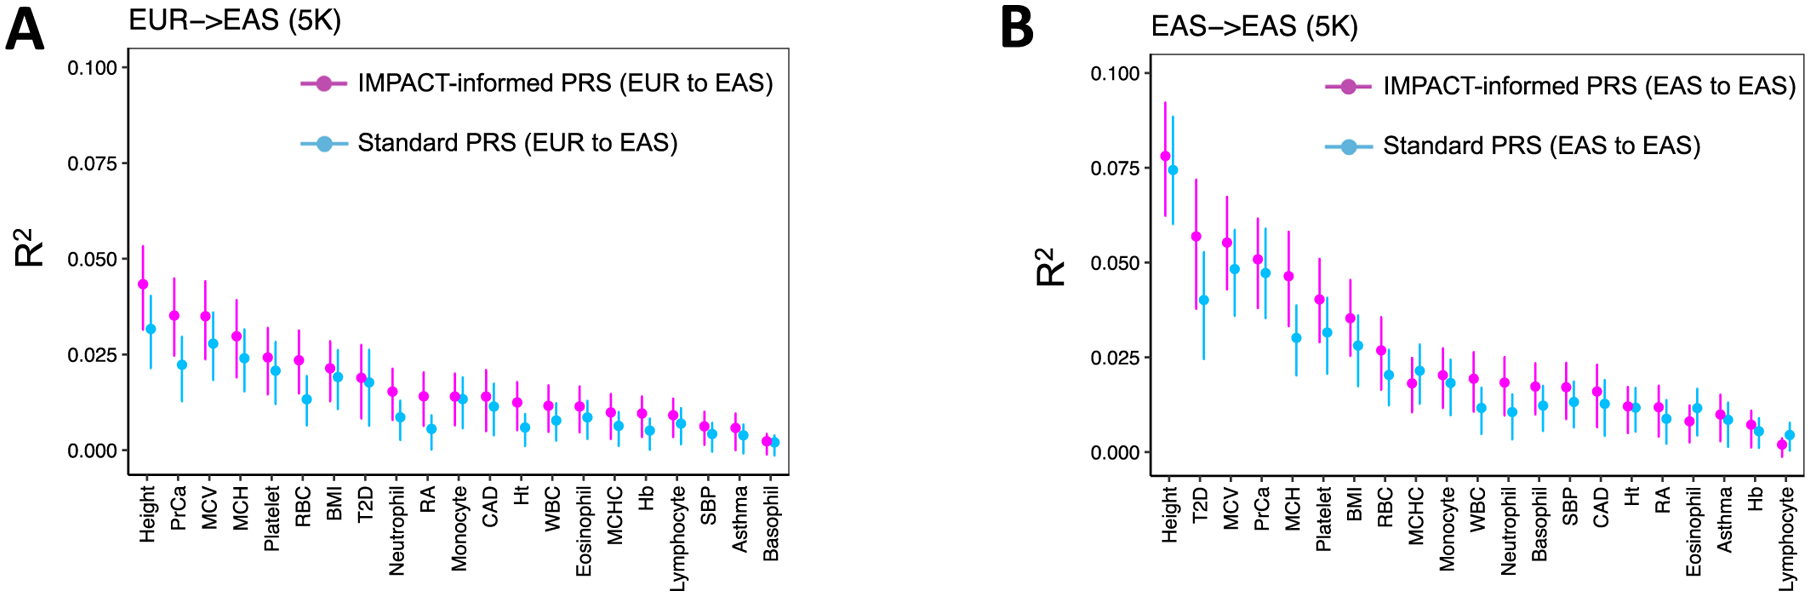
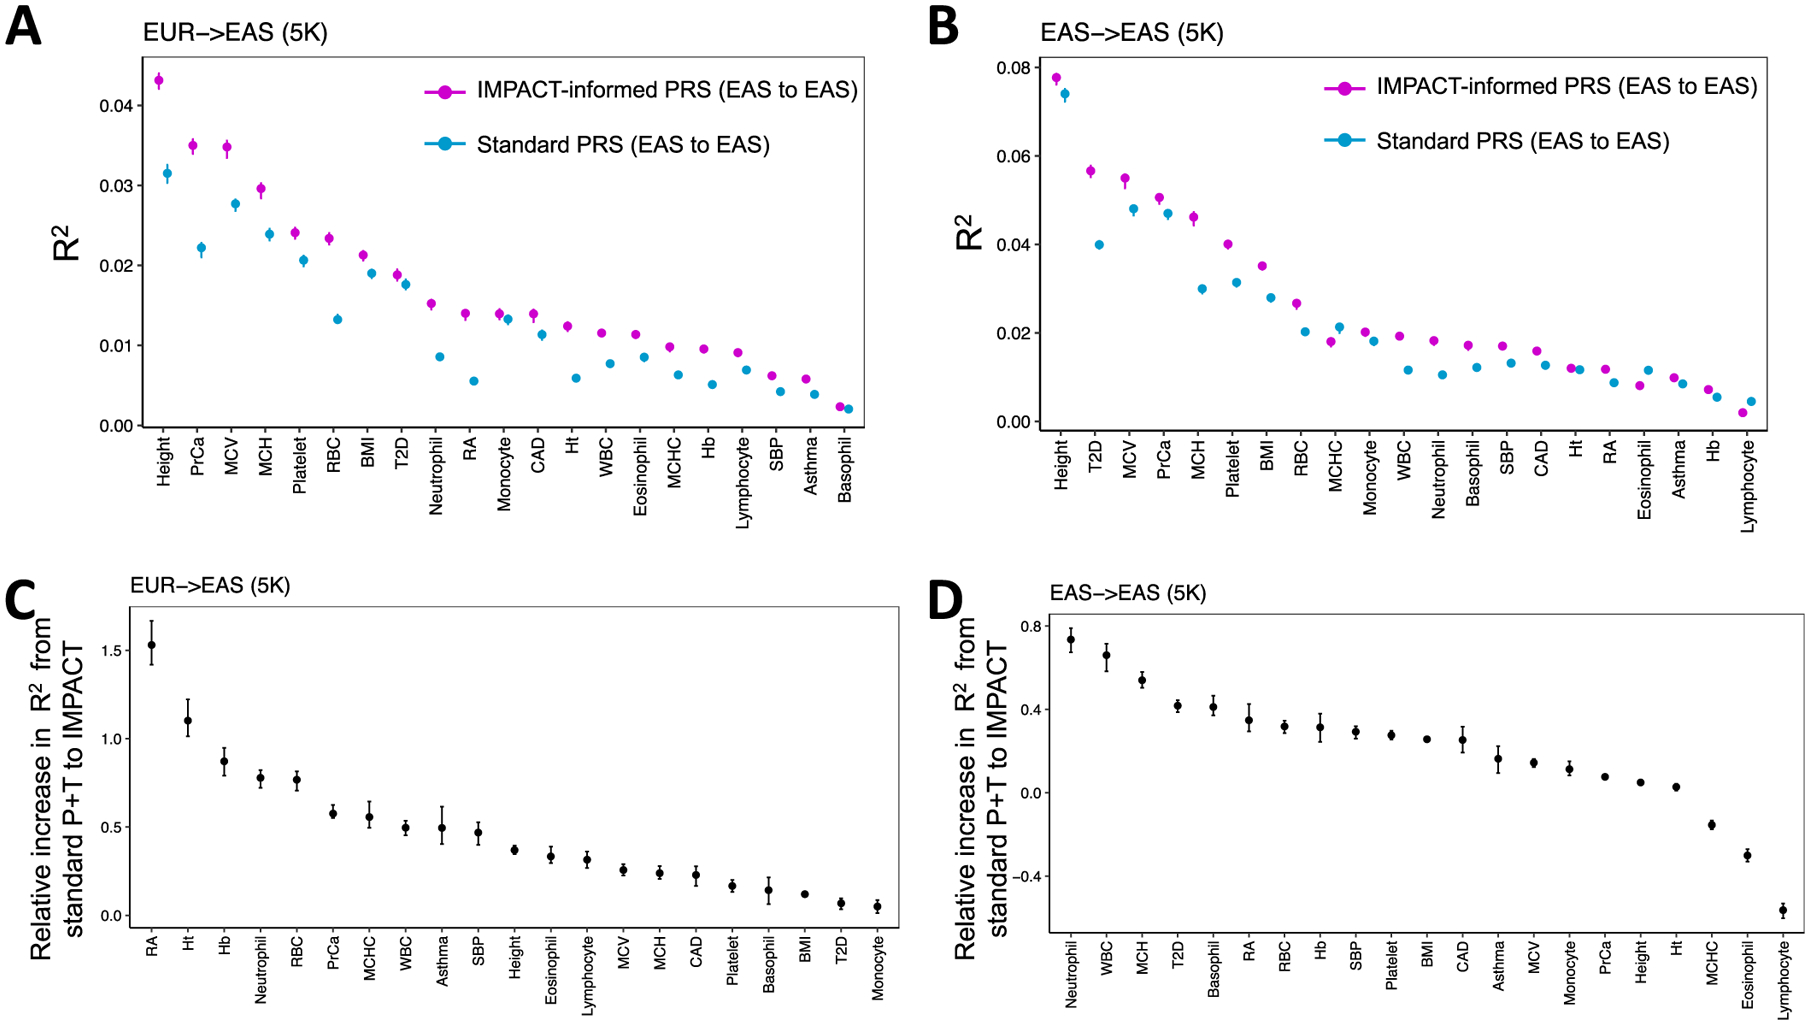
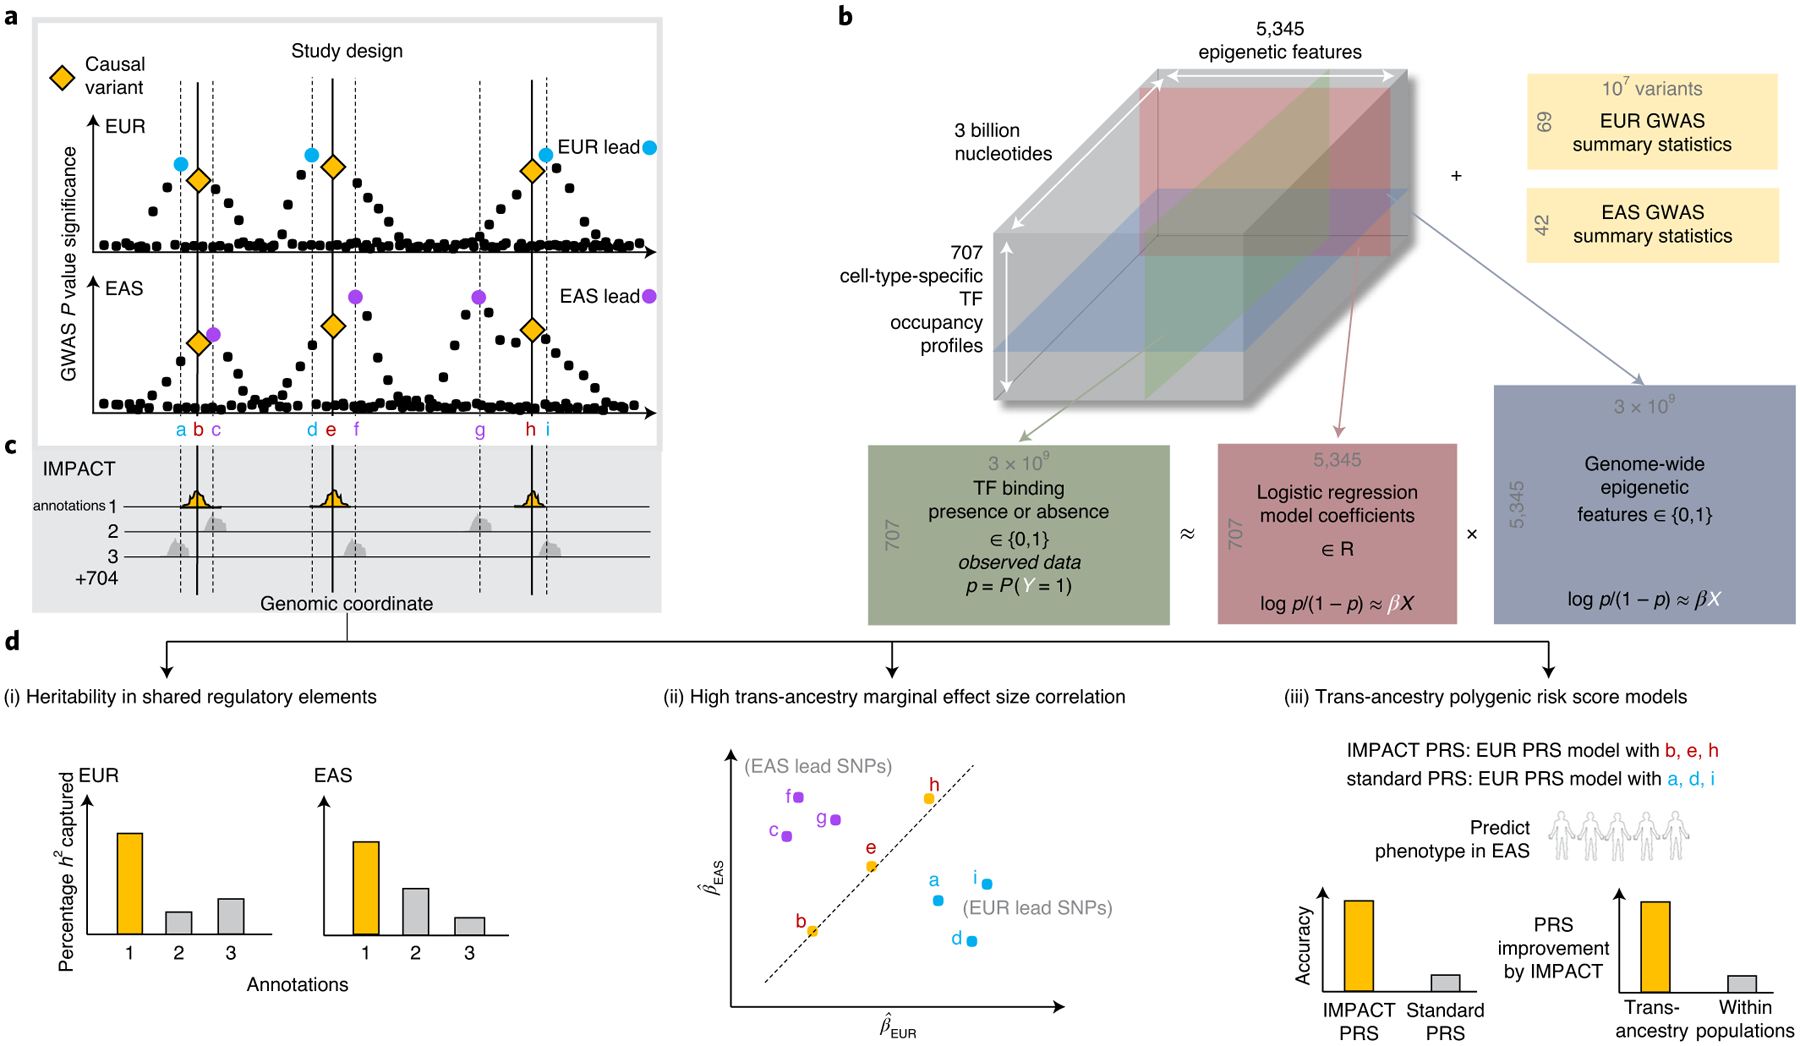
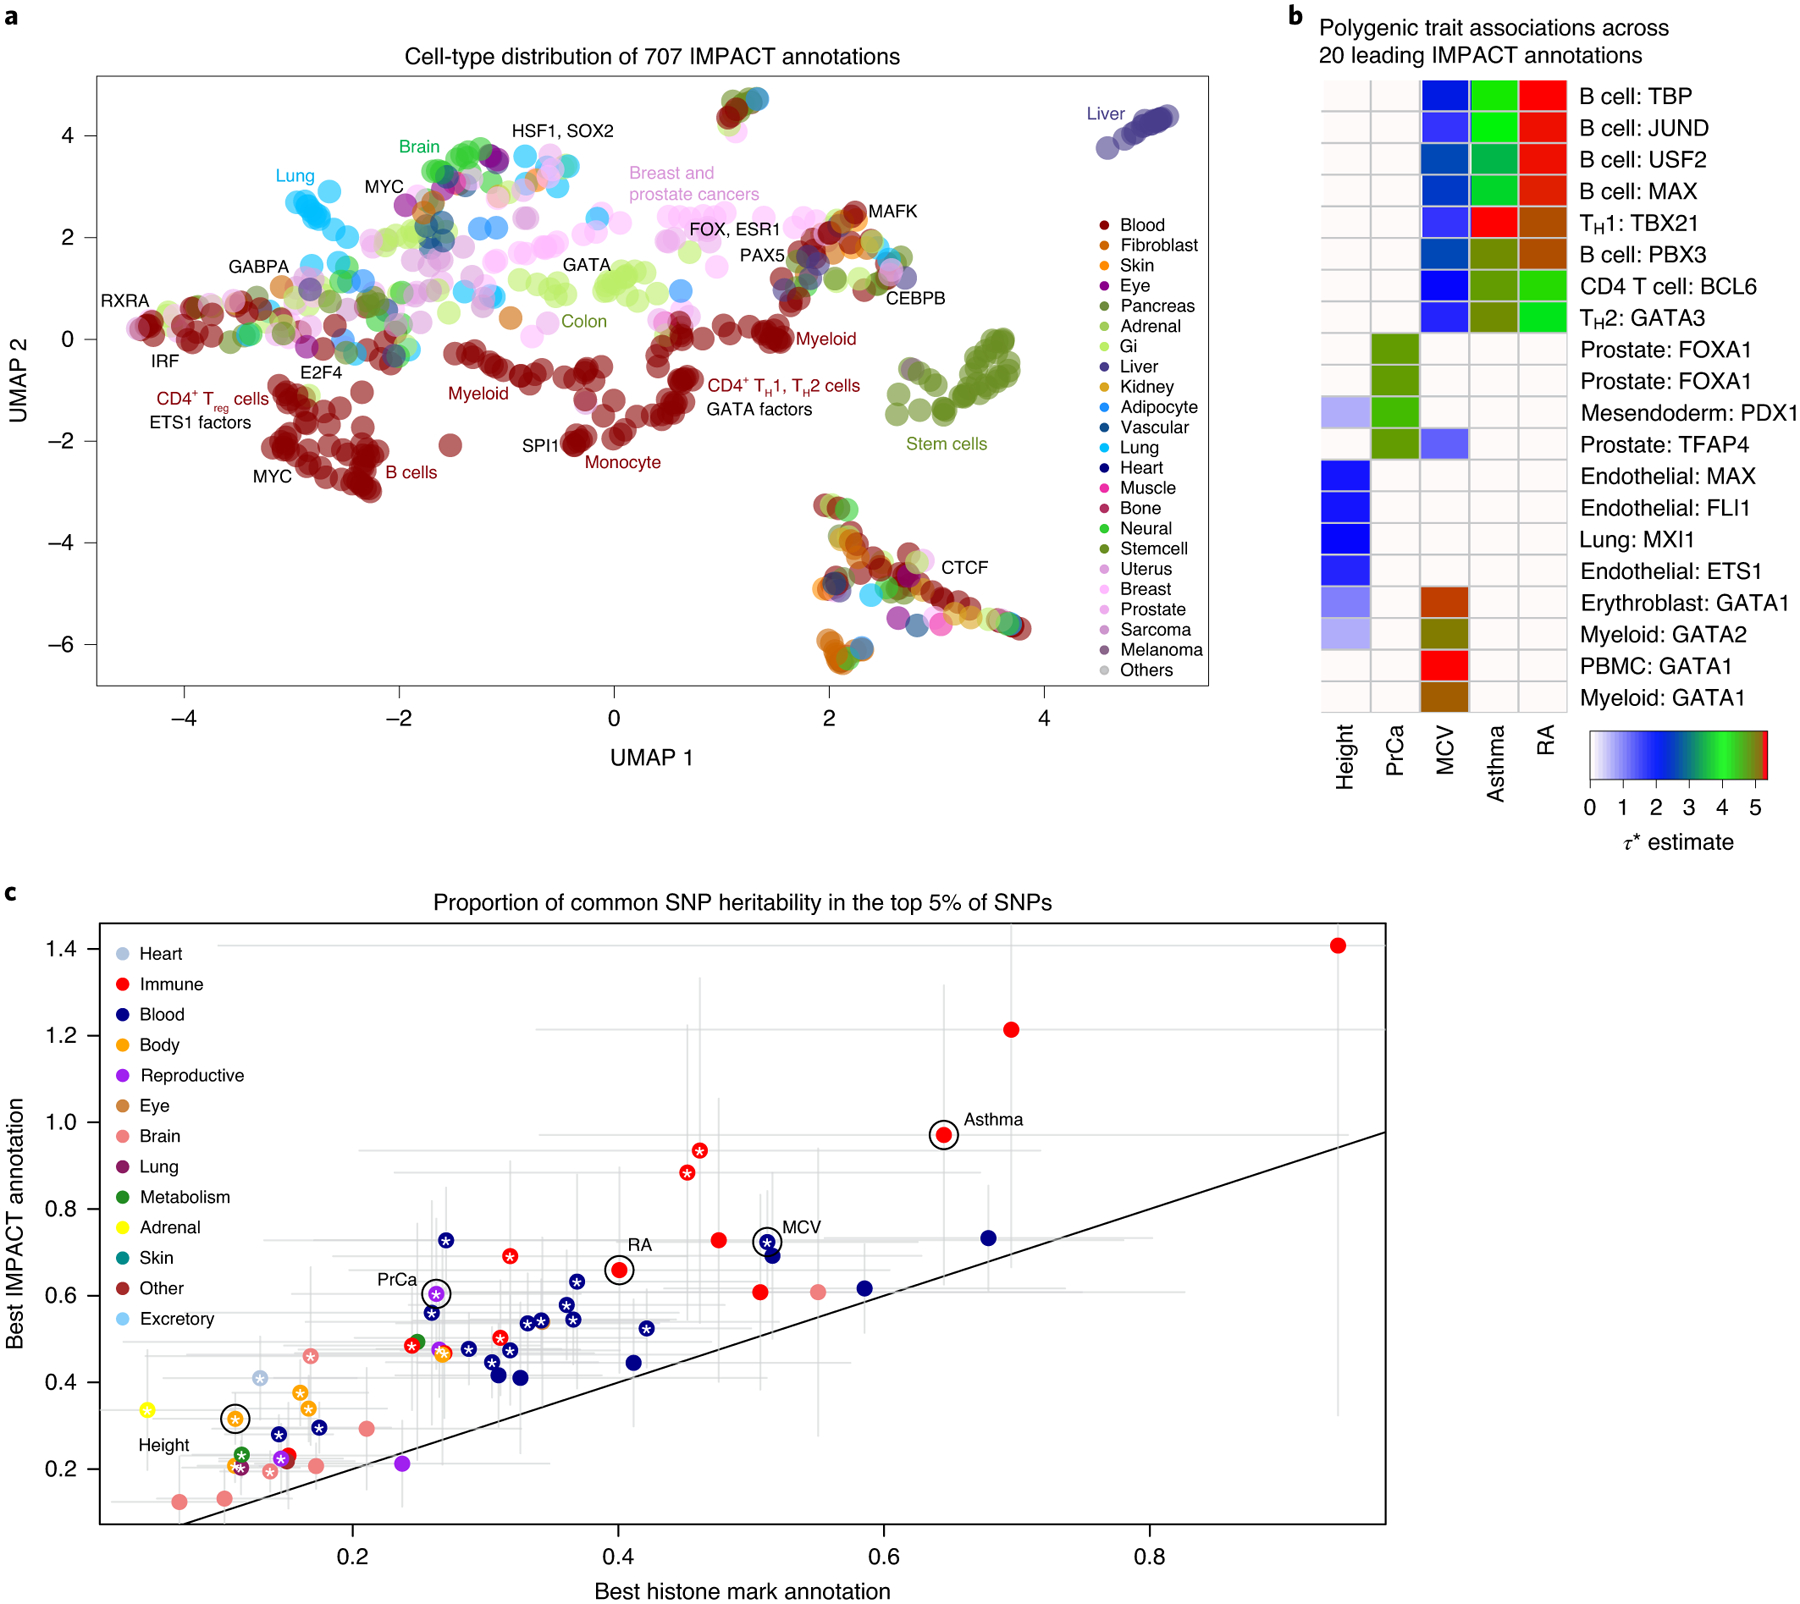
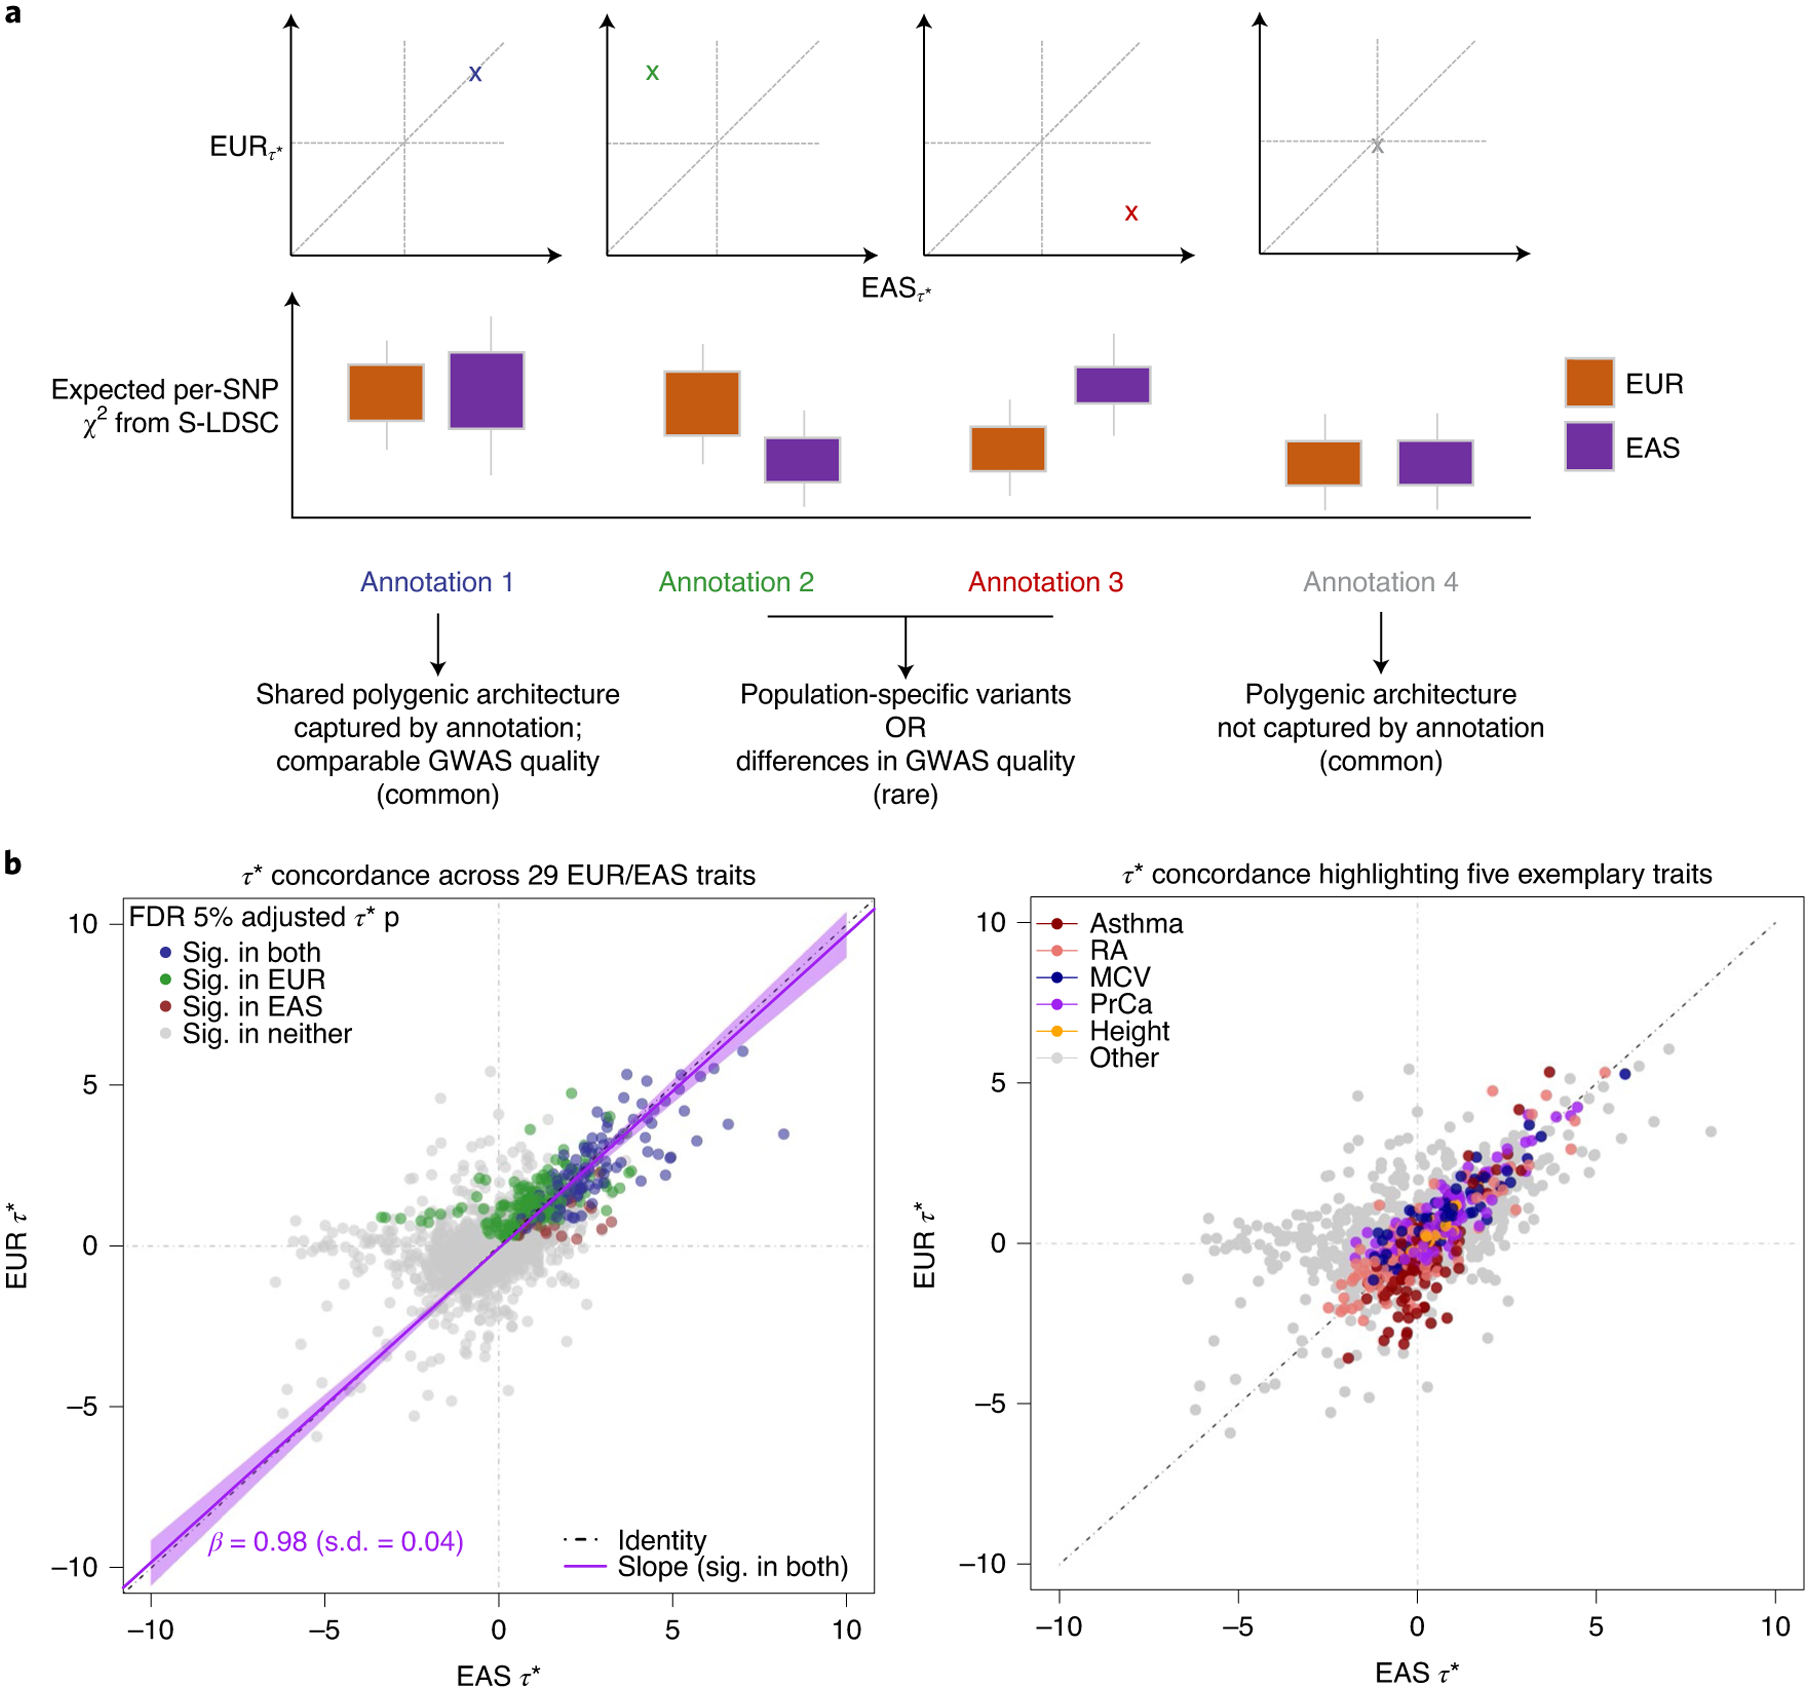
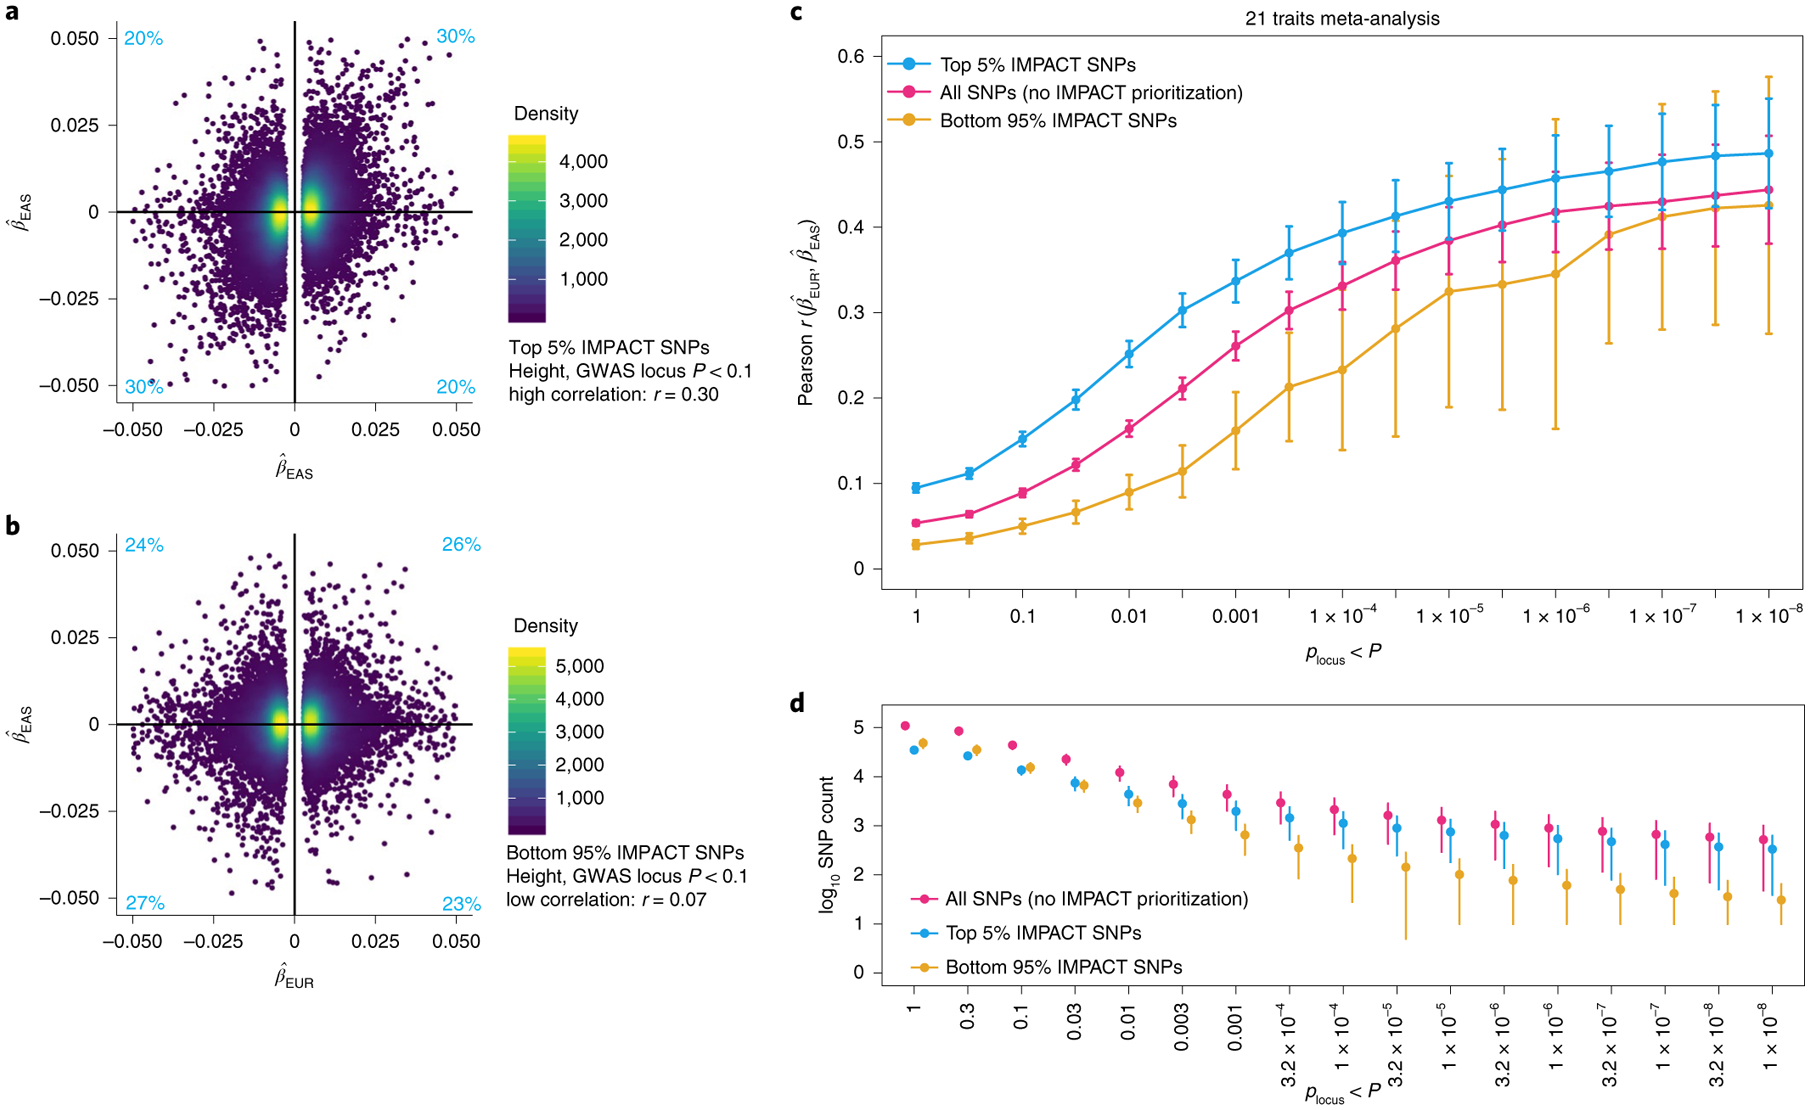
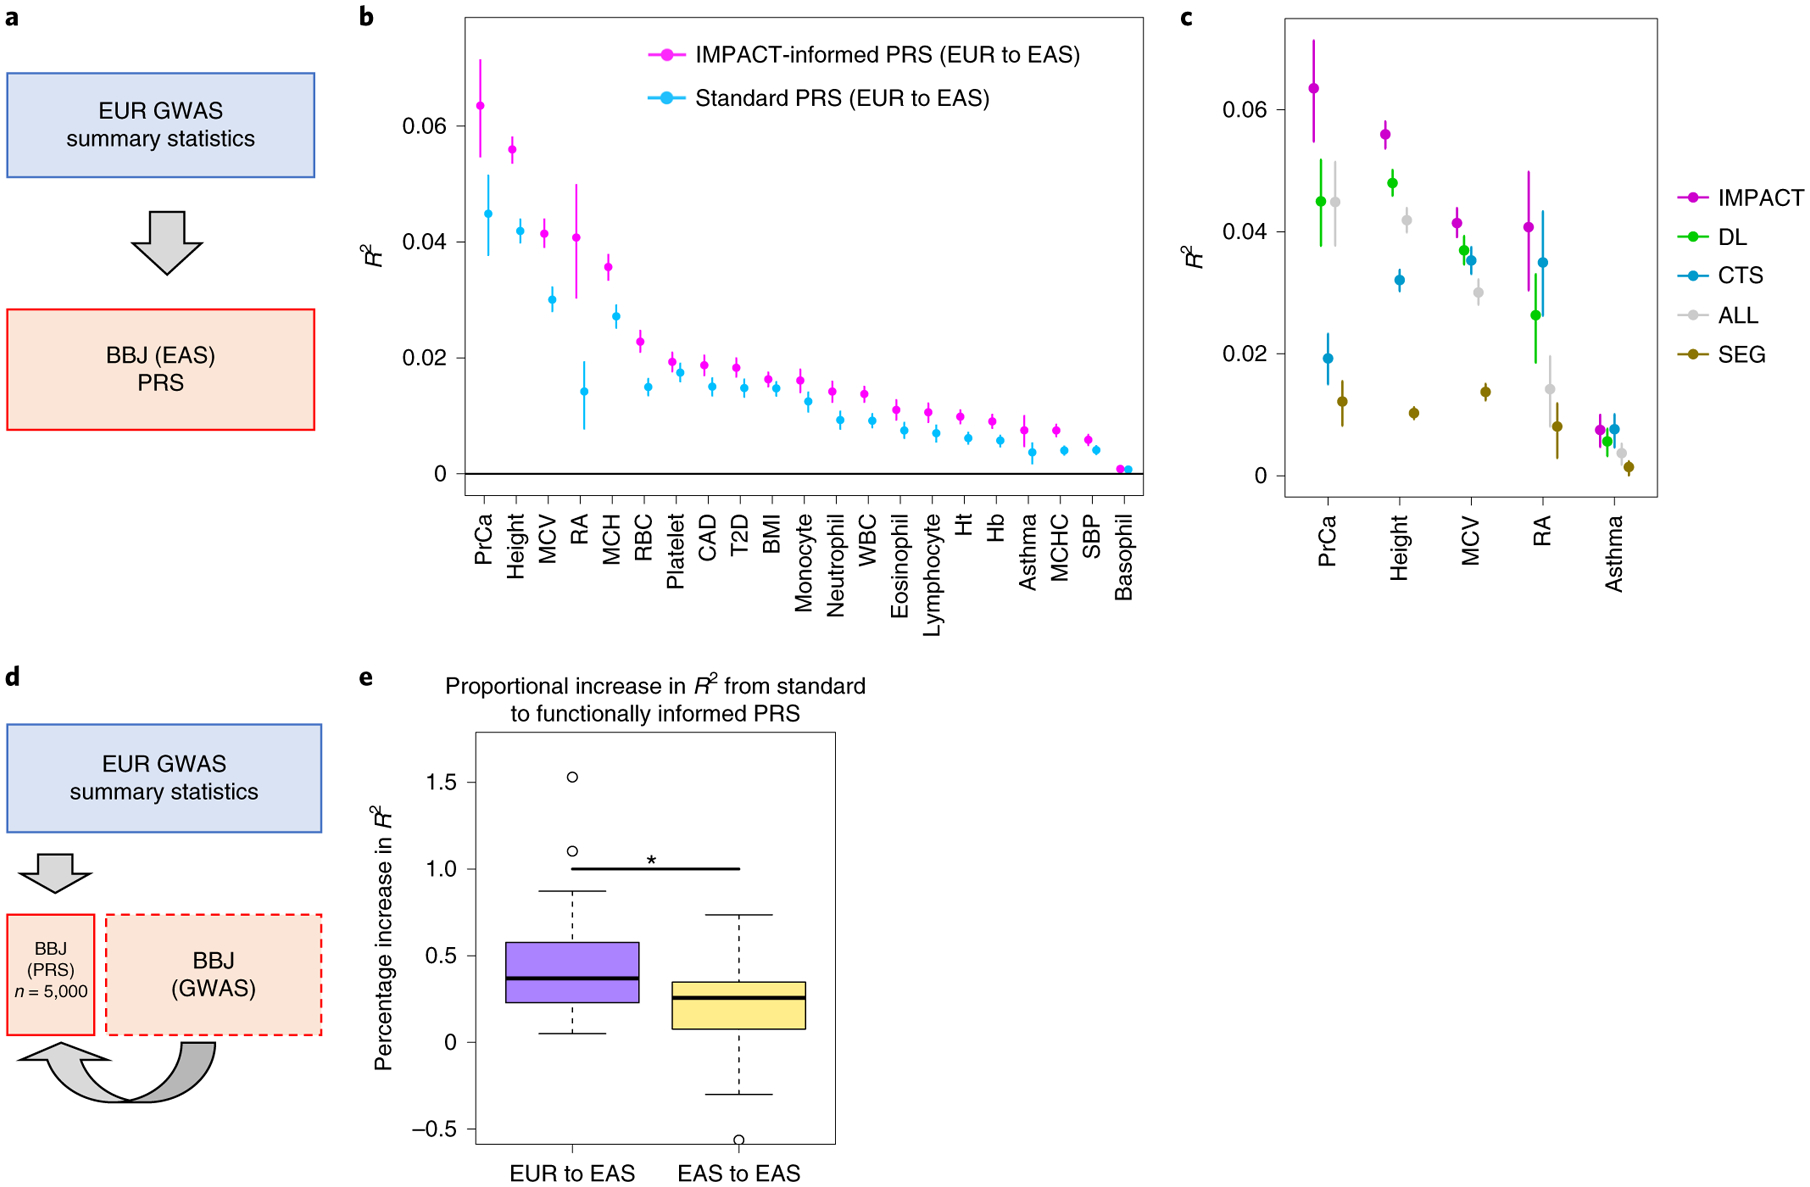
Poor trans-ancestry portability of polygenic risk scores is a consequence of Eurocentric genetic studies and limited knowledge of shared causal variants. Leveraging regulatory annotations may improve portability by prioritizing functional over tagging variants. We constructed a resource of 707 cell-type-specific IMPACT regulatory annotations by aggregating 5,345 epigenetic datasets to predict binding patterns of 142 transcription factors across 245 cell types. We then partitioned the common SNP heritability of 111 genome-wide association study summary statistics of European (average n ≈ 189,000) and East Asian (average n ≈ 157,000) origin. IMPACT annotations captured consistent SNP heritability between populations, suggesting prioritization of shared functional variants. Variant prioritization using IMPACT resulted in increased trans-ancestry portability of polygenic risk scores from Europeans to East Asians across all 21 phenotypes analyzed (49.9% mean relative increase in R2). Our study identifies a crucial role for functional annotations such as IMPACT to improve the trans-ancestry portability of genetic data.


Conflict of interest statement

Competing interests

The authors declare no competing interests.

Figures

Extended Data Fig. 1 |
Extended Data Fig. 1 |. Data collection.
a) TF ChIP-seq collection from NCBI: (left) cell type and TF diversity where ‘Cell Deriv’ indicates number of unique parental cell types, for example GM12878 and GM10847 are both B cell lines, (right) diversity of tissue types. b) (left) Epigenomic and sequence features to be used in IMPACT models, (right) diversity of histone modification ChIP-seq in features. c) Diversity of European (EUR) and East Asian (EAS) GWAS summary statistics across phenotypic categories.
Extended Data Fig. 2 |
Extended Data Fig. 2 |. IMPACT annotation-trait associations.
Significant cell type-phenotype associations across 707 IMPACT regulatory annotations and 111 complex traits and diseases at τ* 5% FDR, color indicates −log10 FDR 5% adjusted P value of τ*. Zooms shows particular cell type categories enriched for polygenic trait associations.
Extended Data Fig. 3 |
Extended Data Fig. 3 |. Proportion of heritability in the top 5% of SNPs.
a) Common SNP heritability captured by the top 5% of SNPs according to the lead cell type association for each EUR GWAS. Lead association determined by largest τ* estimate that is significantly positive. b) Similar for each EAS GWAS. Gray bars indicate the standard error of the heritability estimate. Color represents the category of the complex trait or disease.
Extended Data Fig. 4 |
Extended Data Fig. 4 |. τ* comparison of IMPACT annotations versus cell-type-specific histone marks.
Comparison of two different functional annotations, IMPACT and cell-type-specific histone marks, to capture polygenic heritability assessed by quantifying τ* per-SNP heritability value. Circled are five representative traits used throughout the study: asthma, RA, PrCa, MCV, and height.
Extended Data Fig. 5 |
Extended Data Fig. 5 |. Common per-SNP heritability (τ*) estimate for sets of independent IMPACT cell type annotations across 29 traits.
Dotted line is the identity line, y=x. τ* values with their standard errors are colored green if significantly positive in EUR and not EAS, red if significantly positive in EAS but not in EUR, green if significantly positive in both EUR and EAS, and gray if not significantly positive in either population.
Extended Data Fig. 6 |
Extended Data Fig. 6 |. Population concordance of heterozygosity (2pq) among variants prioritized by IMPACT compared to standard P+T.
a) Heterozygosity of variants from genome-wide EUR and EAS PrCa summary statistics in the top 5% of the lead IMPACT annotation for EUR PrCa. b) Heterozygosity of variants from genome-wide EUR and EAS PrCa summary statistics using standard P+T. c) Heterozygosity of variants from genome-wide EUR and EAS PrCa summary statistics in the bottom 95% of the lead IMPACT annotation for PrCa; mutually exclusive with SNPs in A). d) Meta-analysis of heterozygosity correlations between populations across 21 traits shared between EUR and EAS cohorts over 17 GWAS P value thresholds (with reference to the EUR GWAS).
Extended Data Fig. 7 |
Extended Data Fig. 7 |. Population divergence, measured by Fst, among variants prioritized by IMPACT compared to standard P+T.
Larger values indicate a reduction in heterozygosity. Meta-analysis of Fst between EUR and EAS populations across 21 traits shared between EUR and EAS cohorts over 17 GWAS P value thresholds (with reference to the EUR GWAS).
Extended Data Fig. 8 |
Extended Data Fig. 8 |. EuR PRS model evaluated on EAS individuals from BBJ.
For each trait, we evaluate the predictive value of standard PRS models (top 100% of IMPACT SNPs) and functionally informed PRS models (using a subset of SNPs prioritized by IMPACT). The top 100% of SNPs according to IMPACT represents the PRS model with no functional annotation information. Intervals represent the 95% CI around the R2 estimate. For quantitative traits, R2 represents the proportion of variance captured by the linear PRS model. For case–control traits, R2 represents the liability scale R2 from the logistic regression PRS model.
Extended Data Fig. 9 |
Extended Data Fig. 9 |. Trans-ethnic and within-population PRS models evaluated on the same 5,000 BBJ individuals.
a) Phenotypic variance (R2) in 5,000 BBJ individuals explained by IMPACT-informed PRS-EUR (light pink) and standard PRS-EUR (light blue). b) Phenotypic variance (R2) in 5,000 BBJ individuals explained by IMPACT-informed PRS-EAS (light pink) and standard PRS-EAS (light blue). Error bars indicate 95% CI calculated via 1,000 bootstraps.
Extended Data Fig. 10 |
Extended Data Fig. 10 |. PRS accuracy is robust to loci of large effect.
We recomputed confidence intervals around the R2 estimates (panels A and B) and around the relative improvements in R2 estimates of IMPACT PRS over standard P+T PRS (panels C and D) via block jackknife across the genome, using 200 adjacent equally-sized bins and iteratively removing variants within each bin and computing the R2. a) Trans-ethnic analysis of EUR PRS to BBJ individuals. b) Within-population analysis of EAS PRS to BBJ individuals. Error bars indicate 95% confidence interval (CI) around the R2 estimates. c) Trans-ethnic analysis of EUR PRS to BBJ individuals, relative improvement in R2 estimates defined as (IMPACT R2 - standard P+T R2)/standard P+T R2. d) Within-population analysis of EAS PRS to BBJ individuals, relative improvement in R2 estimates defined as (IMPACT R2 - standard P+T R2)/standard P+T R2.
Fig. 1 |
Fig. 1 |. Study design to identify regulatory annotations that prioritize regulatory variants in a multi-ancestry setting.
a, Population-specific LD confounding and subsequent inflation of GWAS associations complicate the interpretation of summary statistics and transferability to other populations; functional data may help improve trans-ancestry genetic portability. b, Prism of functional data in IMPACT model: 707 genome-wide TF occupancy profiles (green), 5,345 genome-wide epigenomic feature profiles (blue), and fitted weights for these features (pink) to predict TF binding by logistic regression. Using IMPACT annotations, we investigate 111 GWAS summary datasets (yellow) of EUR and EAS origin. p, probability of site-specific TF binding. c, Compendium of 707 genome-wide cell-type-specific IMPACT regulatory annotations. d, Annotations that prioritize common regulatory variants must capture large proportions of heritability in both populations (i), account for consistent marginal effect size estimations between populations (ii) and improve the trans-ancestry application of PRS (iii). h2 denotes the trait heritability, or genetic variation, causally explained by common SNPs. In (ii), the x and y axes show the the marginal effect sizes observed in EUR and EAS GWAS, respectively.
Fig. 2 |
Fig. 2 |. IMPACT annotates relevant cell-type-specific regulatory elements.
a, Low-dimensional embedding and clustering of 707 IMPACT annotations using uniform manifold approximation projection (UMAP). Annotations colored by cell-type category; TF groups indicated where applicable. b, Biologically distinct regulatory modules revealed by cell type–trait associations with significantly nonzero τ*. Shown here are the 5 representative EUR complex traits and the 4 leading IMPACT annotations for each, resulting in 20 IMPACT annotations highlighted from 707 in total. Color indicates τ* value. c, Lead IMPACT annotations capture more heritability than lead cell-type-specific histone modifications across 60 of 69 EUR summary statistics for which a lead IMPACT annotation was identified. The asterisk indicates the proportion-of-heritability-estimate difference of means P < 0.05. Gray segments indicate the 95% CI around the proportion-of-heritability estimate.
Fig. 3 |
Fig. 3 |. Trans-ancestry concordance of regulatory elements defined by IMPACT.
a, Illustrative concept of concordance versus discordance of τ* between populations. Concordance implies a similar distribution of causal variants and effects captured by the same annotation. The implications of discordant τ* are not as straightforward. b, Common per-SNP heritability (τ*) estimate for sets of independent IMPACT annotations across 29 traits shared between EUR and EAS. Left: color indicates τ* significance (sig.; τ* greater than 0 at 5% FDR). Line of best fit through annotations significant in both populations (dark purple line, 95% CI in light purple). Black dotted line is the identity line, y = x. Right: color indicates association to one of five exemplary traits.
Fig. 4 |
Fig. 4 |. Mechanism by which IMPACT prioritization of shared regulatory variants might improve trans-ancestry PRS performance.
a, Estimated effect sizes of variants from genome-wide EUR and EAS height summary statistics in the top 5% of the lead IMPACT annotation for EUR height. Proportions of variants in each quadrant indicated in light blue. b, Estimated effect sizes from genome-wide EUR and EAS height summary statistics of variants in the bottom 95% of the same lead IMPACT annotation for height; mutually exclusive with SNPs in a. c, Meta-analysis of trans-ancestry marginal effect size correlations between populations across 21 traits shared between EUR and EAS cohorts over 17 GWAS P value thresholds (with reference to the EUR GWAS). Vertical bars indicate the 95% CI around the Pearson r estimate. d, Number of SNPs (log10 scale) at each P value threshold for each partition of the genome corresponding to c. Error bars indicate 1 s.d. above and below the mean.
Fig. 5 |
Fig. 5 |. Identifying shared regulatory variants with IMPACT annotations to improve the trans-ancestry portability of PRS.
a, Study design applying EUR summary statistics-based PRS models to all individuals in the BBJ cohort. b, Phenotypic variance (R2) of BBJ individuals explained by EUR PRS using two methods: functionally informed PRS with IMPACT (pink) and standard PRS (blue). Error bars indicate 95% CI calculated via 1,000 bootstraps. c, Phenotypic variance (R2) of BBJ individuals across five exemplary traits explained by EUR IMPACT annotations relative to lead deep learning annotations (DL), cell-type-specific histone modification annotations (CTS) and lead cell-type-specifically expressed gene sets (SEG). Error bars indicate 95% CI calculated via 1,000 bootstraps. d, Study design to compare trans-ancestry (EUR to EAS) to within-population (EAS to EAS) improvement afforded by functionally informed PRS models. For each trait, 5,000 randomly selected individuals from BBJ were designated as PRS samples. The remaining BBJ individuals were used for GWAS to derive EAS summary statistics–based PRS; no shared individuals between GWAS samples and PRS samples. e, Improvement from standard PRS to functionally informed PRS compared between trans-ancestry (EUR to EAS) and within-population models (EAS to EAS) using the study design in d. In the boxplots, the center line indicates the median value; box limits indicate the upper (third) and lower (first) quartiles; the lengths of the whiskers indicate values up to 1.5 times the IQR in either direction.

References

    1. Sirugo G, Williams SM & Tishkoff SA The missing diversity in human genetic studies. Cell 177, 26–31 (2019). - PMC - PubMed
    1. Vilhjálmsson BJ et al. Modeling linkage disequilibrium increases accuracy of polygenic risk scores. Am. J. Hum. Genet 97, 576–592 (2015). - PMC - PubMed
    1. Finucane HK et al. Partitioning heritability by functional annotation using genome-wide association summary statistics. Nat. Genet 47, 1228–1235 (2015). - PMC - PubMed
    1. Bulik-Sullivan BK et al. LD Score regression distinguishes confounding from polygenicity in genome-wide association studies. Nat. Genet 47, 291–295 (2015). - PMC - PubMed
    1. Kichaev G & Pasaniuc, B. Leveraging functional-annotation data in trans-ethnic fine-mapping studies. Am. J. Hum. Genet 97, 260–271 (2015). - PMC - PubMed

Publication types

MeSH terms