

Detecting axonal injury in individual patients after traumatic brain injury
- PMID: 33257929
- PMCID: PMC7880666
- DOI: 10.1093/brain/awaa372
Detecting axonal injury in individual patients after traumatic brain injury
Abstract
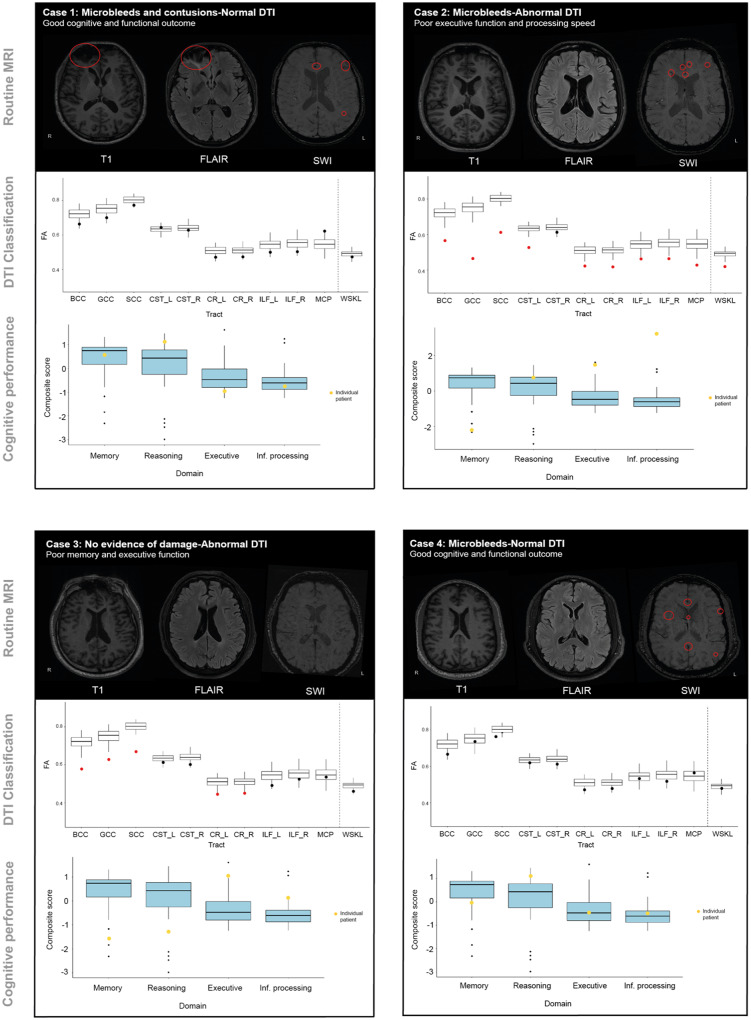
Poor outcomes after traumatic brain injury (TBI) are common yet remain difficult to predict. Diffuse axonal injury is important for outcomes, but its assessment remains limited in the clinical setting. Currently, axonal injury is diagnosed based on clinical presentation, visible damage to the white matter or via surrogate markers of axonal injury such as microbleeds. These do not accurately quantify axonal injury leading to misdiagnosis in a proportion of patients. Diffusion tensor imaging provides a quantitative measure of axonal injury in vivo, with fractional anisotropy often used as a proxy for white matter damage. Diffusion imaging has been widely used in TBI but is not routinely applied clinically. This is in part because robust analysis methods to diagnose axonal injury at the individual level have not yet been developed. Here, we present a pipeline for diffusion imaging analysis designed to accurately assess the presence of axonal injury in large white matter tracts in individuals. Average fractional anisotropy is calculated from tracts selected on the basis of high test-retest reliability, good anatomical coverage and their association to cognitive and clinical impairments after TBI. We test our pipeline for common methodological issues such as the impact of varying control sample sizes, focal lesions and age-related changes to demonstrate high specificity, sensitivity and test-retest reliability. We assess 92 patients with moderate-severe TBI in the chronic phase (≥6 months post-injury), 25 patients in the subacute phase (10 days to 6 weeks post-injury) with 6-month follow-up and a large control cohort (n = 103). Evidence of axonal injury is identified in 52% of chronic and 28% of subacute patients. Those classified with axonal injury had significantly poorer cognitive and functional outcomes than those without, a difference not seen for focal lesions or microbleeds. Almost a third of patients with unremarkable standard MRIs had evidence of axonal injury, whilst 40% of patients with visible microbleeds had no diffusion evidence of axonal injury. More diffusion abnormality was seen with greater time since injury, across individuals at various chronic injury times and within individuals between subacute and 6-month scans. We provide evidence that this pipeline can be used to diagnose axonal injury in individual patients at subacute and chronic time points, and that diffusion MRI provides a sensitive and complementary measure when compared to susceptibility weighted imaging, which measures diffuse vascular injury. Guidelines for the implementation of this pipeline in a clinical setting are discussed.
Keywords: diagnostic pipeline; diffuse axonal injury; diffusion tensor imaging; traumatic brain injury.
© The Author(s) (2020). Published by Oxford University Press on behalf of the Guarantors of Brain.
Figures


Similar articles
-
Diffuse axonal injury predicts neurodegeneration after moderate-severe traumatic brain injury.Brain. 2020 Dec 1;143(12):3685-3698. doi: 10.1093/brain/awaa316. Brain. 2020. PMID: 33099608
-
Limited Colocalization of Microbleeds and Microstructural Changes after Severe Traumatic Brain Injury.J Neurotrauma. 2020 Feb 15;37(4):581-592. doi: 10.1089/neu.2019.6608. Epub 2019 Nov 20. J Neurotrauma. 2020. PMID: 31588844
-
Automated detection of axonal damage along white matter tracts in acute severe traumatic brain injury.Neuroimage Clin. 2023;37:103294. doi: 10.1016/j.nicl.2022.103294. Epub 2022 Dec 13. Neuroimage Clin. 2023. PMID: 36529035 Free PMC article.
-
Neuropathology of Mild Traumatic Brain Injury: Correlation to Neurocognitive and Neurobehavioral Findings.In: Kobeissy FH, editor. Brain Neurotrauma: Molecular, Neuropsychological, and Rehabilitation Aspects. Boca Raton (FL): CRC Press/Taylor & Francis; 2015. Chapter 31. In: Kobeissy FH, editor. Brain Neurotrauma: Molecular, Neuropsychological, and Rehabilitation Aspects. Boca Raton (FL): CRC Press/Taylor & Francis; 2015. Chapter 31. PMID: 26269912 Free Books & Documents. Review.
-
White matter involvement after TBI: Clues to axon and myelin repair capacity.Exp Neurol. 2016 Jan;275 Pt 3:328-333. doi: 10.1016/j.expneurol.2015.02.011. Epub 2015 Feb 16. Exp Neurol. 2016. PMID: 25697845 Review.
Cited by
-
White matter abnormalities characterize the acute stage of sports-related mild traumatic brain injury.Brain Commun. 2022 Aug 17;4(4):fcac208. doi: 10.1093/braincomms/fcac208. eCollection 2022. Brain Commun. 2022. PMID: 36043140 Free PMC article.
-
Modified constraint-induced movement therapy enhances cortical plasticity in a rat model of traumatic brain injury: a resting-state functional MRI study.Neural Regen Res. 2023 Feb;18(2):410-415. doi: 10.4103/1673-5374.344832. Neural Regen Res. 2023. PMID: 35900438 Free PMC article.
-
Integrative Neuroinformatics for Precision Prognostication and Personalized Therapeutics in Moderate and Severe Traumatic Brain Injury.Front Neurol. 2021 Sep 7;12:729184. doi: 10.3389/fneur.2021.729184. eCollection 2021. Front Neurol. 2021. PMID: 34557154 Free PMC article. Review.
-
Individual-level analysis of MRI T2 relaxometry in mild traumatic brain injury: Possible indications of brain inflammation.Neuroimage Clin. 2024;43:103647. doi: 10.1016/j.nicl.2024.103647. Epub 2024 Jul 22. Neuroimage Clin. 2024. PMID: 39068788 Free PMC article.
-
Aberrant dynamic functional network connectivity in patients with diffuse axonal injury.Sci Rep. 2024 Nov 9;14(1):27386. doi: 10.1038/s41598-024-79052-4. Sci Rep. 2024. PMID: 39521859 Free PMC article.
References
-
- Adams JH, Doyle D, Ford I, Gennarelli TA, Graham DI, McLellan DR.. Diffuse axonal injury in head injury: definition, diagnosis and grading. Histopathology 1989; 15: 49–59. - PubMed
-
- Bach M, Fritzsche KH, Stieltjes B, Laun FB.. Investigation of resolution effects using a specialized diffusion tensor phantom. Magn Reson Med 2014; 71: 1108–16. - PubMed
-
- Basser PJ, Pierpaoli C.. Microstructural and physiological features of tissues elucidated by quantitative-diffusion-tensor MRI. J Magn Reson B 1996; 111: 209–19. - PubMed
-
- Behrens TE, Woolrich MW, Jenkinson M, Johansen-Berg H, Nunes RG, Clare S, et al.Characterization and propagation of uncertainty in diffusion-weighted MR imaging. Magn Reson Med 2003; 50: 1077–88. - PubMed
Publication types
MeSH terms
Grants and funding
LinkOut - more resources
Full Text Sources
Medical
