. 2021 Feb 12;144(1):325-339.
doi: 10.1093/brain/awaa399.

Time course of phosphorylated-tau181 in blood across the Alzheimer's disease spectrum

Affiliations

Time course of phosphorylated-tau181 in blood across the Alzheimer's disease spectrum

Alexis Moscoso et al. Brain. .

Erratum in

Abstract

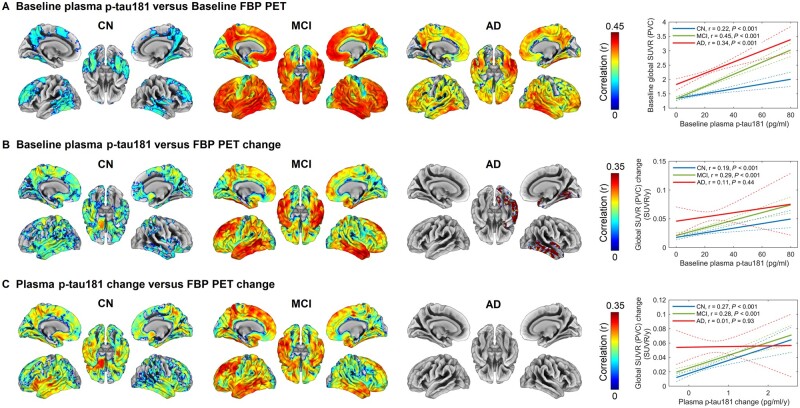
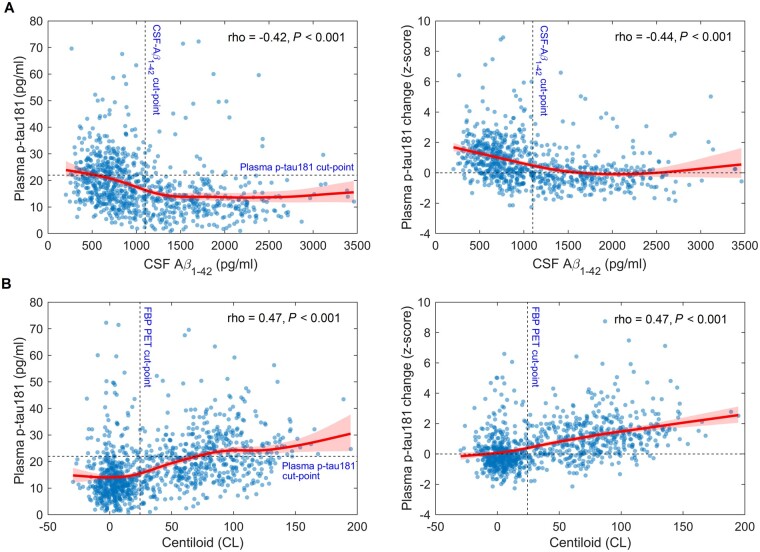
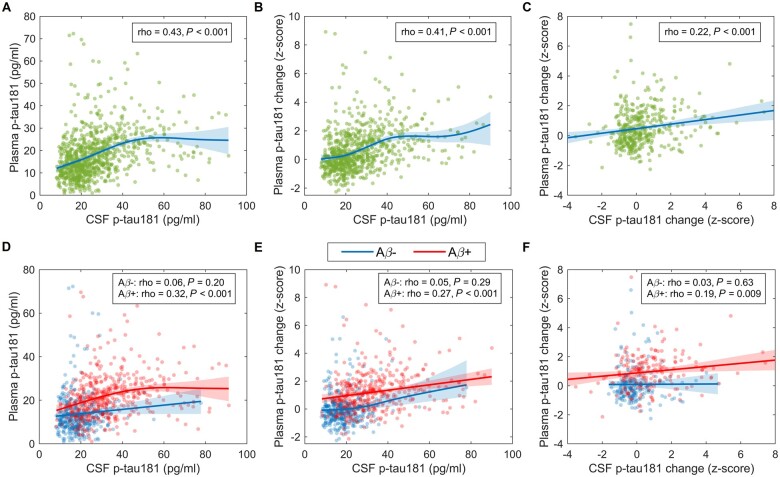
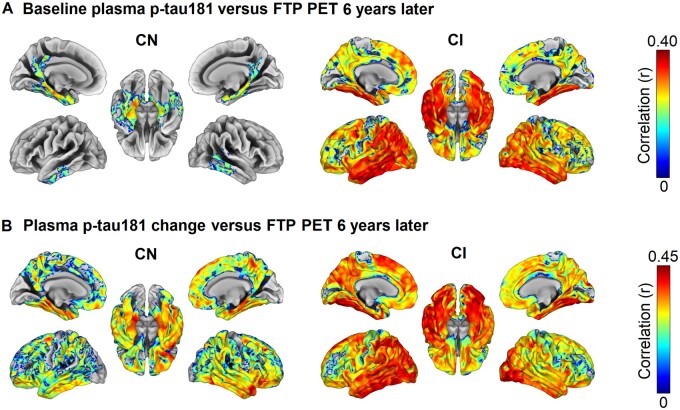
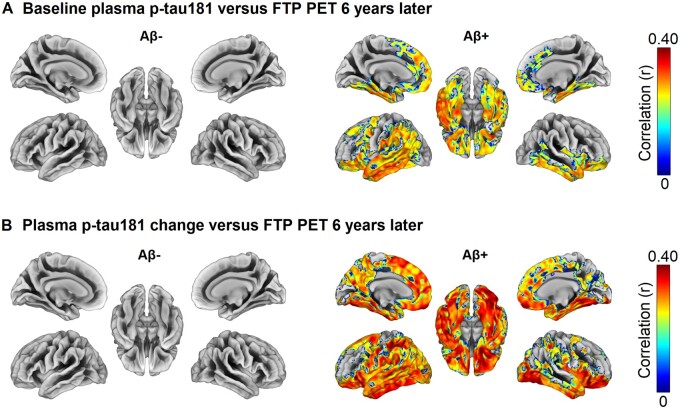
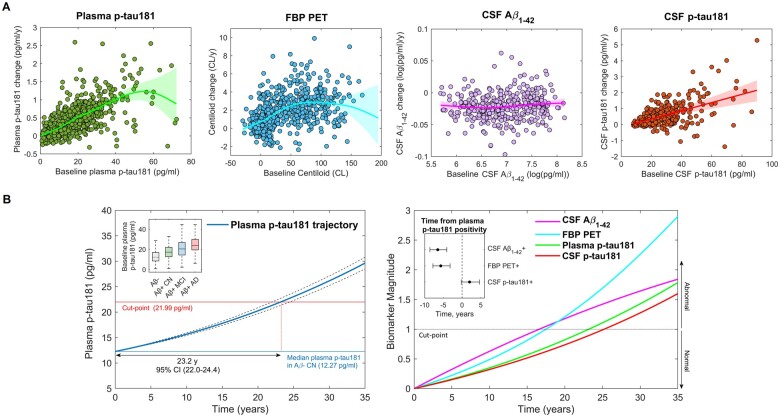
Tau phosphorylated at threonine 181 (p-tau181) measured in blood plasma has recently been proposed as an accessible, scalable, and highly specific biomarker for Alzheimer's disease. Longitudinal studies, however, investigating the temporal dynamics of this novel biomarker are lacking. It is therefore unclear when in the disease process plasma p-tau181 increases above physiological levels and how it relates to the spatiotemporal progression of Alzheimer's disease characteristic pathologies. We aimed to establish the natural time course of plasma p-tau181 across the sporadic Alzheimer's disease spectrum in comparison to those of established imaging and fluid-derived biomarkers of Alzheimer's disease. We examined longitudinal data from a large prospective cohort of elderly individuals enrolled in the Alzheimer's Disease Neuroimaging Initiative (ADNI) (n = 1067) covering a wide clinical spectrum from normal cognition to dementia, and with measures of plasma p-tau181 and an 18F-florbetapir amyloid-β PET scan at baseline. A subset of participants (n = 864) also had measures of amyloid-β1-42 and p-tau181 levels in CSF, and another subset (n = 298) had undergone an 18F-flortaucipir tau PET scan 6 years later. We performed brain-wide analyses to investigate the associations of plasma p-tau181 baseline levels and longitudinal change with progression of regional amyloid-β pathology and tau burden 6 years later, and estimated the time course of changes in plasma p-tau181 and other Alzheimer's disease biomarkers using a previously developed method for the construction of long-term biomarker temporal trajectories using shorter-term longitudinal data. Smoothing splines demonstrated that earliest plasma p-tau181 changes occurred even before amyloid-β markers reached abnormal levels, with greater rates of change correlating with increased amyloid-β pathology. Voxel-wise PET analyses yielded relatively weak, yet significant, associations of plasma p-tau181 with amyloid-β pathology in early accumulating brain regions in cognitively healthy individuals, while the strongest associations with amyloid-β were observed in late accumulating regions in patients with mild cognitive impairment. Cross-sectional and particularly longitudinal measures of plasma p-tau181 were associated with widespread cortical tau aggregation 6 years later, covering temporoparietal regions typical for neurofibrillary tangle distribution in Alzheimer's disease. Finally, we estimated that plasma p-tau181 reaches abnormal levels ∼6.5 and 5.7 years after CSF and PET measures of amyloid-β, respectively, following similar dynamics as CSF p-tau181. Our findings suggest that plasma p-tau181 increases are associated with the presence of widespread cortical amyloid-β pathology and with prospective Alzheimer's disease typical tau aggregation, providing clear implications for the use of this novel blood biomarker as a diagnostic and screening tool for Alzheimer's disease.

Keywords: Alzheimer’s disease; blood biomarkers; cerebrospinal fluid; positron emission tomography; tau.


Figures

Figure 1
Figure 1
Regional and global associations of plasma p-tau181 with PET-measured amyloid-β deposition and longitudinal accumulation across the clinical spectrum of Alzheimer’s disease. Voxel-wise analyses (adjusted for age and sex) assessing regional associations between (A) baseline plasma p-tau181 levels and baseline FBP SUVR, (B) baseline plasma p-tau181 levels and FBP SUVR change, and (C) plasma p-tau181 change and FBP SUVR change. Significant associations in voxel-wise analyses were determined based on a FWE-corrected threshold of P <0.001 at the cluster level, with initial voxel-level height thresholds of P <0.001 (A), or P <0.01 (B and C) (depending on sample size). Colour panels on the right display linear fits and (unadjusted) Pearson correlation coefficients (r) of the effects on global measures. Dashed lines in right panels are 95% confidence intervals. In cognitively normal subjects (CN), weak correlations were observed in regions previously described as early amyloid-β accumulating regions, while the strongest correlations were observed at the MCI stage where regional associations covered widespread areas involving cortical and subcortical areas known to be involved later in the disease course (see also Supplementary Figs 2 and 3). AD = Alzheimer’s disease.
Figure 2
Figure 2
Baseline and longitudinal associations of plasma p-tau181 with imaging and CSF biomarkers of global amyloid-β pathology. Smoothing splines describing the statistical dependence of baseline levels of plasma p-tau181 (left) and longitudinal change in plasma p-tau181 (right) on (A) CSF amyloid-β1–42 levels and (B) global centiloids. Spearman’s rank correlation was used to quantify the monotonic correlation between these measures. Shaded areas are 95% CI for the fit. Dashed lines represent cut-off points for abnormality for the studied biomarkers. Earliest increases in plasma p-tau181 appeared shortly before amyloid-β markers reached abnormal levels, and changes accelerated as the severity of global amyloid-β pathology increased. Plasma p-tau181 reached abnormal levels only after amyloid-β biomarkers reached relatively advanced abnormality levels (PET centiloid = 70 pg/ml and CSF amyloid-β1–42 = 540 pg/ml, left).
Figure 3
Figure 3
Baseline and longitudinal associations between plasma p-tau181 and CSF p-tau181. Smoothing splines describing the statistical dependence of baseline levels of plasma p-tau181 (A) and plasma p-tau181 change (B) on CSF p-tau181 levels, as well as plasma p-tau181 change versus CSF p-tau181 change (C). (DF) Results from the same analyses stratified by amyloid-β (Aβ) status. Z-scores were computed using amyloid-β− cognitively normal levels as the reference. Shaded areas are 95% CI for the fit. Spearman’s rank correlation was used to quantify the monotonic correlation between these measures. Changes of p-tau181 in plasma and CSF followed a linear trend approximately anchored at the origin, indicating that these two markers follow similar dynamics. (DF) Panels show that this association was statistically significant only among amyloid-β+ subjects.
Figure 4
Figure 4
Associations of plasma p-tau181 baseline levels and longitudinal increase with regional tau aggregation 6 years later, according to cognitive status. Regional associations (adjusted for age, sex, and time difference between blood sampling and PET scanning) of (A) baseline plasma p-tau181 levels and (B) longitudinal plasma p-tau181 change with voxel-wise FTP SUVR 6 years later. Significant associations in voxel-wise analyses were determined based on a FWE-corrected threshold of P <0.001 at the cluster level after applying a voxel-level threshold of P <0.01. Baseline plasma p-tau181 and, more pronounced, longitudinal change were associated with widespread tau aggregation 6 years later, following the characteristic temporoparietal pattern of progressing neurofibrillary tangle pathology in Alzheimer’s disease. CI = cognitively impaired; CN = cognitively normal.
Figure 5
Figure 5
Associations of plasma p-tau181 baseline levels and longitudinal increase with regional tau aggregation 6 years later, stratified by amyloid-β status. Regional associations (adjusted for age, sex, cognitive status, and time difference between blood sampling and PET scanning) of (A) baseline plasma p-tau181 levels and (B) longitudinal plasma p-tau181 change with voxel-wise FTP SUVR 6 years later. Significant associations in voxel-wise analyses were determined based on a FWE-corrected threshold of P <0.05 at the cluster level after applying a voxel-level threshold of P <0.01. Baseline plasma p-tau181 and longitudinal change were associated with widespread tau aggregation 6 years later only among amyloid-β+ subjects.
Figure 6
Figure 6
The natural time course of plasma p-tau181 in Alzheimer’s disease. (A) Smoothing splines describing the dependence of biomarker rate of change on baseline levels of the respective biomarker. Logarithmic transformation of CSF amyloid-β1–42 levels was performed in order to improve residual normality in linear mixed models and facilitate the spline fit. (B) Left: Time course of plasma p-tau181, estimated using individual longitudinal data. The curve is anchored at median plasma p-tau181 levels in cognitively normal amyloid-β− individuals, thus describing the temporal trajectory from non-pathological to abnormal levels. The inset shows a box plot representing biomarker levels for amyloid-β− and amyloid-β+ subjects at different stages of Alzheimer’s disease. Right: Combined temporal trajectories of plasma p-tau181, amyloid-β PET and CSF biomarkers. To represent all trajectories on the same scale, curves were anchored to median levels in cognitively normal amyloid-β− subjects, transformed to z-scores using mean cognitively normal amyloid-β− levels as reference, and scaled to the corresponding cut-off point z-score (Villemagne et al., 2013). The insert demonstrates the time lag between time points where plasma p-tau181 and other biomarkers reach abnormal levels. Plasma p-tau181 reached abnormal levels ∼5.7 years after amyloid-β PET and 6.5 years after CSF amyloid-β1–42, following similar dynamics as CSF p-tau181, which reached abnormal levels 2.0 years after plasma p-tau181 (not statistically significant).

Comment in

Similar articles

Cited by

References

    1. Ashton NJ, Hye A, Rajkumar AP, Leuzy A, Snowden S, Suarez-Calvet M, et al.An update on blood-based biomarkers for non-Alzheimer neurodegenerative disorders. Nat Rev Neurol 2020; 16: 265–84. - PubMed
    1. Ashton NJ, Nevado-Holgado AJ, Barber IS, Lynham S, Gupta V, Chatterjee P, et al.A plasma protein classifier for predicting amyloid burden for preclinical Alzheimer's disease. Sci Adv 2019; 5: eaau7220. - PMC - PubMed
    1. Baek MS, Cho H, Lee HS, Choi JY, Lee JH, Ryu YH, et al.Temporal trajectories of in vivo tau and amyloid-beta accumulation in Alzheimer's disease. Eur J Nucl Med Mol Imaging 2020; 47: 2879–86. - PubMed
    1. Baker SL, Maass A, Jagust WJ.. Considerations and code for partial volume correcting [(18)F]-AV-1451 tau PET data. Data Brief 2017; 15: 648–57. - PMC - PubMed
    1. Barthelemy NR, Horie K, Sato C, Bateman RJ.. Blood plasma phosphorylated-tau isoforms track CNS change in Alzheimer's disease. J Exp Med 2020; 217: e20200861. - PMC - PubMed

Publication types