. 2020 Nov 30;115(6):74.
doi: 10.1007/s00395-020-00835-7.

Reduced reticulum-mitochondria Ca2+ transfer is an early and reversible trigger of mitochondrial dysfunctions in diabetic cardiomyopathy

Affiliations

Reduced reticulum-mitochondria Ca2+ transfer is an early and reversible trigger of mitochondrial dysfunctions in diabetic cardiomyopathy

Maya Dia et al. Basic Res Cardiol. .

Abstract

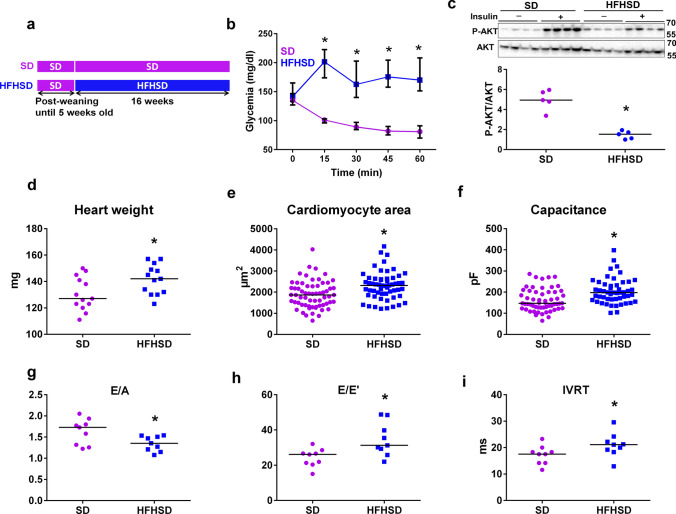
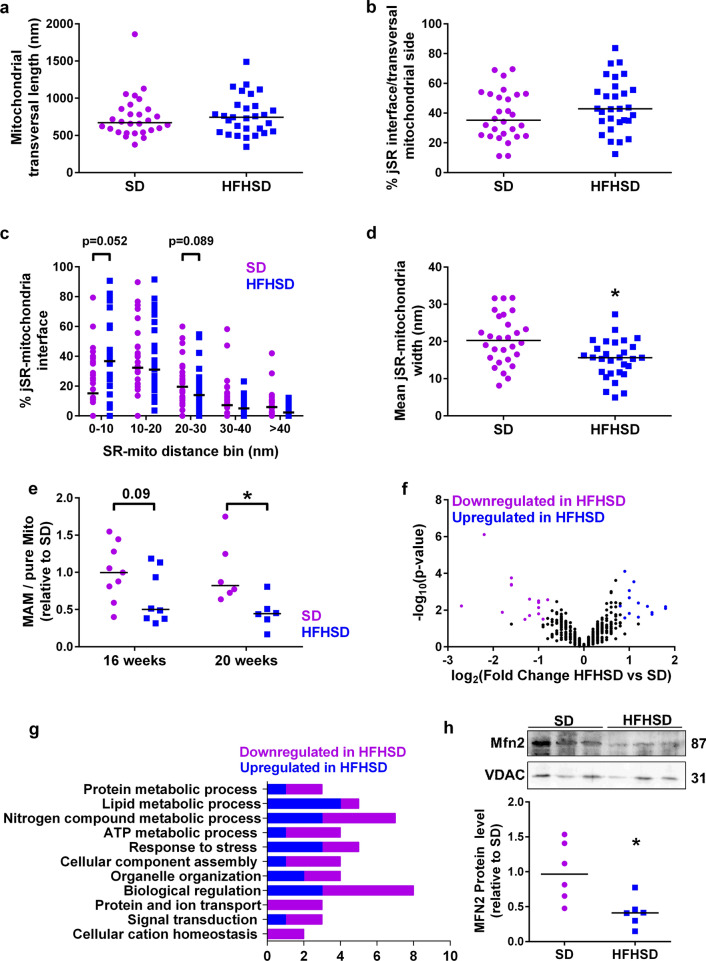
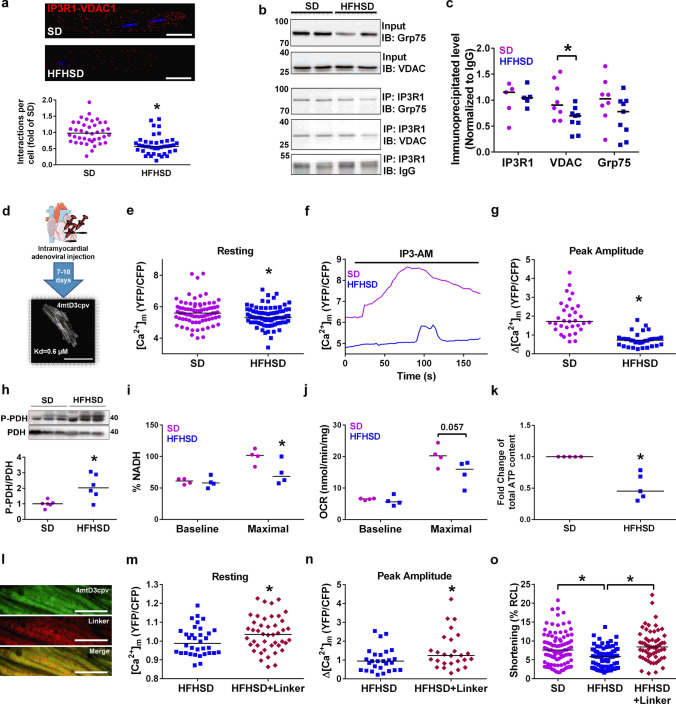
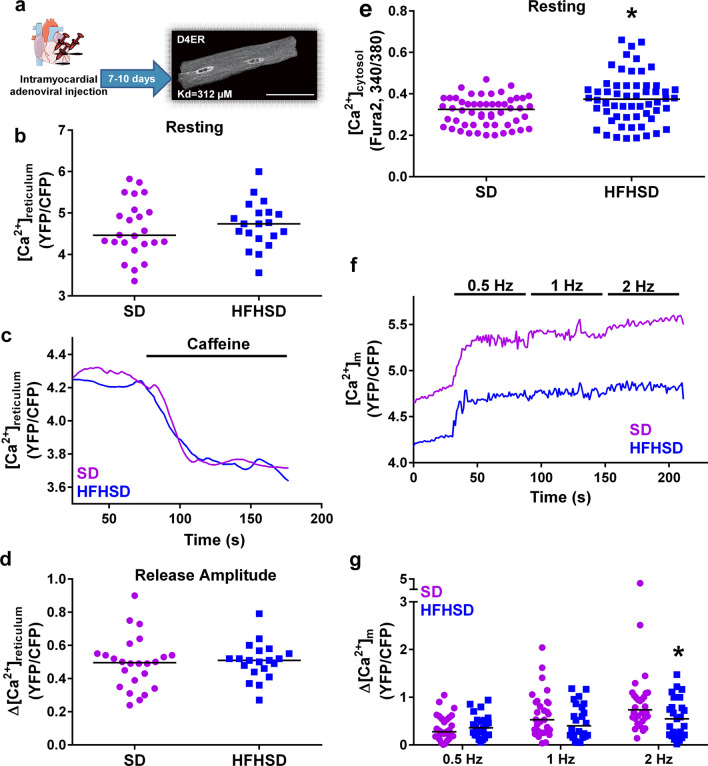
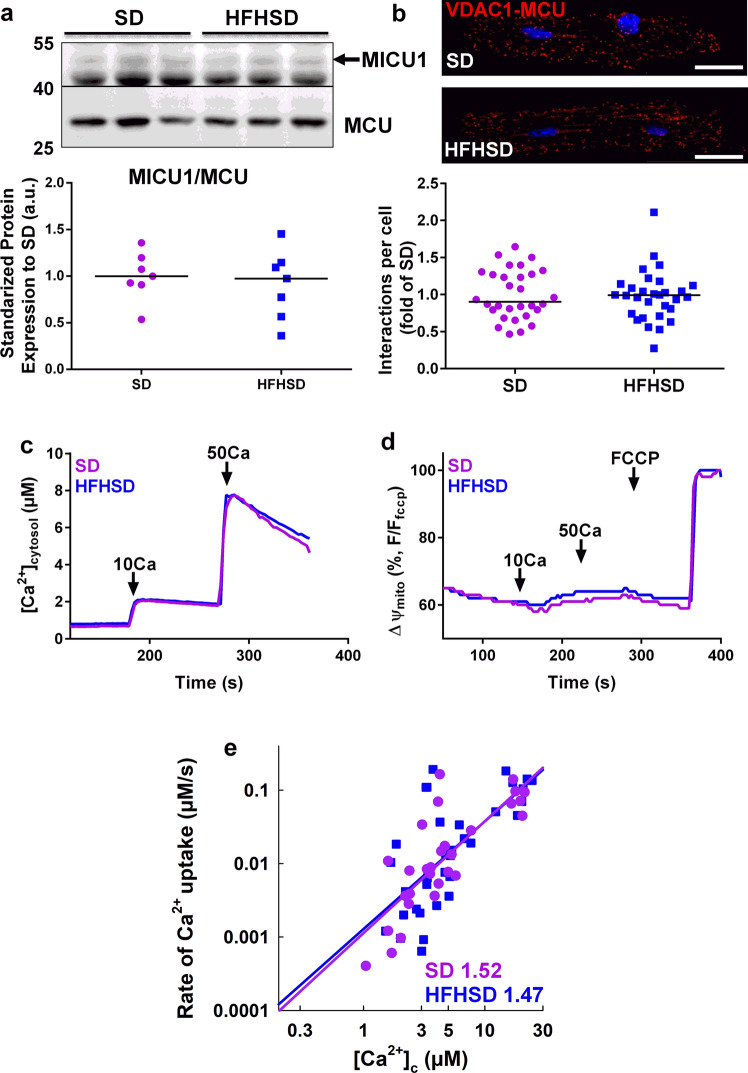
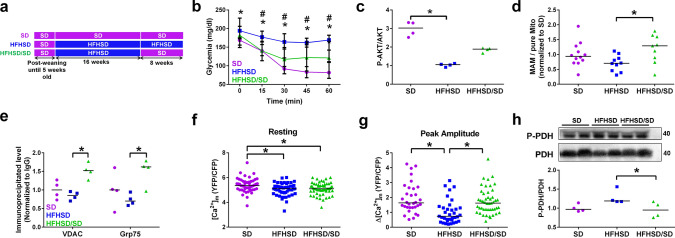
Type 2 diabetic cardiomyopathy features Ca2+ signaling abnormalities, notably an altered mitochondrial Ca2+ handling. We here aimed to study if it might be due to a dysregulation of either the whole Ca2+ homeostasis, the reticulum-mitochondrial Ca2+ coupling, and/or the mitochondrial Ca2+ entry through the uniporter. Following a 16-week high-fat high-sucrose diet (HFHSD), mice developed cardiac insulin resistance, fibrosis, hypertrophy, lipid accumulation, and diastolic dysfunction when compared to standard diet. Ultrastructural and proteomic analyses of cardiac reticulum-mitochondria interface revealed tighter interactions not compatible with Ca2+ transport in HFHSD cardiomyocytes. Intramyocardial adenoviral injections of Ca2+ sensors were performed to measure Ca2+ fluxes in freshly isolated adult cardiomyocytes and to analyze the direct effects of in vivo type 2 diabetes on cardiomyocyte function. HFHSD resulted in a decreased IP3R-VDAC interaction and a reduced IP3-stimulated Ca2+ transfer to mitochondria, with no changes in reticular Ca2+ level, cytosolic Ca2+ transients, and mitochondrial Ca2+ uniporter function. Disruption of organelle Ca2+ exchange was associated with decreased mitochondrial bioenergetics and reduced cell contraction, which was rescued by an adenovirus-mediated expression of a reticulum-mitochondria linker. An 8-week diet reversal was able to restore cardiac insulin signaling, Ca2+ transfer, and cardiac function in HFHSD mice. Therefore, our study demonstrates that the reticulum-mitochondria Ca2+ miscoupling may play an early and reversible role in the development of diabetic cardiomyopathy by disrupting primarily the mitochondrial bioenergetics. A diet reversal, by counteracting the MAM-induced mitochondrial Ca2+ dysfunction, might contribute to restore normal cardiac function and prevent the exacerbation of diabetic cardiomyopathy.

Keywords: Ca2+ flux; Diabetic cardiomyopathy; Metabolic syndrome disease; Mitochondria-associated membranes MAM; Protein database; Proteomic analysis of cardiac MAM proteome.


Conflict of interest statement

The authors declare that they have no competing interests.

Figures

Fig. 1
Fig. 1
Diet-induced T2D altered the cardiac insulin signaling and triggered an early diabetic cardiomyopathy phenotype. a Study design of the diet groups: at 5 weeks old, mice were assigned to 16 weeks of either Standard diet (SD) or High-Fat High-Sucrose diet (HFHSD). b Insulin tolerance assessment by following glycemia levels after an intraperitoneal injection of insulin (0.75 mU/g) (N = 10 mice per group). c Cardiac pAKT/AKT levels reflecting the cardiac insulin sensitivity. Upper panel: representative immunoblots. Lower panel: quantification of P-AKT/AKT as a fold of insulin-induced AKT phosphorylation over NaCl (N = 5 mice per group). d Measurement of heart weight after 16 weeks of SD or HFHSD (N = 13 mice/group; Mann–Whitney test). e Quantification of SD and HFHSD cardiomyocyte area using ImageJ software (n = 56–63 cells from N = 4 mice/group, Mann–Whitney test; p < 0.05 when statistics made on N = 4 mice/group). f Cardiomyocyte membrane capacitance recorded by electrophysiology patch clamp (n = 51–57 cells from N = 5 mice/group, Mann–Whitney test; p < 0.05 when statistics made on N = 5 mice/group). g to i Echocardiography assessment of diastolic function: quantification of E/A ratio (g), E/E’ ratio (h) and isovolumic relaxation time, IVRT (i) from N = 9 mice/group. Data are presented as median; * p < 0.05 versus SD
Fig. 2
Fig. 2
16 weeks of HFHSD altered the reticulum–mitochondria coupling and protein composition. a-d Ultrastructural analysis by electron microscopy of the cardiac junctional reticulum (jSR)–mitochondria interactions in SD and HFHSD cardiomyocytes (n = 29 contacts from N = 4 mice per group at 16 weeks of diet). Quantification of the length of the mitochondrial transversal side (a) and of the jSR–mitochondria interface (b). c Bar graph shows the frequency of jSR–mitochondria interaction width. e Quantification of the SD-relative protein ratio of MAM over pure mitochondria from heart fractionation at 16 and 20 weeks of diet (N = 8–9 mice per group at 16 weeks; N = 6 mice per group at 20 weeks). f Volcano plot of the 522 proteins identified in the SD and HFHSD MAM proteome (N = 4 mice per group at 16 weeks). Each point represents an individual protein. Significant upregulated and downregulated proteins in HFHSD versus SD are depicted, respectively, in blue and purple. g Bar graph showing the functional annotation of the major processes differentially expressed in SD and HFHSD cardiac MAM. h Quantification of MFN2 immunoblotting in cardiac MAM isolated from SD and HFHSD mice at 16 weeks of diet (N = 6 mice per group). Normalization was done to VDAC. Results are presented as median; Mann–Whitney non-parametric test was performed; *p < 0.05 versus corresponding SD
Fig. 3
Fig. 3
Decreased formation of the IP3R1/Grp75/VDAC Ca2+ channeling complex leading to reduced IP3-stimulated Ca2+ transfer to mitochondria in the diabetic cardiomyocyte. a Proximity ligation assay between IP3R1 and VDAC1 in isolated SD and HFHSD cardiomyocytes. Upper panel: representative confocal microscopy images of in situ IP3R1–VDAC1 interactions depicted as red dots. Nuclei appear in blue. Scale bar: 25 µm. Lower panel: quantification of the interactions per cell presented as a fold of SD (n = 40 cardiomyocytes from N = 4 mice/group at 16 weeks of diet, Mann–Whitney test; p < 0.05 when statistics made on N = 4 mice/group). b Representative immunoblots of VDAC and Grp75 following IP3R immunoprecipitation in SD and HFHSD cardiomyocytes. c Densitometric analysis of IP3R1, Grp75, and VDAC protein levels pulled down by IP3R and normalized to IgG (N = 5–8 mice/group at 16 weeks of diet; Mann–Whitney test). d Illustration of the in vivo adenoviral strategy to express the mitochondrial Ca2+ sensor, 4mtD3cpv, in adult mouse cardiomyocytes. Ten days following direct intramyocardial injection of the adenovirus, isolated cardiomyocytes present a typical mitochondrial pattern of the fluorescent sensor as displayed on the representative confocal image. Scale bar: 50 µm. e Quantification of the resting [Ca2+]m fluorescence ratio (n = 78–81 cells from N = 8 mice/group at 16 weeks of diet; Mann–Whitney test; p < 0.05 when statistics made on N = 8 mice/group). f Representative traces of the [Ca2+]m as a YFP/CFP ratio, after IP3R stimulation by 10 µM IP3-AM in SD and HFHD cardiomyocytes. g Calculations of the [Ca2+]m IP3-induced peak amplitude from data in (f) (n = 33–35 cells from N = 4 mice/group at 16 weeks of diet; Mann–Whitney test; p < 0.05 when statistics made on N = 4 mice/group). Peak amplitude was defined by subtracting the resting [Ca2+]m to the [Ca2+]m peak level. h Quantification of the phosphorylation of PDH over total PDH, relative to SD, in total cardiomyocytes lysates (N = 6 mice per group at 16 weeks of diet; Mann–Whitney test). i NADH autofluorescence measurements in intact cardiomyocytes. Baseline NADH autofluorescence level, expressed as a percentage by calibration with rotenone (maximal) and FCCP (minimal). Maximal NADH autofluorescence level after rotenone treatment, calculated as a percentage of increase between baseline and post-rotenone, normalized to SD (N = 4 mice per group at 16 weeks of diet; Mann–Whitney test). j OCR using the Oroboros respirometer: baseline and FCCP-induced maximal oxidative phosphorylation were measured in intact cardiomyocytes (N = 4 mice per group at 16 weeks of diet; Mann–Whitney test). k Fold change of total ATP content in freshly isolated SD and HFHSD cardiomyocytes. HFHSD values are normalized to the respective SD values of the experimental day (N = 5 mice per group at 16 weeks of diet; Mann–Whitney test). l Representative confocal images of co-infection with the linker construct and the mitochondrial Ca2+ sensor 4mtD3cpv. Scale bar: 10 µm. m and n Quantification of the resting [Ca2+]m fluorescence ratio and [Ca2+]m IP3-induced peak amplitude, respectively (n = 34–44 cells for baseline and n = 26 cells for peak amplitude from N = 3–4 mice/group at 16 weeks of diet, Mann–Whitney test; p = ns when statistics made on N = 3–4 mice/group). o Cardiomyocyte contractility under 1 Hz field stimulation, presented as a percentage of the resting cell length (RCL) (n = 59–91 cells from N = 3–4 mice/group at 16 weeks of diet, Kruskal–Wallis test; p = ns when statistics made on N = 3–4 mice/group). Data are shown as median; *p < 0.05
Fig. 4
Fig. 4
Effect of 16 weeks of HFHSD on the whole cardiomyocyte Ca2+ homeostasis. a Illustration of the intramyocardial adenoviral injection of the reticular Ca2+ sensor D4ER, with a representative confocal image of an infected cardiomyocyte displaying a reticular pattern. Scale bar: 50 µm. b Dot plot shows the resting reticular [Ca2+] measured in infected cardiomyocytes under resting conditions (n = 20–25 cells from N = 4 mice/group at 16 weeks of diet, Mann–Whitney test; p = ns when statistics made on N = 4 mice/group). c Representative time course of the reticular [Ca2+] after RyR stimulation with 5 mM caffeine in SD and HFHD cardiomyocytes. d Summary data show the level of reticular [Ca2+] released by caffeine addition in (c) (n = 20–25 cells from N = 4 mice/group at 16 weeks of diet, Mann–Whitney test; p = ns when statistics made on N = 4 mice/group). e Measurement of [Ca2+]c levels in Fura2-loaded cardiomyocytes (n = 55–58 cells from N = 4 mice/group at 16 weeks of diet, Mann–Whitney test; p = ns when statistics made on N = 4 mice/group.) f Representative traces of [Ca2+]m after field stimulation with 0.5, 1, and 2 Hz. g Calculations of the [Ca2+]m field stimulation-induced peak amplitude from data in (f) (n = 26–34 cells from N = 3 mice/group at 16 weeks of diet, Sidak multiple comparison test; p = 0.05 at 2 Hz when statistics made on N = 3 mice/group). Results are displayed as median;*p < 0.05 versus SD
Fig. 5
Fig. 5
No change in the composition and function of the cardiac mitochondrial Ca2+ uniporter after 16 weeks of HFHSD. a Detection of MICU1 and MCU by immunoblotting in isolated cardiac pure mitochondria from SD and HFHSD hearts. Lower panel displays the densitometric analysis of the MICU1 to MCU ratio, being normalized to SD (N = 7–8 mice per group at 16 weeks of diet; Mann–Whitney test). b Representative confocal microscopy images of the VDAC1–MCU interactions in SD and HFHSD cardiomyocytes by proximity ligation assay, scale bar: 25 µm. Quantification of the interactions per cell (fold of SD) is presented as a dot plot (n = 40 cells from N = 3 mice per group at 16 weeks of diet, Mann–Whitney test; p = ns when statistics made on N = 3 mice/group). c Time courses of the mitochondrial clearance of the [Ca2+]c rise, measured by Fura2, upon addition of CaCl2 bolus (10 µM followed by 50 µM) in suspensions of SD or HFHSD heart mitochondria. d Simultaneous recordings of mitochondrial membrane potential with (c), measured by TMRM and calibrated for maximal depolarization with 2 µM FCCP. e Double logarithmic plot of the initial Ca2+ uptake rates against the measured peak [Ca2+]c in SD and HFHSD cardiac mitochondria (N = 4 mice per group at 16 weeks of diet; Mann–Whitney test). Slope of each linear fit is indicated. Results are shown as median.
Fig. 6
Fig. 6
Diet reversal restores the reticulum–mitochondria functional Ca2+ coupling a Experimental design of the feeding protocols: 5-week-old mice received either 16 weeks of Standard diet (SD) or High-Fat High-Sucrose diet (HFHSD), followed by 4–8 weeks of diet reversal for a group of HFHSD mice (HFHSD/SD). b Insulin tolerance test following glycemia level after an intraperitoneal injection of insulin (0.75 mU/g) in mice with 4 weeks of diet reversal (N = 8–11 mice/group; Tukey’s Multiple comparison test). *p < 0.05 versus SD, #p < 0.05 versus HFHSD/SD. c Quantitative analysis of insulin-stimulated phosphorylation of AKT in heart of SD, HFHSD, and HFHSD/SD mice after 4 weeks of diet reversal (N = 4 mice/group; Kruskal–Wallis). Data are expressed as a fold of insulin stimulation over NaCl treatment. d Quantitative analysis of protein levels in MAM fractions following subcellular fractionation of SD, HFHSD, and HFHSD/SD hearts at 8 weeks of diet reversal. MAM amount is normalized to the pure mitochondrial protein level and expressed as a fold of SD (n = 9–12 mice per group). e Densitometric analysis of the protein amounts of VDAC and Grp75 pulled-down following IP3R immunoprecipitation in total cardiomyocyte lysates after 8 weeks of diet reversal, with normalization to IgG (N = 4 mice/group at 24 weeks of diet; Kruskal–Wallis). f Resting [Ca2+]m values measured by the FRET-based sensor, 4mtD3cpv, in isolated cardiomyocytes following 8 weeks of diet reversal (n = 49–60 cells from N = 4 mice/group; Mann–Whitney test). f Summary data show the peak amplitude level of [Ca2+]m after IP3-AM stimulation (n = 32–47 cells from N = 4 mice/group at 24 weeks of diet, Mann–Whitney test; p = ns when statistics made on N = 4 mice/group), calculated by subtracting the resting [Ca2+]m level to the peak [Ca2+]m level. h Representative immunoblotting and densitometric analysis of the phosphorylation of PDH over total PDH, relative to SD, in total cardiomyocytes lysates (N = 4 mice per group at 24 weeks of diet, Mann–Whitney test; p < 0.05 when statistics made on N = 4 mice/group). Results are expressed as median; * p < 0.05
Fig. 7
Fig. 7
Contribution of the reticulum–mitochondria functional Ca2+ disruption and the ensuing mitochondrial dysfunctions to the pathophysiological mechanisms of type 2 diabetes-induced contractile dysfunction. During physiological excitation–contraction coupling, reticular Ca2+ release through the Ryanodine receptor (RyR) leads to cytosolic Ca2+ transients. In parallel, Ca2+ transfer from reticulum to mitochondria through both RyR and IP3R at the MAM interface increases the mitochondrial [Ca2+], therefore activating the PDH and the ATP production through the electron transport chain (ETC). Both cytosolic Ca2+ elevations and ATP activate concomitantly the contraction. In conditions of HFHSD-induced type 2 diabetes, the cardiac reticulum–mitochondria functional Ca2+ coupling is disrupted with a decreased formation of the IP3R/Grp75/VDAC Ca2+ channeling complex, thus leading to a reduced transfer of Ca2+ from the reticulum to mitochondria. In parallel, a decreased mitochondrial Ca2+ uptake under field stimulation is seen in the HFHSD model, with a preservation of cytosolic Ca2+ transients. This reduction in mitochondrial Ca2+ level contributes to the occurrence of mitochondrial dysfunctions, notably a decreased PDH activity followed by a decreased mitochondrial bioenergetics. Consequently, the insufficient ATP content fails to match the energy demand for the cardiomyocyte contraction. Therapeutic diet reversal counteracts the disruption of the reticulum–mitochondria functional coupling, therefore, reestablishing the proper mitochondrial Ca2+ handling and metabolic function, required for the normal functioning of the heart.

References

    1. Arruda AP, Pers BM, Parlakgul G, Guney E, Inouye K, Hotamisligil GS. Chronic enrichment of hepatic endoplasmic reticulum-mitochondria contact leads to mitochondrial dysfunction in obesity. Nat Med. 2014;20:1427–1435. doi: 10.1038/nm.3735. - DOI - PMC - PubMed
    1. Bartok A, Weaver D, Golenar T, Nichtova Z, Katona M, Bansaghi S, Alzayady KJ, Thomas VK, Ando H, Mikoshiba K, Joseph SK, Yule DI, Csordas G, Hajnoczky G. IP3 receptor isoforms differently regulate ER-mitochondrial contacts and local calcium transfer. Nat Commun. 2019;10:3726. doi: 10.1038/s41467-019-11646-3. - DOI - PMC - PubMed
    1. Baughman JM, Perocchi F, Girgis HS, Plovanich M, Belcher-Timme CA, Sancak Y, Bao XR, Strittmatter L, Goldberger O, Bogorad RL, Koteliansky V, Mootha VK. Integrative genomics identifies MCU as an essential component of the mitochondrial calcium uniporter. Nature. 2011;476:341–345. doi: 10.1038/nature10234. - DOI - PMC - PubMed
    1. Bers DM. Cardiac excitation-contraction coupling. Nature. 2002;415:198–205. doi: 10.1038/415198a. - DOI - PubMed
    1. Boudina S, Abel ED. Diabetic cardiomyopathy revisited. Circulation. 2007;115:3213–3223. doi: 10.1161/CIRCULATIONAHA.106.679597. - DOI - PubMed

Publication types

MeSH terms