

Viral nucleoprotein antibodies activate TRIM21 and induce T cell immunity
- PMID: 33258165
- PMCID: PMC7917548
- DOI: 10.15252/embj.2020106228
Viral nucleoprotein antibodies activate TRIM21 and induce T cell immunity
Abstract
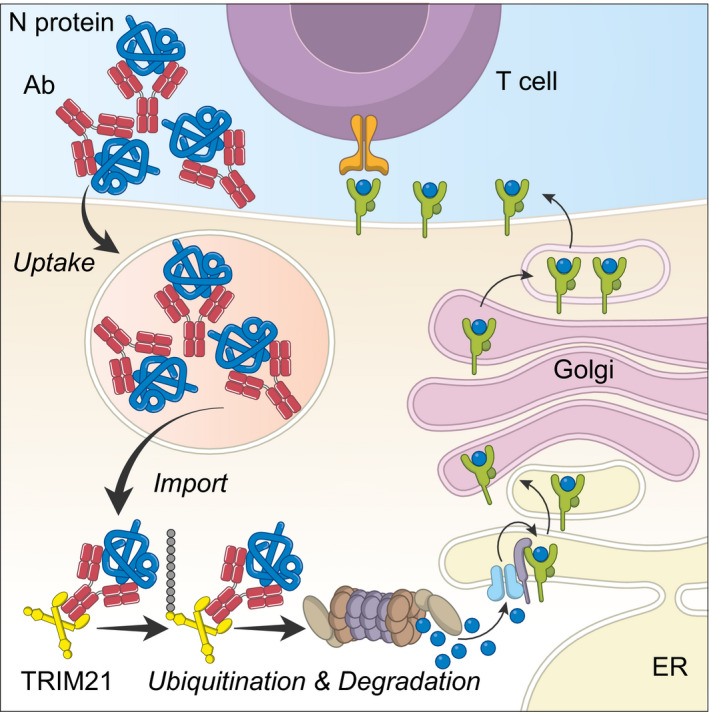
Nucleoprotein (N) is an immunodominant antigen in many enveloped virus infections. While the diagnostic value of anti-N antibodies is clear, their role in immunity is not. This is because while they are non-neutralising, they somehow clear infection by coronavirus, influenza and LCMV in vivo. Here, we show that anti-N immune protection is mediated by the cytosolic Fc receptor and E3 ubiquitin ligase TRIM21. Exploiting LCMV as a model system, we demonstrate that TRIM21 uses anti-N antibodies to target N for cytosolic degradation and generate cytotoxic T cells (CTLs) against N peptide. These CTLs rapidly eliminate N-peptide-displaying cells and drive efficient viral clearance. These results reveal a new mechanism of immune synergy between antibodies and T cells and highlights N as an important vaccine target.
Keywords: TRIM21; antibody; non-neutralising; nucleoprotein; virus.
© 2020 The Authors. Published under the terms of the CC BY 4.0 license.
Conflict of interest statement
The authors declare that they have no conflict of interest.
Figures
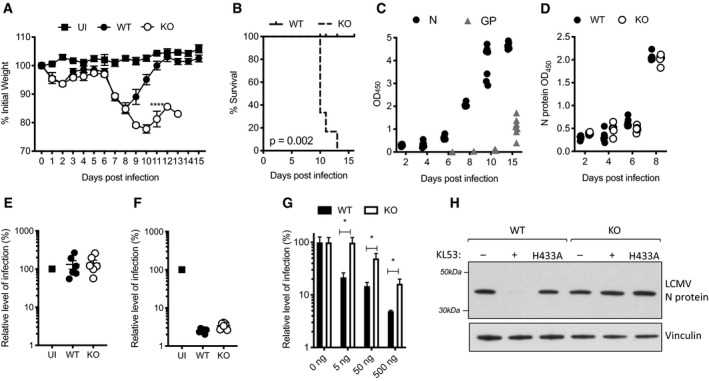
- A–F
Wild‐type (WT) and TRIM21 knockout (KO) mice were infected with 105 FFU LCMV clone 13 (6 mice per group) and 2 mice were uninfected (UI). Weights (A) and Kaplan–Meier survival (B) were compared over 15 days post infection (pi). (C) Sera from WT mice was analysed for N protein (N) and glycoprotein (GP)‐specific antibodies by ELISA, each data point corresponds to one mouse from the same experiment. (D) N‐specific antibody ELISA was used to compare antibody responses in sera of WT and KO mice. (E,F) In vitro neutralisation experiments were performed with sera collected day 8pi from WT, KO and UI mice. (E) Sera was pre‐incubated with LCMV, then the virus‐serum mix was added to MEF cells and LCMV infection titre after 16 h was measured by FFA. (F) Sera was electroporated into MEFs, then cells were plated in triplicate and LCMV was added 4 h later. LCMV infection titre after 16 h was measured by FFA (three replicates).
- G
Anti‐N mAb KL53 was electroporated into WT and KO MEFs and subsequent LCMV infection titres were measured by FFA.
- H
Anti‐N mAb KL53 was co‐electroporated with recombinant N protein into WT and KO MEFs, and immunoblotting for N was performed after 3 h. Electroporation of recombinant KL53 expressing the TRIM21 non‐binding mutation H433A was unable to mediate N protein degradation.
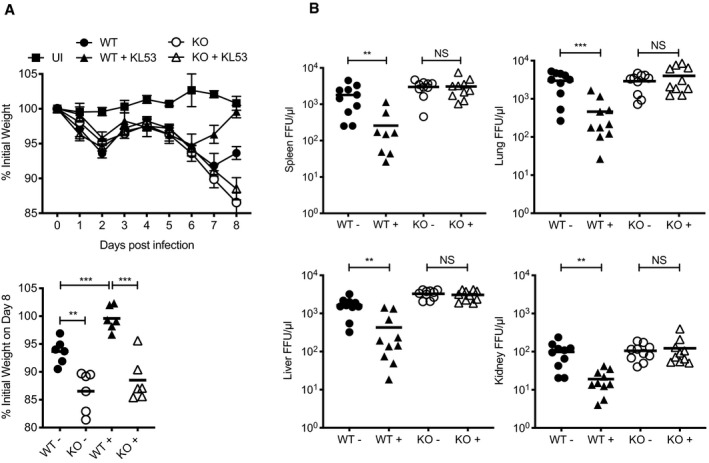
- A, B
Wild‐type (WT) and TRIM21 knockout (KO) mice were infected with 0.5 × 10⁵ FFU LCMV clone 13 (6 mice per group) and either received anti‐N mAb KL53 (+) or control (−) intraperitoneally on days 1 and 3pi. Two mice were uninfected (UI). (A) Weights were monitored throughout infection, with final day 8 weights of individual mice presented separately. (B) Viral titres in the spleen, liver, lung and kidney of all mice were determined by FFA day 8pi. Each data point represents one mouse, with results from two repeat experiments combined.
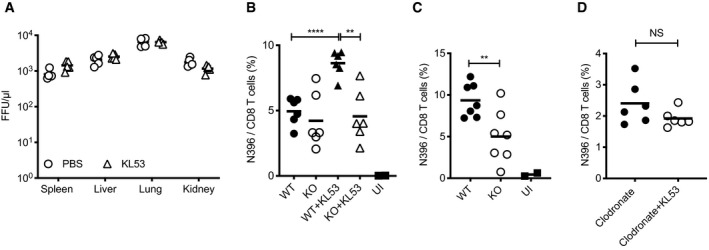
CD8 T cells in WT mice were depleted by administration of anti‐CD8 mAb 1 day prior to infection with 105 FFU LCMV. Anti‐N mAb KL53 or PBS control was passively transferred IP on days 1 and 3pi. Viral titres in the spleen, lung, liver and kidney of all mice were determined by FFA day 8pi.
Spleens from WT and KO mice +/‐ mAb KL53 day 8pi with 0.5 × 10⁵ FFU LCMV were analysed for the presence of LCMV N‐specific CTLs by staining with the class I N396‐404 tetramer.
Spleens from naïve WT and KO mice day 10pi with 0.5 × 10⁵ FFU LCMV were stained with N tetramer.
Macrophages were depleted in WT mice by administration of clodronate liposomes 1 day prior to infection with 0.5 × 10⁵ FFU LCMV. KL53 was administered on days 1 and 3pi, and N396‐specific CTLs in the spleen were measured day 8pi by tetramer staining.
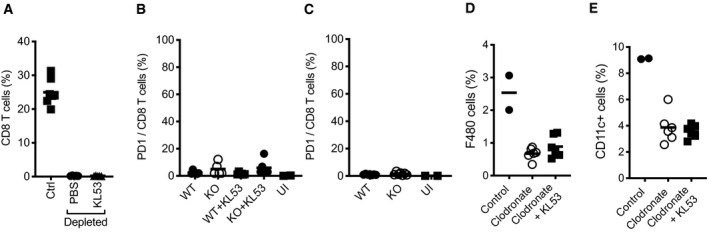
- A
Effective depletion of CD8 T cells in the spleen 9 days post anti‐CD8 mAb administration, in mice infected with LCMV and receiving either KL53 or PBS days 1 and day 3pi.
- B, C
Surface expression of PD‐1 on CD8 T cells of WT and KO mice either (B) day 8pi in the presence or absence of KL53 or (C) day 10pi in naïve mice only.
- D, E
Effective depletion of macrophages in the spleen using clodronate liposomes, as measured by surface expression of F480 (D) and CD11c (E) by flow cytometry.
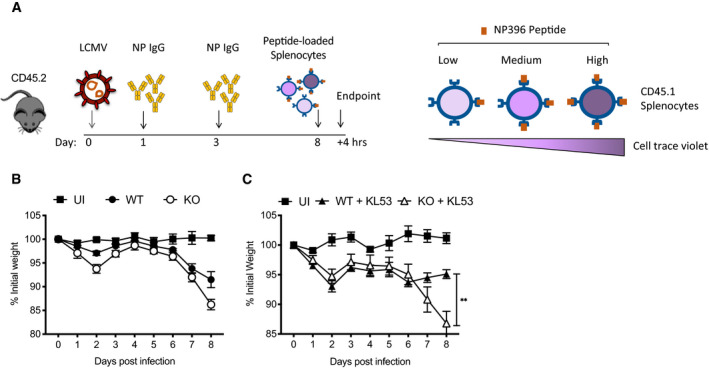
Timeline of in vivo killing protocol, and diagram of pulse‐labelling of CD45.1 splenocytes with different concentrations of N396 peptide and staining with cell trace violet.
Weights of WT and KO mice infected with LCMV which received pulsed‐labelled splenocytes 8dpi for in vivo killing experiment shown in Fig 4A.
Weights of WT and KO mice infected with LCMV then passively transferred with KL53 that received pulsed‐labelled splenocytes 8dpi for in vivo killing experiment shown in Fig 4B.
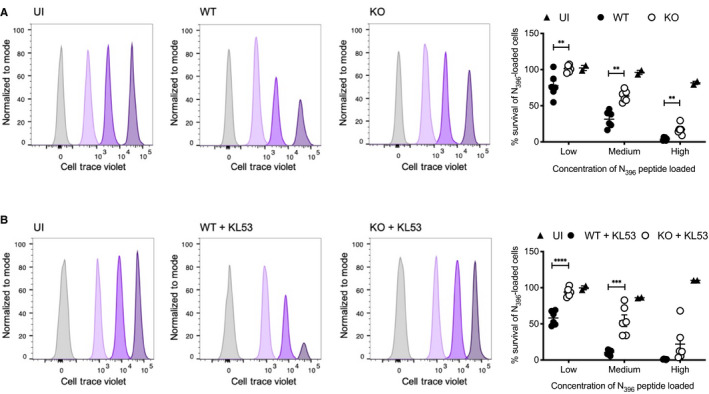
Splenocytes from uninfected CD45.1 mice, either pulsed with 3 concentrations of N peptide and cell trace violet (CTV) or unlabelled control cells, were transfused intravenously into WT and KO mice (CD45.2) that had been infected with 0.5 × 10⁵ FFU LCMV 8 days earlier. After 3 h, spleens from recipient mice were harvested and the proportion of CTV‐labelled CD45.1 cells was analysed by flow cytometry. Histograms from single representative uninfected (UI), WT and KO mice are presented, showing the proportion of CD45.1 cells remaining for each of the labelled fractions normalised to mode. Summary data from all individual mice in the same experiment are presented in associated scatter plot, showing the mean ± standard error.
Labelled splenocytes as for (A) were transfused into WT and KO mice that had been infected with LCMV 8 days earlier and received mAb KL53 on days 1 and 3pi. Flow cytometry histograms from single representative mice of each genotype. Summary data from all mice in the experiment are presented, showing the mean ± standard error.
References
-
- Battegay M, Cooper S, Althage A, Bänziger J, Hengartner H, Zinkernagel RM (1991) Quantification of lymphocytic choriomeningitis virus with an immunological focus assay in 24‐ or 96‐well plates. J Virol Methods 33: 191–198 - PubMed
-
- Battegay M, Moskophidis D, Waldner H, Bründler MA, Fung‐Leung WP, Mak TW, Hengartner H, Zinkernagel RM (1993) Impairment and delay of neutralizing antiviral antibody responses by virus‐specific cytotoxic T cells. J Immunol 151: 5408–5415 - PubMed
Publication types
MeSH terms
Substances
Grants and funding
LinkOut - more resources
Full Text Sources
Other Literature Sources
Molecular Biology Databases
