. 2021 Jan;62(1):100-110.
doi: 10.4111/icu.20200272. Epub 2020 Nov 24.

Transcriptional profiling of mouse cavernous pericytes under high-glucose conditions: Implications for diabetic angiopathy

Affiliations

Transcriptional profiling of mouse cavernous pericytes under high-glucose conditions: Implications for diabetic angiopathy

Guo Nan Yin et al. Investig Clin Urol. 2021 Jan.

Abstract

Purpose: Penile erection requires integrative interactions between vascular endothelial cells, pericytes, smooth muscle cells, and autonomic nerves. Furthermore, the importance of the role played by pericytes in the pathogenesis of angiopathy has only recently been appreciated. However, global gene expression in pericytes in diabetes mellitus-induced erectile dysfunction (DMED) remains unclear. We aimed to identify potential target genes related to DMED in mouse cavernous pericytes (MCPs).

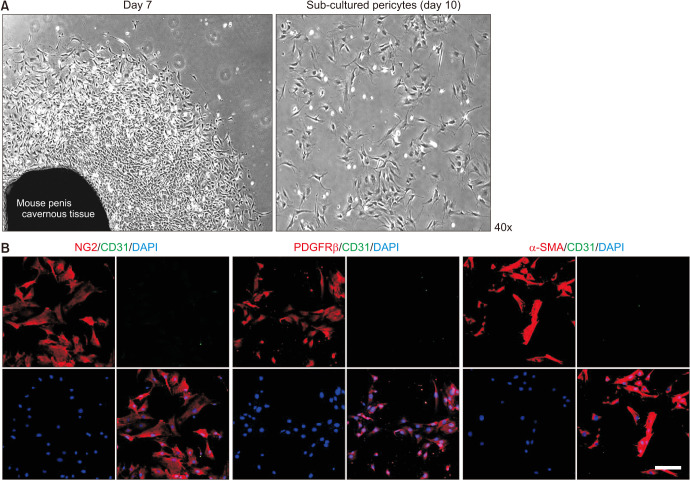
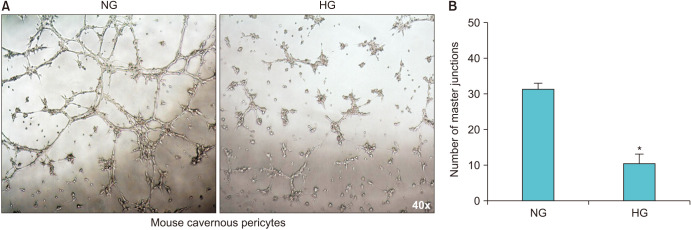
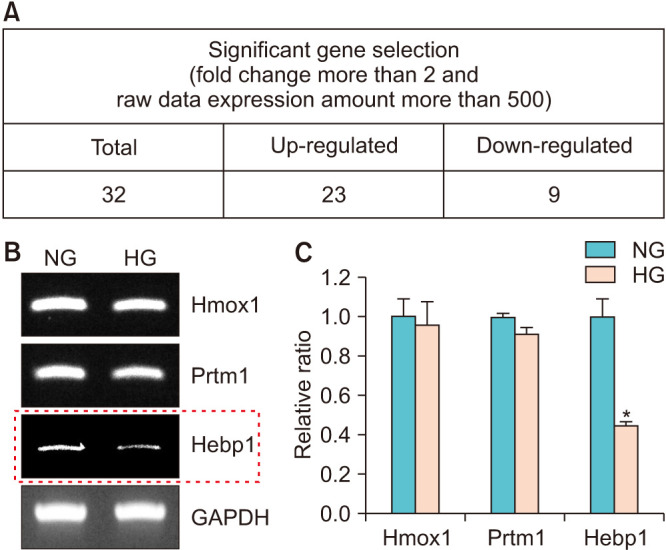
Materials and methods: Mouse cavernous tissue was allowed to settle under gravity in collagen I-coated dishes, and sprouted cells were subcultivated for experiments. To imitate diabetic conditions, MCPs were treated with normal-glucose (NG, 5 mM) or high-glucose (HG, 30 mM) media for 3 days. Microarray technology was used to evaluate gene expression profiles, and RT-PCR was used to validate sequencing data. Histological examinations and Western blot were used to validate final selected target genes related to DMED.

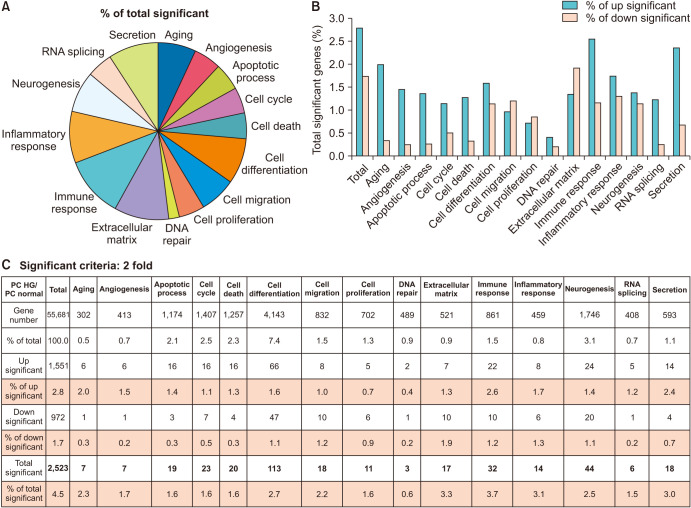
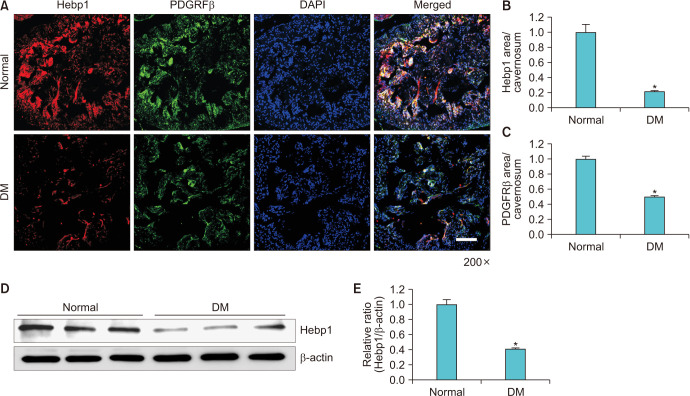
Results: Decreased tube formation and increased apoptosis were detected in MCPs exposed to the HG condition. As shown by microarray analysis, the gene expression profiles of MCPs exposed to the NG or HG condition differed. A total of 2,523 genes with significantly altered expression were classified into 15 major gene categories. After further screening based on gene expression and RT-PCR and histologic results, we found that Hebp1 gene expression was significantly diminished under the HG condition and in DM mice.

Conclusions: This gene profiling study provides new potential targets responsible for diabetes in MCPs. Validation studies suggest that Hebp1 may be a suitable biomarker for DMED.

Keywords: Diabetes mellitus; Erectile dysfunction; Gene expression; Microarray analysis.


Conflict of interest statement

The authors have nothing to disclose.

Figures

Fig. 1
Fig. 1. Isolation and characterization of MCPs. (A) Pericytes were sprouted from mouse cavernous tissues. Photograph showing a representative phage image (screen magnification, 40×, day 7 and day 10). (B) Characterization of MCPs by immunofluorescent staining using antibodies against pericyte markers (NG2 and PDGFRβ), endothelial cell marker (CD31), and smooth muscle α-actin (SMA, a smooth muscle cell and pericyte marker). Nuclei were labeled with DAPI. Scale bar indicates 50 µm. MCPs, mouse cavernous pericytes; DAPI, 4,6-diamidino-2-phenylindole.
Fig. 2
Fig. 2. Reduced tube formation in MCPs exposed to the HG condition. (A) MCPs were exposed to NG or HG conditions for 3 days. Tube formation assays were performed on Matrigel in 96-well dishes. Phase images of MCPs were taken 16 hours after plating (screen magnification, 40×). (B) Bars represent mean numbers of master junctions (±standard error) as determined by four separate experiments. *p<0.001 versus the NG group. NG, normal-glucose; HG, high-glucose; MCPs, mouse cavernous pericytes.
Fig. 3
Fig. 3. Increased apoptosis in MCPs under HG and diabetic conditions. (A) MCPs were exposed to NG or HG conditions for 3 days. TUNEL (green) assay in MCPs exposed to NG or HG conditions for 3 days. Nuclei were labeled with DAPI (blue). Scale bar=50 µm. (B) Percentages of apoptotic MCPs per field (screen magnification, 40×). Bars represent the mean values (±standard error) of four separate experiments. #p<0.01 versus the NG group. (C) TUNEL (green) assay and NG2 (a pericyte marker, red) double staining in normal and STZ-induced diabetic mice. Nuclei were labeled with DAPI (blue). Scale bar=50 µm. (D) Number of TUNEL-positive apoptotic MCPs. Bars represent the mean values (±standard error) from 4 mice per group. #p<0.01 versus the normal group. DAPI, 4,6-diamidino-2-phenylindole; TUNEL, terminal deoxynucleotidyl transferase-mediated deoxyuridine triphosphate nick end labeling; NG, normal-glucose; HG, high-glucose; DM, diabetes mellitus; MCPs, mouse cavernous pericytes.
Fig. 4
Fig. 4. Overview of differentially expressed genes under normal-glucose and high-glucose conditions. (A) Genes with significantly different expressions as determined by microarray analysis were classified into 15 gene ontology (GO) categories. (B, C) Percentages and number of genes showing substantial expressional changes (up- or down-regulated) after the application of more stringent selection criteria (≥2-fold change and raw data expression amount >500) to those genes showing expressional changes. HG, high-glucose.
Fig. 5
Fig. 5. Further screening of genes showing significant expressional changes and validation by RT-PCR. (A) Differentially expressed genes (DEGs) were selected after applying the two criteria mentioned in the legend of Fig. 3. (B) Three DEGs were evaluated in MCPs exposed to NG or HG conditions for 3 days. (C) Bars represent the mean values (±standard errors) of three separate experiments. *p<0.01 versus the NG group. Expression in the HG group is shown with respect to the corresponding expression in the NG group. NG, normal-glucose; HG, high-glucose; DEGs, differentially expressed genes; MCPs, mouse cavernous pericytes.
Fig. 6
Fig. 6. The down-regulation of Hebp1 under diabetic conditions. (A) Hebp1 (red) and PDGFRβ (a pericyte marker; green) staining in mouse cavernous tissues. Nuclei were labeled with DAPI (blue). Scale bar=100 µm. (B, C) Hebp1 expression and pericyte levels in cavernosum were quantified using Image J software. Bars represent the mean values (±standard errors) of three separate samples. *p<0.01 versus the NG group. (D) Representative western blots for Hebp1 in mouse cavernosum tissues. (E) Normalized band intensities (±standard errors) of three separate samples. *p<0.001 versus the normal group. Expression in the HG group is shown with respect to the corresponding expression in the NG group. PDGFRβ, platelet-derived growth factor receptor-β; DM, diabetes mellitus; NG, normal-glucose; HG, high-glucose.

References

    1. Jin HR, Kim WJ, Song JS, Choi MJ, Piao S, Shin SH, et al. Functional and morphologic characterizations of the diabetic mouse corpus cavernosum: comparison of a multiple low-dose and a single high-dose streptozotocin protocols. J Sex Med. 2009;6:3289–3304. - PubMed
    1. Musicki B, Burnett AL. Endothelial dysfunction in diabetic erectile dysfunction. Int J Impot Res. 2007;19:129–138. - PubMed
    1. Birbrair A, Zhang T, Wang ZM, Messi ML, Mintz A, Delbono O. Pericytes at the intersection between tissue regeneration and pathology. Clin Sci (Lond) 2015;128:81–93. - PMC - PubMed
    1. Díaz-Flores L, Gutiérrez R, Varela H, Rancel N, Valladares F. Microvascular pericytes: a review of their morphological and functional characteristics. Histol Histopathol. 1991;6:269–286. - PubMed
    1. Winkler EA, Bell RD, Zlokovic BV. Central nervous system pericytes in health and disease. Nat Neurosci. 2011;14:1398–1405. - PMC - PubMed

Publication types

MeSH terms