

Multiplexed CRISPR/CAS9-mediated engineering of pre-clinical mouse models bearing native human B cell receptors
- PMID: 33258500
- PMCID: PMC7809789
- DOI: 10.15252/embj.2020105926
Multiplexed CRISPR/CAS9-mediated engineering of pre-clinical mouse models bearing native human B cell receptors
Abstract
B-cell receptor (BCR) knock-in (KI) mouse models play an important role in vaccine development and fundamental immunological studies. However, the time required to generate them poses a bottleneck. Here we report a one-step CRISPR/Cas9 KI methodology to combine the insertion of human germline immunoglobulin heavy and light chains at their endogenous loci in mice. We validate this technology with the rapid generation of three BCR KI lines expressing native human precursors, instead of computationally inferred germline sequences, to HIV broadly neutralizing antibodies. We demonstrate that B cells from these mice are fully functional: upon transfer to congenic, wild type mice at controlled frequencies, such B cells can be primed by eOD-GT8 60mer, a germline-targeting immunogen currently in clinical trials, recruited to germinal centers, secrete class-switched antibodies, undergo somatic hypermutation, and differentiate into memory B cells. KI mice expressing functional human BCRs promise to accelerate the development of vaccines for HIV and other infectious diseases.
Keywords: B cell receptor; CRISPR; Cas9; HIV vaccine; antibody; knock-in.
© 2020 The Authors. Published under the terms of the CC BY 4.0 license.
Conflict of interest statement
The authors declare that they have no conflict of interest.
Figures
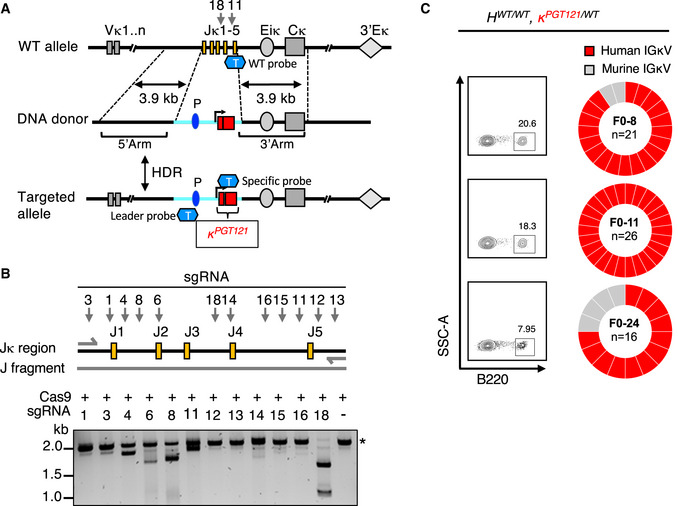
Strategy for the insertion of PGT121 pre‐rearranged VJ into the mouse Ig κ locus. Targeting DNA donor with 5ʹ (3.9 kb) and 3ʹ (3.9 kb) homology arms to the C57BL/6 WT mouse Ig κ locus, murine promoter, leader, and the human PGT121 light chain VJ sequences are located between two homology arms. Two sgRNAs, 18 and 11, were targeted at J4‐J5 region of Ig κ locus. CRISPR/Cas9‐mediated HDR leads to the insertion of the promoter and PGT121 sequences into the C57BL/6 mouse genome. V segments, enhancers, and the kappa constant regions are shown in gray and labeled appropriately. Yellow rectangles represent J segments; dark blue oval represents the Vκ4‐53 promoter (P); light blue line represents the inserted segment and red rectangles show the rearranged PGT121 VJ. “T” represents TaqMan probe. WT probes were used for the detection of WT allele, Leader probes were used for the detection of the 5ʹend of the insertion, the specific probes were used for the detection of pre‐arranged VJ insertion for PGT121 (probe sequences, see Appendix Table S1).
A fragment of genomic DNA (2.2 kb) was amplified by PCR and in vitro sgRNA‐guided Cas9‐mediated cleavage assay was performed with each of the sgRNAs. sgRNA‐targeting sites are indicated by arrows, genomic DNA size is indicated by asterisk.
B220+ single B cells from peripheral blood of three PGT121 LC KI naïve mice were sorted. B220+ B‐cell populations and their frequencies are shown in FACS plots (left panel). Ig light chains from single‐cell sorted B cells were PCR amplified and sequenced. The resulting IGLV libraries were compared to the PGT121 LC reference sequence. The pie charts indicate the frequency of IGLV sequences identical to human PGT121 (red) and mouse IGLV (gray).
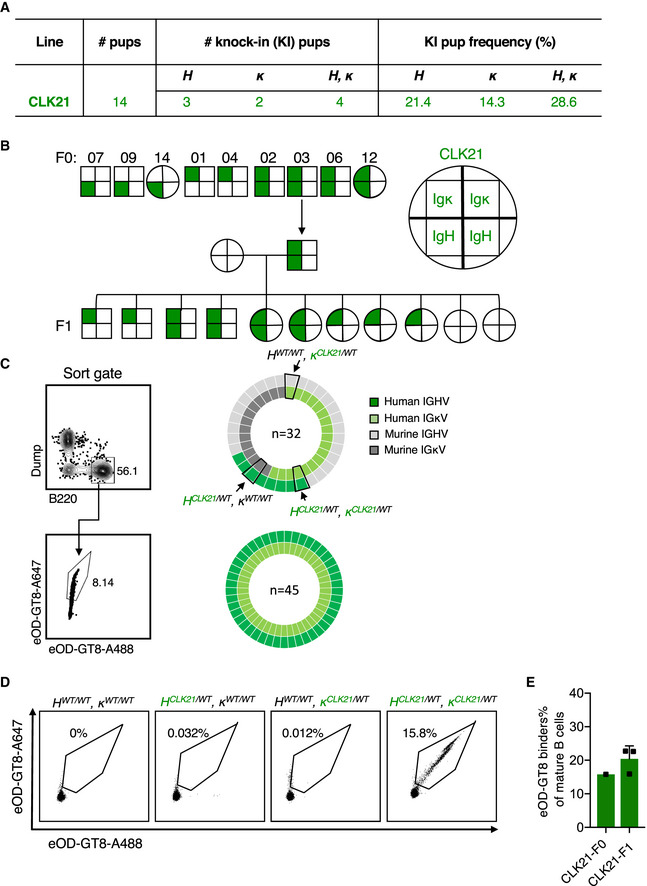
Table shows the total number of pups, the number or frequency of human HC‐, human LC‐, and human BCR KI pups after One‐step CRISPR/Cas9 microinjection of CLK21.
CLK21 KI mice F0 and F1 generations. Squares represent male mice and circles represent female mice. Upper halves of squares or circles represent Ig κ, and the lower halves represent Ig H, as shown in the schematic. F0 generation mice genotyping results showing 7, 9 and 14 are HCLK21/WTκWT/WT, 1 and 4 are HWT/WTκCLK21/WT, and 2, 3, 6, and 12 are HCLK21/WTκCLK21/WT. Mouse 3 was crossed with WT to obtain 11 F1 progeny: Five F1 mice are HWT/WT κCLK21/WT, four are HCLK21/WTκCLK21/WT and two are WT.
Single‐cell sequencing for naïve B cells from heterozygous CLK21 double KI mice. Left column shows the gating strategy for sorting naïve B cells (upper) and eOD‐GT8‐specific naïve B cells (lower). Right pie charts show the frequency of paired HC and LC sequences among total naïve B cells (upper) and eOD‐GT8‐specific naïve B cells (lower).
Germline‐targeting eOD‐GT8 binding activity of B cells from WT, HCLK21/WTκWT/WT, HWT/WT κCLK21/WT), and HCLK21/WT, κCLK21/WT KI mice. 8‐week‐old mice were detected by FACS. X and Y axes represent that BCR were stained with eOD‐GT8 tetramer conjugated with Alexa Fluor™ 488 and Alexa Fluor™ 647, respectively. Representative dots were gated from Scatter/Singlet/Live (SSL), B220+ IgM+ IgD+.
Quantification of eOD‐GT8 binding in CLK21 KI mice. X‐axis represents F0 (n = 1) and F1 (n = 3) KI animals, and the Y‐axis represents the percentage of eOD‐GT8 targeting binders in mature (IgM+ IgD+) B cells. Bars indicate mean ± SD from mice in each group.
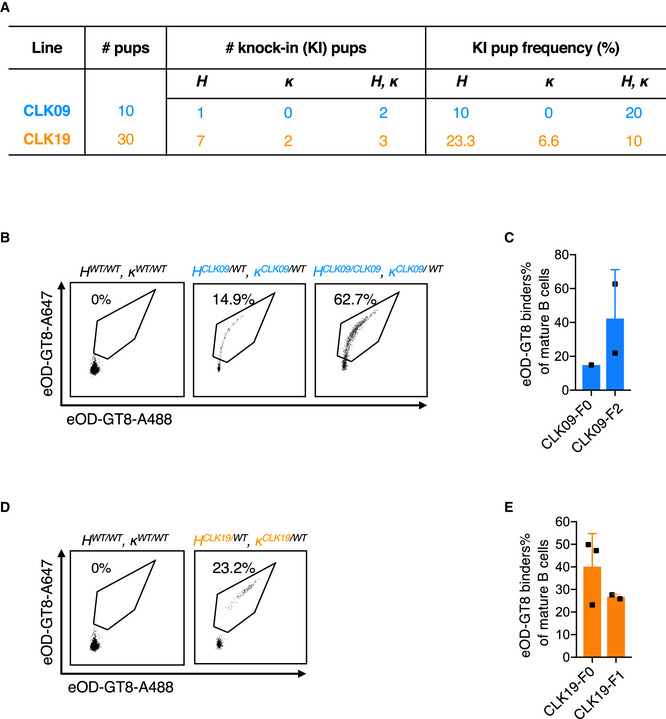
Table shows the total number of pups, the number or frequency of human HC‐, human LC‐and human BCR KI pups after One‐step CRISPR/Cas9 microinjection of CLK09 and CLK19.
Binding activity detection of heterozygous CLK09 human BCR KI mice to eOD‐GT8.8‐week‐old mice were detected by FACS. X‐axis and Y‐axis represent that BCR were stained with eOD‐GT8 tetramer conjugated with Alexa Fluor™ 488 and Alexa Fluor™ 647, respectively. Representative dots were gated as in Fig 2D.
Quantification of eOD‐GT8 targeting CLK09 KI mice. X‐axis represents F0 (n = 1) and F2 (n = 2) pups, Y‐axis represents as in Fig 2E. Bars indicate mean ± SD from mice in each group.
Binding activity detection of heterozygous and homozygous CLK19 human BCR KI mice to eOD‐GT8. 8‐week‐old mice were detected by FACS. X and Y axes represent as in (B).
Quantification of eOD‐GT8 binding in HCLK19/WT κCLK19/WT KI mice. X‐axis represents F0 (n = 3) and F1 (n = 2) animals, Y‐axis represents as in Fig 2E. Bars indicate mean ± SD from mice in each group.
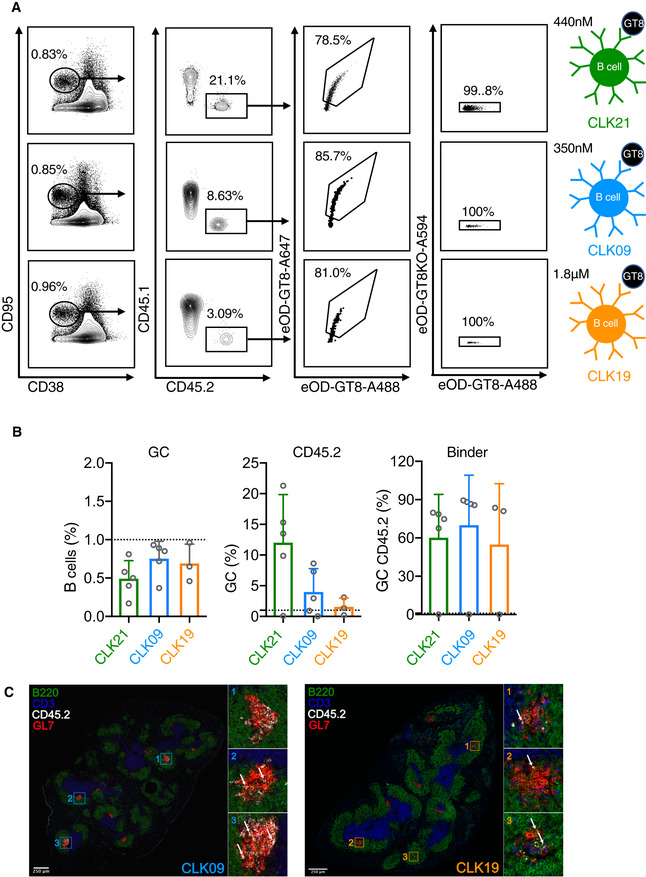
Germinal center (GC) response induced by eOD‐GT8 60mer immunization in WT mice adoptively transferred with CD45.2 B cells from CLK21, CLK09, CLK19 mice on Day 8. 8‐week‐old CD45.1 mice were transferred with 5 × 10⁵ (1 in 104) of isolated CD45.2 B cells from CLK21, CLK09 and CLK19 KI one day before the immunization with eOD‐GT8 60mer, on day 8, the splenocytes were isolated and detected by FACS. First column shows the frequency of total GC (CD38loCD95+) among B cells gated from SSL, the second column shows the frequency of CD45.2 B cells among total GC, third column shows the frequency of eOD‐GT8 binding B cells among GC CD45.2 B cells; fourth column shows the frequency of eOD‐GT8 binding B cells that do not bind the VRC01 epitope‐knockout, eOD‐GT8‐KO; diagrams at right show eOD‐GT8 KD affinities for CLK21 (green, affinity 440 nM), CLK09 (blue, affinity 350 nM) and CLK19 (orange, affinity 1.8 µM).
Quantification of GCs, CD45.2 cells and CD45.2 binder frequency in adoptively transferred mice. X‐axis represents CLK21, CLK09 and CLK19 adoptively transferred mice group that immunized with eOD‐GT8 60mer. Y‐axis represents the frequency of total GC (left) among B cells, the frequency of CD45.2 cells within GCs and the frequency of eOD‐GT8‐CD45.2 binders. Each circle represents one mouse. n = 5 mice/group for CLK21 and CLK09, n = 3 mice/group for CLK19. Bars indicate geometric mean and geometric SD from mice in each group.
Immunohistochemistry of Day 8 spleen sections for host mouse receiving 5 × 10⁵ isolated CD45.2 B cells from CLK09 (left) and CLK19 (right) KI mouse. Green, B220; Blue, CD3; White, CD45.2; Red, GL7. White arrows indicate the CD45.2 B cells.

Precursor frequency in CLK21, CLK09 and CLK19 adoptively transferred mice. 8‐week‐old CD45.1 mice were adoptively transferred with 5 × 10⁵, 1 × 10⁵ or 2 × 10⁴ CD45.2 B cells from CLK21, CLK09 or CLK19 KI mice 1 day before immunization with eOD‐GT8 60mer. 12 h post‐adopt transfer, splenocytes were isolated and detected by FACS. X‐axis represents the cell number of transferred CD45.2 B cells, y‐axis represents the precursor frequency which is defined as (Number of CD45.2 binders)/(Number of B cells) for three lines. Each circle represents each mouse in each group. n = 2–4 mice/group for CLK21 and CLK09; n = 3 mice/group for CLK19. Bars indicate mean ± SD from mice in each group.
CD45.2 frequency within GCs on Day 8 in CLK adoptively transferred mice with different precursor frequency. Adoptively transferred mice with different precursor frequency were immunized with eOD‐GT8 60mer, on Day 8, the splenocytes were isolated and the CD45.2 populations were detected by FACS with the marker SSL+B220+CD95+CD38−CD45.2+. Gated plots represent the CD45.2 frequency within GCs.
Quantification of the frequency of CD45.2 and CD45.2 binders. Upper graph shows the quantification of CD45.2 frequency among GC in three adoptively transferred mouse models after the immunization of eOD‐GT8 60mer. The graphs below show the frequency of GC CD45.2 binders. X‐axis represents the different precursor frequency group. Y‐axis represents the percentage of GC (upper) and GC CD45.2 B cells (lower), respectively. Each circle represents one mouse. Mice from two independently repeated experiments were analyzed, n = 5–10 mice/group. Bars indicate geometric mean and geometric SD from mice in each group. Significant differences were calculated with Student’s t‐test and shown as: P > 0.05, no statistical significance (ns), *P < 0.05, **P < 0.01, ***P < 0.001, ****P < 0.0001. All P value analyses were calculated by GraphPad Prism V8.0.
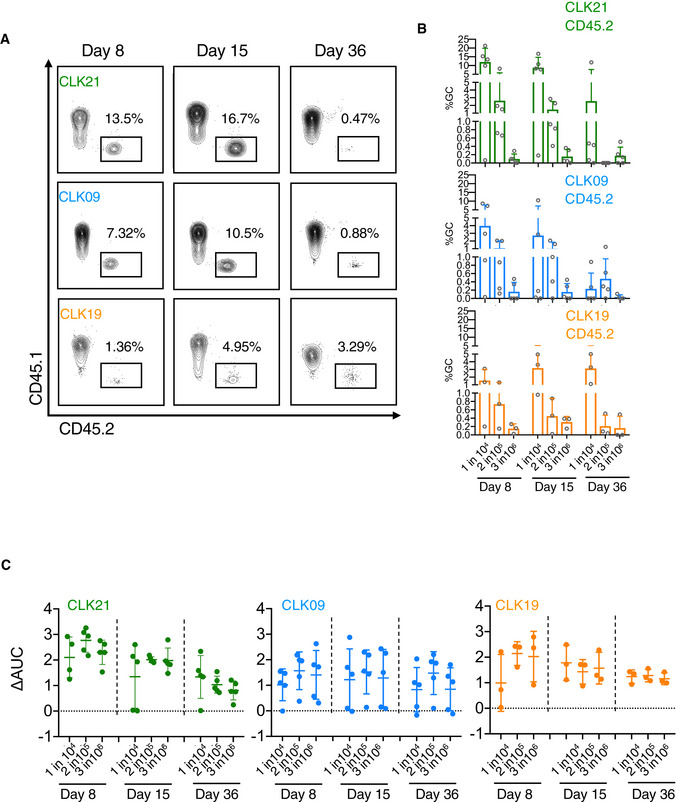
CD45.2 frequency among GCs induced by eOD‐GT8 60mer at different time points. Adoptively transferred mice with 1 in 104 of precursor frequency were immunized with eOD‐GT8 60mer. On days 8, 15 and 36, the splenic B cells were isolated to measure the CD45.2 cell frequency in GC B cells by FACS using the markers as in Fig 5B mentioned above by FACS. Gated plots represent the CD45.2 frequency among GC B cells.
Quantification of CD45.2 frequency among GCs at three time points. X‐axis represents adoptively transferred mice groups with different precursor frequencies (1 in 104, 2 in 105, 3 in 106) at three time points, Y‐axis represents CD45.2 frequency among GC. Each circle represents one mouse. For CLK21 and CLK09 panel, n = 5 mice in each group. For CLK19 panel, n = 3 mice in each group. Bars indicate mean ± SD from mice in each group.
IgG titers detected by ELISA. eOD‐GT8 or eOD‐GT8 KO soluble proteins were used to coat ELISA plates. Sera from adoptively transferred mice at different time points were used to detect by ELISA. Bars indicate geometric mean and geometric SD from mice in each group. For CLK21 and CLK09 panel, n = 5 mice in each group. For CLK19 panel, n = 3 mice in each group. X‐axis represents precursor frequency, and Y‐axis represents the change of area under curve (AUCcoated eOD‐GT8 − AUCcoated eOD‐GT8 KO). Each circle represents one mouse.

Phylogenetic trees of CLK21, CLK09 and CLK19. These trees were generated using paired aminoacidic sequences solely isolated at Day 36. Single paired amino acid sequences were joined and aligned using MUSCLE (Price et al, 2010). Clonal lineage trees were generated using FastTree and a Jones Taylor Thornton model for AA evolution (Jones et al, 1992). The length of the branches reflects sequence distance.
SHM are detectable in both IGHV and IGLV at Day 36 post‐immunization with eOD‐GT8 60mer. nt represents “nucleotide”, aa represents “amino acid”.
Hotspot analysis. The quality of mutations was assessed via hotspots analysis for both heavy (left) and light (right) antibody chains. Weblogos were generated via publicly available online tools (
https://weblogo.berkeley.edu/logo.cgi ).Mature bnAbs‐like aa VH1‐2 mutations in CLK B cells at Day 36. The red diagonal line indicates a 100% efficiency of VRC01‐class bnAb‐type VH1‐2 mutations. The black stair step indicates a calculated VH1‐2 antigen‐agnostic mutation distribution, which might include mutations that improve expression or stabilize Ab structure (Briney et al, 2016). Shaded area indicates that no mutation is positive in this region.
References
-
- Abbott RK, Lee JH, Menis S, Skog P, Rossi M, Ota T, Kulp DW, Bhullar D, Kalyuzhniy O, Havenar‐Daughton C et al (2018) Precursor frequency and affinity determine B Cell competitive fitness in germinal centers, tested with germline‐targeting HIV vaccine immunogens. Immunity 48: 133–146.e6 - PMC - PubMed
-
- Alt FW, Oltz EM, Young F, Gorman J, Taccioli G, Chen J (1992) VDJ recombination. Immunol Today 13: 306–314 - PubMed
-
- Benschop RJ, Aviszus K, Zhang X, Manser T, Cambier JC, Wysocki LJ (2001) Activation and anergy in bone marrow B cells of a novel immunoglobulin transgenic mouse that is both hapten specific and autoreactive. Immunity 14: 33–43 - PubMed
-
- Bloom DD, Davignon JL, Retter MW, Shlomchik MJ, Pisetsky DS, Cohen PL, Eisenberg RA, Clarke SH (1993) V region gene analysis of anti‐Sm hybridomas from MRL/Mp‐lpr/lpr mice. J Immunol 150: 1591–1610 - PubMed
Publication types
MeSH terms
Substances
Grants and funding
LinkOut - more resources
Full Text Sources
Other Literature Sources
Molecular Biology Databases
