. 2021 Jan 19;131(2):e142468.
doi: 10.1172/JCI142468.

TREM-1 orchestrates angiotensin II-induced monocyte trafficking and promotes experimental abdominal aortic aneurysm

Affiliations

TREM-1 orchestrates angiotensin II-induced monocyte trafficking and promotes experimental abdominal aortic aneurysm

Marie Vandestienne et al. J Clin Invest. .

Abstract

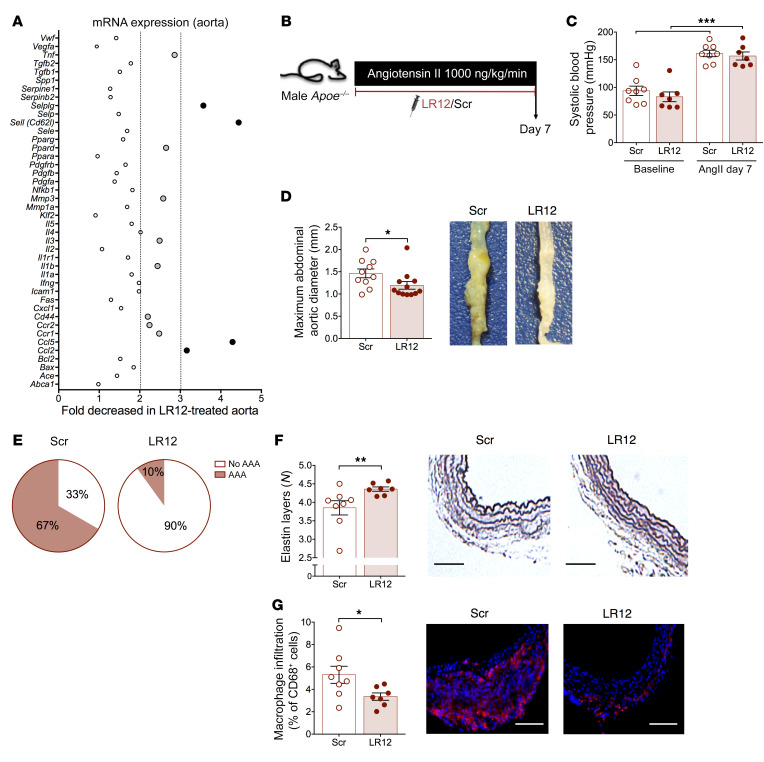
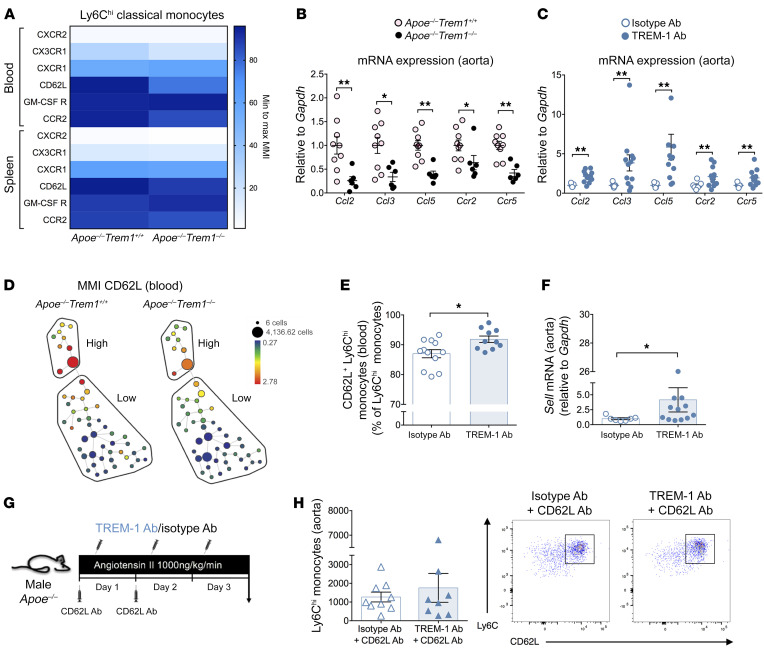
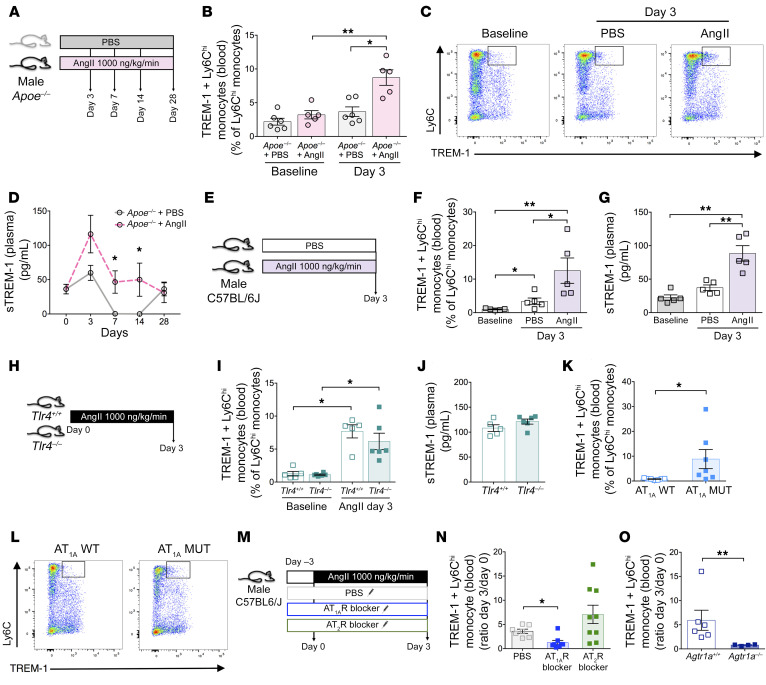
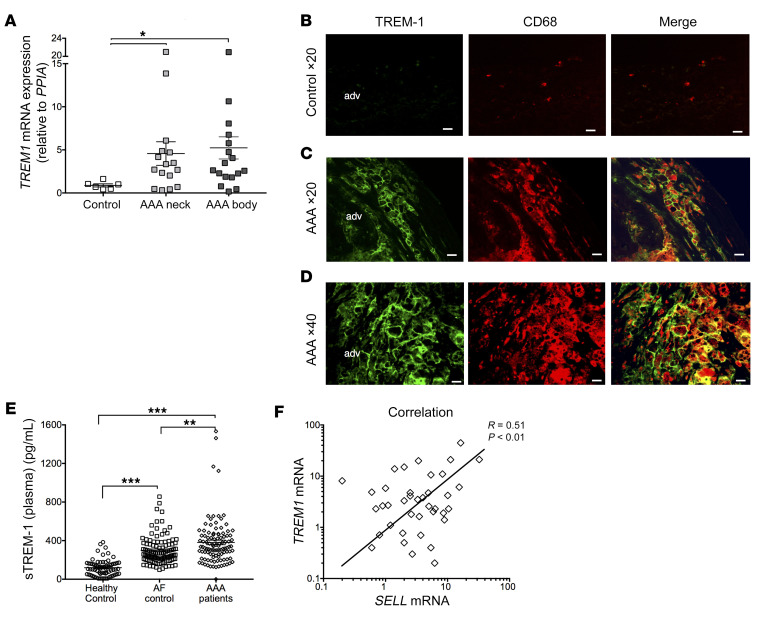
The triggering receptor expressed on myeloid cells 1 (TREM-1) drives inflammatory responses in several cardiovascular diseases but its role in abdominal aortic aneurysm (AAA) remains unknown. Our objective was to explore the role of TREM-1 in a mouse model of angiotensin II-induced (AngII-induced) AAA. TREM-1 expression was detected in mouse aortic aneurysm and colocalized with macrophages. Trem1 gene deletion (Apoe-/-Trem1-/-), as well as TREM-1 pharmacological blockade with LR-12 peptide, limited both AAA development and severity. Trem1 gene deletion attenuated the inflammatory response in the aorta, with a reduction of Il1b, Tnfa, Mmp2, and Mmp9 mRNA expression, and led to a decreased macrophage content due to a reduction of Ly6Chi classical monocyte trafficking. Conversely, antibody-mediated TREM-1 stimulation exacerbated Ly6Chi monocyte aorta infiltration after AngII infusion through CD62L upregulation and promoted proinflammatory signature in the aorta, resulting in worsening AAA severity. AngII infusion stimulated TREM-1 expression and activation on Ly6Chi monocytes through AngII receptor type I (AT1R). In human AAA, TREM-1 was detected and TREM1 mRNA expression correlated with SELL mRNA expression. Finally, circulating levels of sTREM-1 were increased in patients with AAA when compared with patients without AAA. In conclusion, TREM-1 is involved in AAA pathophysiology and may represent a promising therapeutic target in humans.

Keywords: Cell migration/adhesion; Inflammation; Innate immunity; Monocytes; Vascular Biology.


Conflict of interest statement

Conflict of interest: MD is cofounder of INOTREM, a company developing TREM-1 inhibitors. A Boufenzer, MD, and HAO applied a patent on the measurement of plasma sTREM-1 concentration to predict outcome in cardiovascular diseases and applied for a patent on therapeutic strategies using inhibiting peptides derived from TREM-1 (patent no. WO2014037565A2; Inhibiting peptides derived from triggering receptor expressed on myeloid cells-1 (trem-1) trem-like transcript 1 (tlt-1) and uses thereof).

Figures

Figure 1
Figure 1. Trem1 genetic deletion reduces aneurysm development in angiotensin II–induced AAA.
(A) Hypercholesterolemic Apoe–/– mice were implanted with subcutaneous osmotic minipumps infusing PBS (control group) or AngII (1000 ng/kg/min). Quantification of Trem1 mRNA expression in the aorta at day 3 by RT-qPCR (n = 6 in PBS-infused group; n = 5 in AngII-infused group). (B) Immunofluorescence staining in the aortic wall of PBS- (left) or AngII-infused (right) animals at day 3, DAPI (blue), TREM-1 (red), and CD68 (green). Scale bars: 50 μm. (C) Apoe–/–Trem1+/+ and Apoe–/–Trem1–/– mice were implanted with subcutaneous osmotic minipumps infusing AngII (1000 ng/kg/min). Analyses were done at different time points following AngII infusion. (D) TREM-1 expression on circulating CD11b+Ly6G monocytes of Apoe–/–Trem1+/+ (pink) and Apoe–/–Trem1–/– mice (black) at day 3 after AngII infusion. (E) Quantitative analysis and representative photomicrographs of the maximal aortic diameter at day 28 (n = 11 in Apoe–/–Trem1+/+ group, n = 9 in Apoe–/–Trem1–/– group). Scale bars: 1 mm. (F) Quantification of the number of elastin layers in the aortic wall by orcein staining at day 7 (n = 7/group). Scale bars: 50 μm. (G) FMT quantification of MMP-2, -3, -9, and -13 activity in aorta at day 7 (n = 4 in Apoe–/–Trem1+/+ group, n = 3 in Apoe–/–Trem1–/– group). (H) Quantification of Il1b, Tnfa, Mmp2, and Mmp9 mRNA expression in aorta at day 7 by RT-qPCR (n = 9 in Apoe–/–Trem1+/+ group, n = 6 in Apoe–/–Trem1–/– group). (I) Quantification and representative photomicrographs of CD68+ macrophages in the aorta at day 7 (n = 7/group). Scale bars: 50 μm. (J) Flow cytometry quantification of Ly6Chi classical monocyte infiltration in the aortic wall at day 3 (n = 5 in each group). (K) Flow cytometry quantification of circulating Ly6Chi classical monocytes at day 3 (n = 8 in Apoe–/–Trem1+/+ group, n = 7 in Apoe–/–Trem1–/– group). Kruskal-Wallis test, Mann-Whitney test; *P < 0.05, ** P < 0.01, ***P < 0.001.
Figure 2
Figure 2. TREM-1 pharmacologic inhibition protects against experimental AAA.
(A) Apoe–/– mice were treated intraperitoneally with a TREM-1 inhibitory peptide (LR12) or a control scramble peptide (Scr) (150 μg/mice/d) for 7 days. MicroArray gene analysis was performed in the whole aorta and LR12-induced gene expression modulation was expressed as fold decreased in LR12-treated group. Light gray dots identified genes whose expression was statistically different between scramble- and LR12-treated mice with a ratio between 2 and 3. Black dots identified genes whose expression was statistically different between scramble- and LR12-treated mice with a ratio greater than 3. (B) Apoe–/– mice were implanted with subcutaneous osmotic minipumps infusing AngII (1000 ng/kg/min) and treated intraperitoneally with a TREM-1 inhibitory peptide (LR12) or a control scramble peptide (Scramble) (150 μg/mice/d) for 7 days. (C) Systolic blood pressure of scramble- or LR12-treated Apoe–/– mice at baseline and after AngII infusion (1000 ng/kg/min) (n = 7–8/group). (D) Quantitative analysis and representative photomicrographs of the maximal abdominal aortic diameter (n = 10 in the scramble-treated group, n = 12 in the LR12-treated group) and (E) AAA incidence. Scale bars: 1 mm. (F) Histologic quantification of the number of elastin layers in the aortic wall by orcein staining. Scale bars: 100 μm. (G) Quantification and representative photomicrographs of CD68+ macrophages in the aorta (n = 8 in the scramble-treated group, n = 7 in the LR12-treated group). Scale bars: 100 μm. Results are displayed as the mean ± SEM. *P < 0.05, **P < 0.01, ***P < 0.001, by Mann-Whitney test.
Figure 3
Figure 3. TREM-1 pharmacologic stimulation worsens angiotensin-II–induced AAA.
(A) Apoe–/– mice were implanted with subcutaneous osmotic minipumps infusing AngII (1000 ng/kg/min), and were injected intraperitoneally with an agonist TREM-1 monoclonal antibody (TREM-1 Ab) or isotype control (isotype Ab) (200 μg/kg/d), every day for 3 or 7 days. (B) Quantification of IL-1β, TNF-α, and IL-6 production (ELISA) by LPS/INF-γ–stimulated splenocytes. (C) Quantification of sTREM-1 plasma levels at day 3 following AngII infusion and TREM-1 Ab or isotype Ab treatment (n = 9/group). (D) Quantitative analysis and representative photomicrographs of the maximal abdominal aortic diameter at day 28 (n = 12 in the isotype Ab group, n = 10 in TREM-1 Ab group). (E) AAA incidence at day 28. Scale bars: 1 mm. (F) Quantification and representative photomicrographs of the number of elastin layers in the aortic wall after Orcein staining at day 7 (n = 5/group). Scale bars: 50 μm. (G) Quantification of Il1b, Tnfa, Mmp2, and Mmp9 mRNA expression in aorta at day 7 by RT-qPCR (n = 7 in the isotype Ab group, n = 12 in TREM-1 Ab group). (H) Flow cytometry quantification and representative dot plots of Ly6Chi classical monocyte number into the aortic wall and (I) in the blood (n = 12 in the isotype Ab group and n = 10 in the TREM-1 Ab group). Results are displayed as the mean ± SEM. *P < 0.05, **P < 0.01, ****P < 0.0001, by Mann-Whitney test.
Figure 4
Figure 4. TREM-1 modulates Ly6Chi classical monocyte trafficking and recruitment in the aortic wall following AngII stimulation via CD62L.
(A) Heatmap representation of chemokine receptors and adhesion molecule expression (expressed as mean metal intensity [MMI]), measured by mass cytometry on classical monocytes in blood and spleen of Apoe–/–Trem1+/+ and Apoe–/–Trem1–/– mice 1 day after AngII infusion (n = 4/group). Quantification of Ccl2, Ccl3, Ccl5, Ccr2, and Ccr5 mRNA expression in aortas of AngII-infused (B) Apoe–/–Trem1+/+ and Apoe–/–Trem1–/– mice (n = 9 in Apoe–/–Trem1+/+ group, n = 6 in Apoe–/–Trem1–/– group) and (C) isotype-treated or TREM-1 Ab–treated Apoe–/– (n = 7 in isotype Ab group, n = 12 in TREM-1 Ab group) at day 7 after AngII infusion by RT-qPCR. (D) Representative SPADE tree plots of CD62L expression on classical Ly6Chi monocytes (High) and Ly6Clo monocytes (Low) in Apoe–/–Trem1+/+ and Apoe–/–Trem1–/– after 1 day of AngII infusion. (E) Flow cytometry analysis of CD62L expression on Ly6Chi classical monocytes (n = 12 in isotype Ab group, n = 10 in TREM-1 Ab group) (F) Quantification of Sell mRNA expression by RT-qPCR in the aorta of TREM-1 Ab–treated or isotype Ab-treated Apoe–/– mice after 3 days of AngII infusion (n = 7 in isotype Ab group, n = 12 in TREM-1 Ab group). (GH) Apoe–/– mice were implanted with subcutaneous osmotic minipumps releasing AngII (1000 ng/kg/min) and were treated intravenously with a neutralizing anti–CD62L antibody (CD62L Ab, 100 μg/mice/d) during the first 2 days and received intraperitoneal injection of either an anti-TREM-1 Ab or an isotype Ab (control) for 3 days. (G) CD62L blockade was confirmed on Ly6Chi classical monocytes in the blood. (H) Quantification and representative dot plot of Ly6Chi classical monocyte infiltration in the aorta by flow cytometry after 3 days of AngII infusion (n = 9 in isotype Ab group, n = 8 in TREM-1 Ab group). Results are displayed as the mean ± SEM. *P < 0.05, **P < 0.01, by Mann-Whitney test.
Figure 5
Figure 5. Angiotensin II induces TREM-1 expression on Ly6Chi classical monocytes and sTREM-1 release through AT1R signaling, in a TLR4-independent manner.
(AD) Apoe–/– mice were implanted with subcutaneous osmotic minipumps infusing PBS or AngII (1000 ng/kg/min). (BC) Flow cytometry analysis and representative dot plots of TREM-1 expression on circulating Ly6Chi classical monocytes (n = 5–6/group). (D) Kinetics of plasma soluble TREM-1 following AngII infusion detected by ELISA. (EG) C57BL/6J mice were implanted with subcutaneous osmotic minipumps infusing PBS or AngII. (F) Flow cytometry analysis of TREM-1 expression on Ly6Chi classical monocytes in the blood and (G) quantification of plasma soluble TREM-1 by ELISA 3 days after AngII infusion (n = 5/group). (HJ) Tlr4+/+ and Tlr4–/– mice were implanted with subcutaneous osmotic minipumps infusing AngII. (I) Flow cytometry analysis of membrane TREM-1 expression on Ly6Chi classical monocytes and (J) quantification of plasma sTREM-1 by ELISA at day 3 (n = 5 in Tlr4+/+ group, n = 6 in Tlr4–/– group). (KL) Flow cytometry analysis and representative dot plots of TREM-1 expression on circulating Ly6Chi classical monocytes in AT1A MUT mice (n = 7/group). (MN) C57BL/6J mice were injected intraperitoneally 3 days with PBS, AT1R blocker (Losartan), or AT2R blocker (PD123,319) prior to subcutaneous osmotic minipumps implantation infusing AngII for another 3 days. (N) Variation of TREM-1 membrane expression after 3 days of AngII infusion on Ly6Chi classical monocytes was quantified by flow cytometry (n = 7 in PBS group, n = 8 in AT1R blocker group, n = 9 in AT2R blocker group). (O) Flow cytometry analysis of the variation of TREM-1 expression on Ly6Chi classical monocytes after 3 days of AngII infusion in Agtr1a+/+ and Agtr1a–/– mice (n = 6 in Agtr1a+/+, n = 4 in Agtr1a–/–/group/time point). Results are displayed as the mean ± SEM. *P < 0.05, **P < 0.01, by Mann-Whitney test (B, D, F, G, I, K, and O), and by Kruskal-Wallis test (N).
Figure 6
Figure 6. TREM-1 expression in human AAA.
(A) TREM-1 mRNA expression was quantified in normal aorta (from organ donors) and in AAA (neck and body) by RT-qPCR. TREM-1 mRNA expression was significantly higher in AAA tissues than in normal aorta tissue. (B) Immunofluorescence staining confirmed that TREM-1 is not expressed in normal aorta (CD) but is strongly expressed in AAA tissues and localizes with CD68+ macrophages. Scale bars: 100 μm. (E) Soluble TREM-1 levels were quantified by ELISA in the plasma of healthy volunteers or in the group of patients with AAA or AF. (F) Correlation between TREM1 and SELL mRNA in aorta (pooled normal and AAA). Results are displayed as the mean ± SEM. *P < 0.05, **P < 0.01, ***P < 0.001, by Kruskal-Wallis test (A and E) and Pearson correlation test (F).

References

    1. Nordon IM, et al. Pathophysiology and epidemiology of abdominal aortic aneurysms. Nat Rev Cardiol. 2011;8(2):92–102. doi: 10.1038/nrcardio.2010.180. - DOI - PubMed
    1. Davis FM, et al. Abdominal aortic aneurysm: novel mechanisms and therapies. Curr Opin Cardiol. 2015;30(6):566–573. doi: 10.1097/HCO.0000000000000216. - DOI - PMC - PubMed
    1. Mellak S, et al. Angiotensin II mobilizes spleen monocytes to promote the development of abdominal aortic aneurysm in Apoe–/– mice. Arterioscler Thromb Vasc Biol. 2015;35(2):378–388. doi: 10.1161/ATVBAHA.114.304389. - DOI - PubMed
    1. Ye P, et al. GM-CSF contributes to aortic aneurysms resulting from SMAD3 deficiency. J Clin Invest. 2013;123(5):2317–2331. doi: 10.1172/JCI67356. - DOI - PMC - PubMed
    1. Iida Y, et al. Peptide inhibitor of CXCL4-CCL5 heterodimer formation, MKEY, inhibits experimental aortic aneurysm initiation and progression. Arterioscler Thromb Vasc Biol. 2013;33(4):718–726. doi: 10.1161/ATVBAHA.112.300329. - DOI - PMC - PubMed

Publication types

MeSH terms