. 2021 Jan 4;220(1):e202004179.
doi: 10.1083/jcb.202004179.

A non-canonical Hedgehog pathway initiates ciliogenesis and autophagy

Affiliations

A non-canonical Hedgehog pathway initiates ciliogenesis and autophagy

Tara Akhshi et al. J Cell Biol. .

Abstract

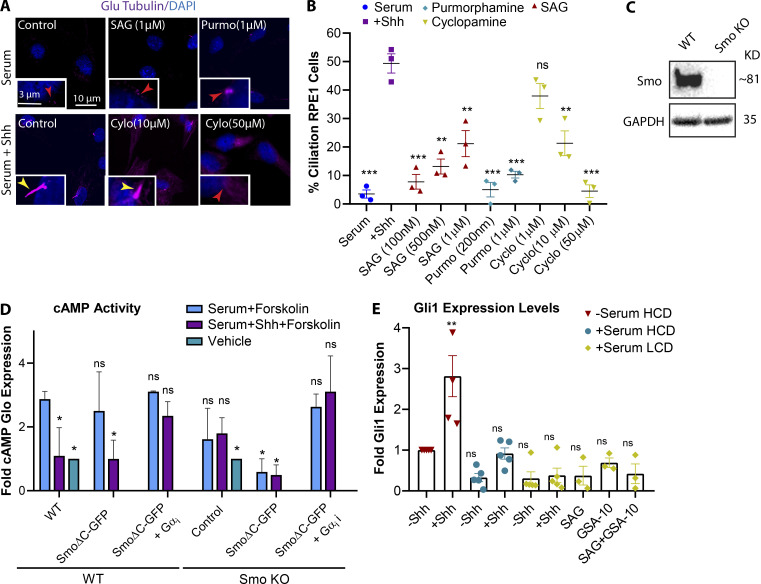
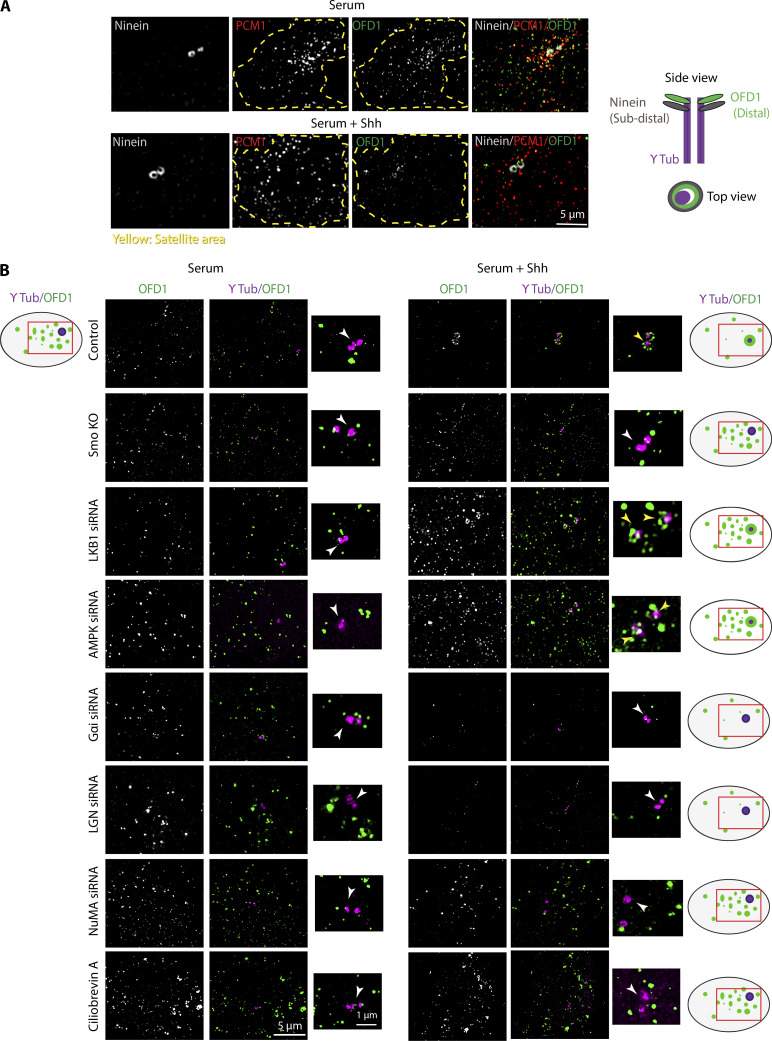
Primary cilia function as critical signaling hubs whose absence leads to severe disorders collectively known as ciliopathies; our knowledge of ciliogenesis remains limited. We show that Smo induces ciliogenesis through two distinct yet essential noncanonical Hh pathways in several cell types, including neurons. Surprisingly, ligand activation of Smo induces autophagy via an LKB1-AMPK axis to remove the satellite pool of OFD1. This is required, but not sufficient, for ciliogenesis. Additionally, Smo activates the Gαi-LGN-NuMA-dynein axis, causing accumulation of a portion of OFD1 at centrioles in early ciliogenesis. Both pathways are critical for redistribution of BBS4 from satellites to centrioles, which is also mediated by OFD1 centriolar translocation. Notably, different Smo agonists, which activate Smo distinctly, activate one or the other of these pathways; only in combination they recapitulate the activity of Hh ligand. These studies provide new insight into physiological stimuli (Hh) that activate autophagy and promote ciliogenesis and introduce a novel role for the Gαi-LGN-NuMA-dynein complex in this process.


Figures

Figure S1.
Figure S1.
Hh activation induces ciliogenesis in RPE1 cells and primary neurons. (A) Schematic indicating canonical and noncanonical Hh pathways. (B) Immunofluorescence images of RPE1 Ptch1:GFP cells treated with Shh. Ptch1 localized to cilia when Hh pathway was inactive and was removed from cilia upon Hh activation. (C) Immunofluorescence stitched images of RPE1 cells plated at different cell densities indicating a bigger field of view for comparison between different cell densities. (D) Immunofluorescence images of neurons from mouse cortex indicating staining with adenylate cyclase III (AC3) as another ciliary marker. (E) Immunofluorescence images of neurons and “nonneuron” cells in the same culture indicating lack or presence of YAP1 expression in neurons and nonneurons, respectively. Images are stitched to provide a bigger field of view. Yellow and red numbers and arrows indicate the presence or absence of a cilium, respectively.
Figure 1.
Figure 1.
Hh activation induces ciliogenesis at LCD and in the presence of serum. (A) RPE1 cells plated at different cell densities and different conditions as indicated. The number of cells plated/cm2 is indicated. Cells were stained for acetylated (Ace) Tubulin as a ciliary marker. (B) Quantification of ciliated cells at different cell densities. (C) Hh-mediated cilia indicating different ciliary markers localized at cilia. (D) Immunofluorescence images of human fibroblast cells at LCD and treated with Shh (24 h). (E) Quantification of human fibroblast ciliated cells at LCD upon Shh treatment. (F) Immunofluorescence images of neurons from mouse cortex indicating a big field of view (stitches), as well as a higher magnification for ciliogenesis in cells with or without Hh activation. Hh was activated using either Shh CM or dual treatment of SAG plus GSA-10 for 24 h. (G) Quantification of ciliated cells at different conditions as indicated. **, P < 0.001; ***, P < 0.0001 comparing cells with Shh to those without Shh for the same condition. Number of cells (n) used for each experiment is listed in Table S4. Yellow and red numbers and arrows indicate the presence or absence of cilium, respectively.
Figure 2.
Figure 2.
Noncanonical Hh promotes ciliogenesis through Smo activity. (A) Immunofluorescence images of RPE1 cells at LCD supplemented with serum and treated with Shh CM (24 h) containing different concentrations of Shh ligand as indicated. (B) Quantification of Shh ligand concentrations and percentage of ciliated cells for each Shh CM as indicated. (C) Immunofluorescence images of RPE1 cells plated at LCD supplemented with serum and treated with Shh CM (i), immunodepleted Shh CM (Imm-Dep Shh CM; ii), CM cultivated from nontransfected HeLa cells (HeLa CM; iii), CM cultivated from nontransfected HeLa cells and immunodepleted for Shh (Imm-Dep HeLa CM; iv), and Shh CM with mock immunodepletion (Mock-Dep), as indicated (v). (D) Quantification of ciliated cells for each condition as indicated. (E) WT and Smo KO RPE1 cells transfected with full-length Smo-GFP and SmoΔC-GFP. Cells were grown in serum, with or without Shh. (F) Quantification of ciliated cells for each condition as indicated. *, P < 0.01; **, P < 0.001; ***, P < 0.0001. Number of cells (n) used for each experiment (three to four repeats) is listed in Table S4. Yellow and red arrows indicate the presence or absence of a cilium, respectively.
Figure S2.
Figure S2.
Different Smo agonists and antagonists affect Smo activities, differently. (A) Immunofluorescence images of RPE1 cells plated at LCD and treated with different concentrations of Hh agonists and antagonists as indicated. (B) Quantification of ciliated cells at different conditions as indicated. Statistical significances compare all conditions to control cells with Shh. (C) Western blot probed for Smo indicating Smo KO in CRISPR cell line compared with RPE1 WT. (D) Graph indicating cAMP Glo sensor expression levels as an indicator for cAMP activity for each condition as indicated. (E) Graph indicating Gli1 expression levels for each condition as indicated in comparison to serum-starved ciliated cells. Statistical significance compares all conditions to serum-starved cells at HCD without Shh. *, P < 0.01; **, P < 0.001; ***, P < 0.0001, comparing cells with Shh to those without Shh for the same condition unless otherwise indicated. Number of cells (n) used for each experiment (three repeats) is listed in Table S4. Yellow and red numbers and arrows indicate the presence or absence of a cilium, respectively.
Figure S3.
Figure S3.
Confirmation of Palbociclib activity and depletion ofautophagy proteins by siRNA. (A) Immunofluorescence images of RPE1 Geminin:GFP cells treated with Palbociclib (200 nM) for 24 h to arrest the cell cycle. Geminin, the DNA replication inhibitor, is absent in G1 phase and is highly expressed at the beginning of S phase through G2. Using Palbociclib, cells were Geminin negative showing G0/G1 arrest. (B) Immunofluorescence images of RPE1 cells treated with Palbociclib (200 nM) for 24 h to arrest the cell cycle at G0/G1 phase. Arl13B was used as a ciliary marker. (C) Stitched images of RPE1 Geminin:GFP cells treated with or without Shh at LCD and stained for GFP, indicating cells expressing nuclear GFP signals. White arrows indicate the presence of Geminin in nucleus. (D) Quantification of cells expressing nuclear Geminin at different conditions as indicated. (E) RPE1 cells grown in serum, with or without Shh, after depletion of ATG5 as an example for autophagy genes siRNA screen. (F) Western blots probed for different autophagy proteins and LC3, indicating the efficiency of each KD and its effect on autophagy flux in RPE1 cells. Number of cells (n) used for each experiment (three repeats) is listed in Table S4. Yellow and red arrows indicate the presence or absence of a cilium, respectively.
Figure 3.
Figure 3.
Hh activates autophagy to promote ciliogenesis. (A) RPE1 cells plated at different cell densities and different conditions as indicated. The number of cells plated/cm2 is indicated. Cells were stained for LC3 to assess the activation of autophagy and acetylated (Ace) Tubulin as a ciliary marker. Torin1 concentration is 250 nM. Cells were treated with Torin1 or Shh CM for 24 h. (B) Quantification of average of LC3 puncta/cells for each condition as indicated. Statistical significance compares all conditions to serum-starved cells at HCD. (C) Western blots were probed with LC3 or p62 to assess the activation of autophagy at different conditions as indicated. Cells were treated with Torin1 and bafilomycin A1 (BAF A1; 100 nM) for 4 and 2 h, respectively, followed by an additional 24 h supplemented with Shh CM. Black lines separate nonconsecutive parts of the same sets of Western blots. (D) Quantifications of LC3II/LC3I ratio and p62 levels to measure the autophagy flux for Western blots shown in C. (E) Quantification of ciliated cells for each siRNA depletion as indicated. *, P < 0.01; **, P < 0.001; ***, P < 0.0001 comparing all conditions to control cells with Shh. Number of cells (n) used for each experiment (three to four repeats) is listed in Table S4. Yellow, red, and green arrows point to cilium, no cilium, and LC3 puncta, respectively.
Figure 4.
Figure 4.
Smo agonists differentially activate LKB1 or Gαi, and both are required for ciliogenesis. (A) Immunofluorescence images of RPE1 WT, control siRNA, Smo KO, LKB1-depleted, and Gαi (1+2+3)–depleted cells at LCD and treated with Shh or different Smo agonists as indicated. (B) Quantification of ciliated cells at different conditions as indicated. Gαi siRNA represents KD of different isoforms, Gαi (1+2+3), and OFD1 siRNA represents KD of a combination of siRNAs, OFD1(1+2+3). (C) Western blots probed with LC3 or p62 to assess the activation of autophagy at different conditions as indicated. Cells were treated with bafilomycin A1 (BAF A1; 100 nM) for 2 h followed by an additional 6 h supplemented with Shh CM. Black lines separate nonconsecutive parts of the same sets of Western blots. (D) Quantifications of LC3II/LC3I ratio and p62 levels to measure the autophagy flux for Western blots shown in C. (E) Quantification of ciliated cells at different conditions as indicated. *, P < 0.01; **, P < 0.001; ***, P < 0.0001 comparing all conditions to control cells with Shh. Number of cells (n) used for each experiment (three to four repeats) is listed in Table S4. Yellow and red arrows indicate the presence or absence of a cilium, respectively.
Figure S4.
Figure S4.
Smo activates autophagy via AMPK, and promotes Gαi activation to induce ciliogenesis. (A) Western blots indicating the efficiency of different KDs in RPE1 cells as indicated. OFD1 siRNAs represent a combination of different OFD1 siRNAs as indicated. (B) Quantification of ciliated cells for depletion of different Gαi isoforms using siRNA in RPE1 cells. (C) Immunofluorescence images of RPE1 cells plated at LCD and treated with Rp-8-Bromo cAMPs in the presence and absence of Shh. (D) Western blot probing for Akt total and phosphorylated to indicate the presence or absence of active mTOR upon Hh activation, respectively. (E) Western blot probing for total and phosphorylated acetyl-CoA carboxylase (ACC) to indicate the activation of AMPK upon Hh activation. (F) Immunofluorescence images of RPE1 cells plated at LCD and treated with SAG or SAG and Torin1 for 24 h.*, P < 0.01; **, P < 0.001, ***, P < 0.0001, comparing all conditions to control cells with Shh. Number of cells (n) used for each experiment (three repeats) is listed in Table S4. Yellow and red arrows indicate the presence or absence of a cilium, respectively.
Figure 5.
Figure 5.
Smo activation of autophagy via LKB1 promotes the degradation of OFD1. (A) Western blots probed for OFD1 or LC3 to assess degradation of OFD1 or activation of autophagy, respectively, at different conditions as indicated. Cell were treated with or without Shh for different time periods as indicated. Black lines separate nonconsecutive parts of the same sets of Western blots. (B) Quantifications of OFD1 intensity for each Western blot shown in A as indicated. (C) Confocal images (stitched) of RPE1 cells indicating OFD1 distribution in cells plated at LCD and treated with or without Shh for 5 h, stained for OFD1 and γ Tubulin. OFD1 is removed from satellites, while its accumulation increases at centrioles upon Hh activation. Gαi siRNA reparents KD of different isoforms, Gαi (1+2+3). (D) Quantification of OFD1 total cell intensity, and OFD1 centriole intensity at different conditions as indicated. The quantifications were done using images taken with confocal microscopy. *, P < 0.01; **, P < 0.001, comparing Shh treated cells in each condition to those without Shh in the same condition . Number of cells (n) used for each experiment (three to four repeats) is listed in Table S4.
Figure S5.
Figure S5.
OFD1 localization at satellites and centrioles is redistributed upon Hh activation. (A) Confocal stitched images of RPE1 cells to provide a bigger field of view, indicating OFD1 distribution in cells at different conditions as indicated. Cells were plated at LCD, treated with or without Shh for 7 h, and stained for OFD1 and γ Tubulin. OFD1 accumulation decreases at satellites and increases at centrioles upon Hh activation. (B) SIM images indicating OFD1 localization in respect to γ Tubulin as centriole marker in RPE1 WT treated with or without Shh for 5 h; top view from different angles. (C) SIM images indicating OFD1 localization in RPE1 cells at LCD and treated with or without Shh after 24 h when cilium was formed. (D) SIM images indicating BBS4 localization in respect to γ Tubulin as centriole marker in RPE1 WT or Gαi-depleted cells treated with Shh for 5 h; top view from different angles. Unlike WT cells, BBS4 does not localize at centrioles, despite proximity with centrioles.
Figure 6.
Figure 6.
Smo promotes the translocation of OFD1 from satellites to the centrioles via Gαi-LGN-NuMA-dynein protein complex. (A) SIM images (top view) indicating that OFD1 localizes at centriolar satellites using the satellite marker PCM1, and its translocation to distal end of centrioles upon Hh activation using Ninein as subdistal appendage marker. The yellow dashed lines indicate the centriolar satellite area. The cartoon figures indicate how OFD1 looks from different views with respect to other centriolar proteins. (B) SIM images indicating OFD1 localization with respect to γ Tubulin as centriole marker from top view in RPE1 WT, Smo KO, and cells depleted of LKB1, AMPK, Gαi (1+2+3), LGN, and NuMA and treated with Ciliobrevin A (100 nM) at LCD, with or without Shh after 5 h. The cartoon figures are to facilitate better understanding of OFD1 changes in each condition. The red boxes indicate the centriolar satellite area. Yellow and white arrows indicate the presence or absence of OFD1 at centrioles, respectively.
Figure 7.
Figure 7.
Both LKB1-AMPK and Gαi-LGN-NuMA-dynein axes are required for BBS4 recruitment to basal body. (A) SIM images indicating BBS4 localization with respect to γ Tubulin as a centriole marker in RPE1 WT, Smo KO, and cells depleted of OFD1(1+2+3), LKB1, AMPK, Gαi (1+2+3), LGN, and NuMA and treated with Ciliobrevin A (100 nM) at LCD, with or without Shh for 5 h. Yellow and white arrows point to the presence or absence, respectively, of BBS4 at centrioles. (B) Quantification of BBS4 total cell intensity and BBS4 centriole intensity at different conditions as indicated. The quantifications were done using images taken with confocal microscopy. (C) Graphical abstract indicating how noncanonical Hh induces ciliogenesis via Smo activity. (i and ii) Smo activates LKB1 to promote the activation of autophagy to remove the satellite pool of OFD1 (i) and release BBS4 from satellites (ii). It also activates the Gαi-LGN/NuMA/dynein axis to promote the translocation of a portion of OFD1 to the centrioles and recruitment of BBS4 to basal body and cilia.

References

    1. Arellano J.I., Guadiana S.M., Breunig J.J., Rakic P., and Sarkisian M.R.. 2012. Development and distribution of neuronal cilia in mouse neocortex. J. Comp. Neurol. 520:848–873. 10.1002/cne.22793 - DOI - PMC - PubMed
    1. Bangs F., and Anderson K.V.. 2017. Primary Cilia and Mammalian Hedgehog Signaling. Cold Spring Harb. Perspect. Biol. 9:a028175 10.1101/cshperspect.a028175 - DOI - PMC - PubMed
    1. Bento C.F., Renna M., Ghislat G., Puri C., Ashkenazi A., Vicinanza M., Menzies F.M., and Rubinsztein D.C.. 2016. Mammalian Autophagy: How Does It Work? Annu. Rev. Biochem. 85:685–713. 10.1146/annurev-biochem-060815-014556 - DOI - PubMed
    1. Berbari N.F., O’Connor A.K., Haycraft C.J., and Yoder B.K.. 2009. The primary cilium as a complex signaling center. Curr. Biol. 19:R526–R535. 10.1016/j.cub.2009.05.025 - DOI - PMC - PubMed
    1. Bergstralh D.T., Dawney N.S., and St Johnston D.. 2017. Spindle orientation: a question of complex positioning. Development. 144:1137–1145. 10.1242/dev.140764 - DOI - PubMed

Publication types

MeSH terms

Grants and funding