. 2021 Apr 22;33(5):261-272.
doi: 10.1093/intimm/dxaa076.

Suppression of liver transplant rejection by anti-donor MHC antibodies via depletion of donor immunogenic dendritic cells

Affiliations

Suppression of liver transplant rejection by anti-donor MHC antibodies via depletion of donor immunogenic dendritic cells

Hisashi Ueta et al. Int Immunol. .

Abstract

Background: We previously found two distinct passenger dendritic cell (DC) subsets in the rat liver that played a central role in the liver transplant rejection. In addition, a tolerance-inducing protocol, donor-specific transfusion (DST), triggered systemic polytopical production of depleting alloantibodies to donor class I MHC (MHCI) antigen (DST-antibodies).

Methods: We examined the role of DST-antibodies in the trafficking of graft DC subsets and the alloresponses in a rat model. We also examined an anti-donor class II MHC (MHCII) antibody that recognizes donor DCs more selectively.

Results: Preoperative transfer of DST-antibodies or DST pretreatment eliminated all passenger leukocytes, including both DC subsets and depleted the sessile DCs in the graft to ~20% of control. The CD172a+CD11b/c+ immunogenic subset was almost abolished. The intrahost direct or semi-direct allorecognition pathway was successfully blocked, leading to a significant suppression of the CD8+ T-cell response in the recipient lymphoid organs and the graft with delayed graft rejection. Anti-donor MHCII antibody had similar effects without temporary graft damage. Although DST pretreatment had a priming effect on the proliferative response of recipient regulatory T cells, DST-primed sera and the anti-donor MHCII antibody did not.

Conclusion: DST-antibodies and anti-donor MHCII antibodies could suppress the CD8+ T-cell-mediated liver transplant rejection by depleting donor immunogenic DCs, blocking the direct or semi-direct pathways of allorecognition. Donor MHCII-specific antibodies may be applicable as a selective suppressant of anti-donor immunity for clinical liver transplantation without the cellular damage of donor MHCII- graft cells and recipient cells.

Keywords: CD8 T cells; donor-specific transfusion; leukocyte trafficking; multicolor immunohistochemistry; sensitization pathway.


Figures

Fig. 1.
Fig. 1.
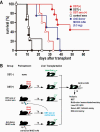
(A) Survival rate of liver allograft recipients after various treatments. The DST(–) or control sera transfer groups survived till 10~20 days after LTx. In contrast, the DST(+) group survived till 30 days or longer. The DST sera transfer and anti-donor MHCII mAb transfer groups survived till 20~60 days although shorter than the DST(+) group. (B) Scheme showing the experimental protocols for the DST(-), DST(+), DST sera, control sera and anti-donor MHCII mAb groups.
Fig. 2.
Fig. 2.
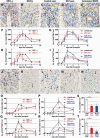
Donor cell migration and intrahost T-cell response in the spleen in the DST(–) (A, F, K, P, R) and DST(+) (B, G, L, P, R) groups, and the control sera (C, H, M, Q, S), DST sera (D, I, N, Q, S) and anti-donor MHCII mAb (E, J, O, Q, S) groups. (A–O) Triple immunostaining of donor MHCI (A–E, blue), donor MHCII (F–J, blue), or CD8β (K–O, blue), BrdU (red), and type IV collagen (brown) 2 days after LTx. Arrowheads in K–O indicate BrdU+CD8β + proliferating T cells. F, lymph follicle; P, splenic PALS. Scale bars, 100 μm (A–J) or 50 μm (K–O). (P–S) Number of BrdU+ cells (P, Q) or BrdU+CD8β + cells (R, S) per square millimeter of splenic PALS. Mean ± SD, n = 3 rats each, *P < 0.05. * in (P) and (R) indicates significant suppression in the DST(+) versus DST(–) group and * in (Q) and (S) indicates that in the DST sera versus control sera group.
Fig. 3.
Fig. 3.
DST pretreatment suppressed the intragraft host cell response on day 10. (A–O) Triple immunostaining of recipient MHCI (blue), BrdU (red) and type IV collagen (brown) in the graft, 2, 5 and 10 days after LTx in the DST(–) (A, F, K), DST(+) (B, G, L), control sera (C, H, M), DST sera (D, I, N) and anti-donor MHCII mAb (E, J, O) groups. P, portal area; S, sinusoidal area. Scale bars, 200 μm. (P–S) Time kinetics for the number of BrdU+ cells mm−2 in the portal area (P, Q) and the proportion of the sinusoidal area in total area (R, S). Note the conserved sinusoidal area (L, R) in DST(+) group on day 10. Mean ± SD, n = 3 rats each, *P < 0.05. #Normal donor liver before LTx.
Fig. 4.
Fig. 4.
CD8 T-cell response in the portal (A–I) and sinusoidal (J–T) areas of the graft liver after various treatments. (A–E, J–N) Triple immunostaining 4 days after LTx for CD8β (blue), BrdU (red) and type IV collagen (brown). Many BrdU+CD8β + proliferating T cells (arrows) were found in the DST(–) (A,J) and control sera (C,L) groups but fewer in the DST(+) (B,K), DST sera (D,M) and anti-donor MHCII mAb (E,N) groups. Scale bars, 50 μm. (F–I, O–R) Number of total CD8β + and BrdU+CD8β + cells mm−2 area in the DST(–) and DST(+) groups (F, H, O, Q) or control sera, DST sera and anti-MHCII mAb groups (G, I, P, R). (S, T) Digital quantification of (P) and (R) on day 5, respectively, by image analysis. Mean ± SD, n = 3 rats each, *P < 0.05. * in (H), (O) and (Q) indicates significant suppression in the DST(+) vs DST(–) group and * in (I), (P), (R), (S) and (T) indicates that in the DST sera vs control sera group. #Normal donor liver before LTx.
Fig. 5.
Fig. 5.
Resident DCs were depleted by DST treatment or DST sera transfer, whereas remaining DCs still formed clusters with proliferating cells. (A–C) FACS analysis of donor DCs in the graft livers of the DST(–), DST(+) and DST sera groups. Representative data from three independent experiments. Mean ± SD, n = 3 rats each, *P < 0.05. (A) Proportions of donor MHCII+CD103+CD163 DCs in non-parenchymal cells of the whole graft. Red plots correspond to donor DC population. (B) Absolute numbers of donor MHCII+CD103+ DCs in the whole graft. *P < 0.05. (C) Proportions of three DC subsets isolated from grafts. Note that the proportion of CD172a+CD11b/c+ cells decreased significantly. *P < 0.05.
Fig. 6.
Fig. 6.
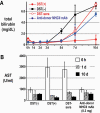
Time kinetic change in total bilirubin (A) and serum AST (B) levels after LTx. Note the temporary increase in AST level at 6 h after LTx in the DST(+) and DST sera groups but not in the DST(–) or anti-donor MHCII mAb groups (B). Mean ± SD, n = 3 rats each.

Similar articles

Cited by

References

    1. Saiki, T., Ezaki, T., Ogawa, M. and Matsuno, K. 2001. Trafficking of host- and donor-derived dendritic cells in rat cardiac transplantation: allosensitization in the spleen and hepatic nodes. Transplantation 71:1806. - PubMed
    1. Wood, K. J. 2003. Passenger leukocytes and microchimerism: what role in tolerance induction? Transplantation 75(suppl. 9):17S. - PubMed
    1. Ueta, H., Shi, C., Miyanari, N.et al. . 2008. Systemic transmigration of allosensitizing donor dendritic cells to host secondary lymphoid organs after rat liver transplantation. Hepatology 47:1352. - PubMed
    1. Yu, B., Ueta, H., Kitazawa, Y.et al. . 2012. Two immunogenic passenger dendritic cell subsets in the rat liver have distinct trafficking patterns and radiosensitivities. Hepatology 56:1532. - PubMed
    1. Lechler, R., Ng, W. F. and Steinman, R. M. 2001. Dendritic cells in transplantation—friend or foe? Immunity 14:357. - PubMed

Publication types

MeSH terms