. 2021 Apr 13;38(4):1512-1528.
doi: 10.1093/molbev/msaa311.

A Two-Locus System with Strong Epistasis Underlies Rapid Parasite-Mediated Evolution of Host Resistance

Affiliations

A Two-Locus System with Strong Epistasis Underlies Rapid Parasite-Mediated Evolution of Host Resistance

Camille Ameline et al. Mol Biol Evol. .

Erratum in

Abstract

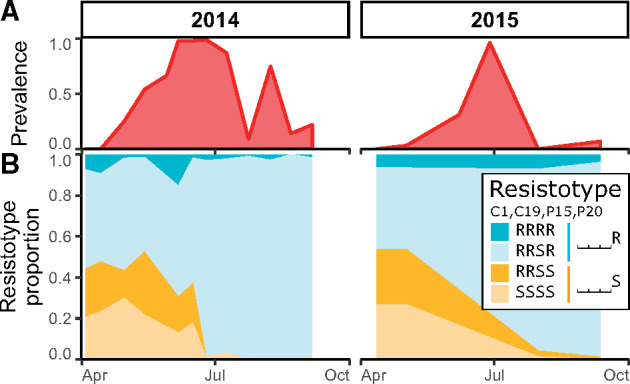
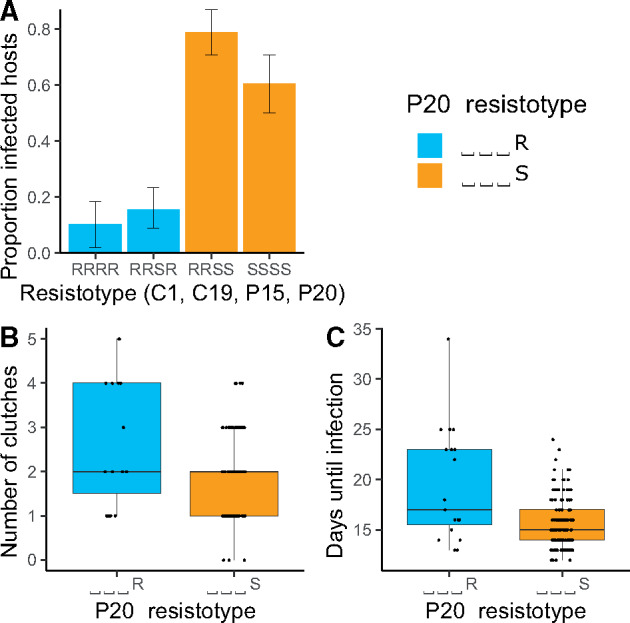
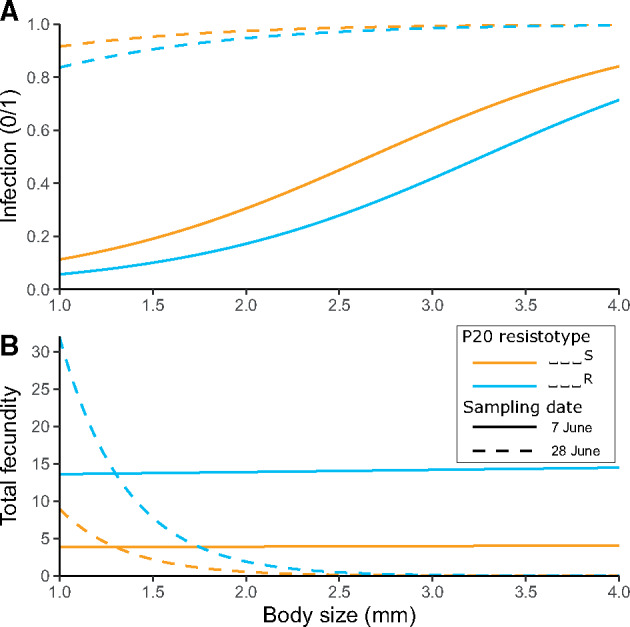
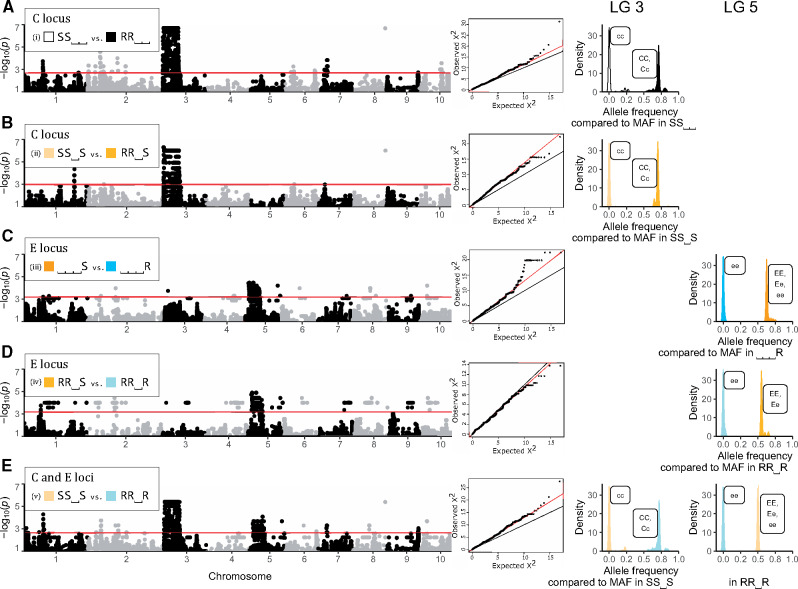
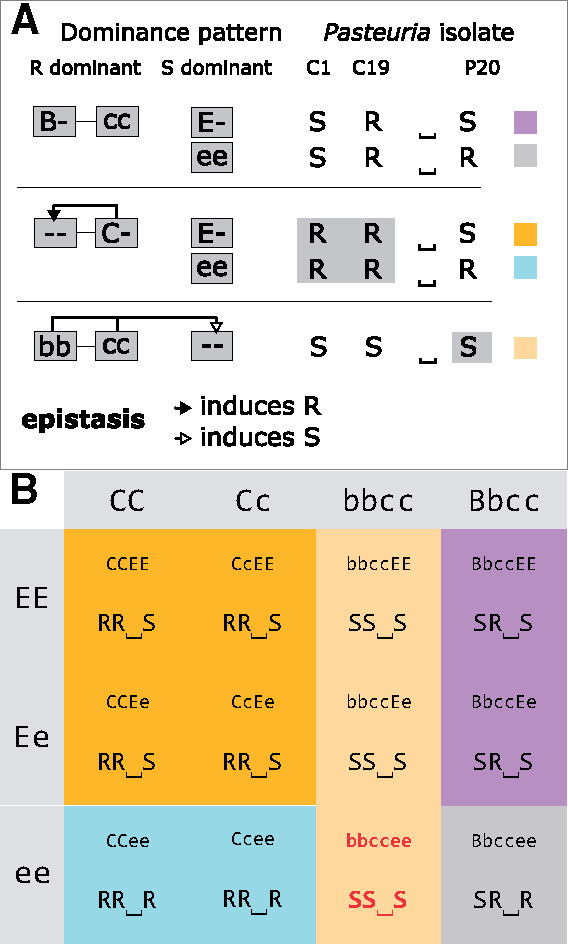
Parasites are a major evolutionary force, driving adaptive responses in host populations. Although the link between phenotypic response to parasite-mediated natural selection and the underlying genetic architecture often remains obscure, this link is crucial for understanding the evolution of resistance and predicting associated allele frequency changes in the population. To close this gap, we monitored the response to selection during epidemics of a virulent bacterial pathogen, Pasteuria ramosa, in a natural host population of Daphnia magna. Across two epidemics, we observed a strong increase in the proportion of resistant phenotypes as the epidemics progressed. Field and laboratory experiments confirmed that this increase in resistance was caused by selection from the local parasite. Using a genome-wide association study, we built a genetic model in which two genomic regions with dominance and epistasis control resistance polymorphism in the host. We verified this model by selfing host genotypes with different resistance phenotypes and scoring their F1 for segregation of resistance and associated genetic markers. Such epistatic effects with strong fitness consequences in host-parasite coevolution are believed to be crucial in the Red Queen model for the evolution of genetic recombination.

Keywords: Daphnia magna; Pasteuria ramosa; dominance; epistasis; genetic architecture; multilocus genetics; parasite-mediated selection; resistance; zooplankton.


Figures

Fig. 1.
Fig. 1.
Prevalence and resistotype dynamics observed in the Aegelsee Daphnia magna population. (A) Pasteuria ramosa prevalence across two summer epidemics. (B) Resistotype (resistance phenotype) frequencies across time (n = 60–100 D. magna clones from each sampling date in 2- to 3-week intervals). Resistotypes = resistance to P. ramosa C1, C19, P15, and P20, consecutively.
Fig. 2.
Fig. 2.
Experimental infections of Daphnia magna with different resistotypes (resistance phenotype). Resistotypes RRSR, RRSS, SSSS (n = 20 clones for each), and RRRR (n = 10 clones) were infected with parasite spores from the early phase of the epidemic. Five repeats were performed for each clone (total n = 334). Controls (n = 210) remained uninfected and are not shown here. (A) Proportion of infected D. magna among the four resistotypes. (B) Number of clutches produced before parasitic castration in the infected P20-resistant (⎵⎵⎵R) and susceptible (⎵⎵⎵S) animals (n = 115). (C) Time before visible infection in P20-resistant and P20-susceptible individuals (n = 115).
Fig. 3.
Fig. 3.
Fitted models of infection phenotypes in field-collected Daphnia magna relative to their body size at capture (x axis) and their resistance to P20 for two sampling dates in June 2015. (A) P20-susceptible (orange) animals have a higher likelihood to be infected than P20-resistant (blue) ones for any body size. (B) Infected P20-susceptible animals have a lower total fecundity than P20-resistant ones for any body size. Differences between the data are partially due to the difference in parasite prevalence on the two sampling dates (31% on June 7 and 96% on June 28).
Fig. 4.
Fig. 4.
GWAS analysis comparing the most common resistance phenotypes (resistotypes) in the Aegelsee Daphnia magna population. The resistotype depicts resistance (R) or susceptibility (S) to Pasteuria ramosa isolates C1, C19, P15, and P20. (i) SS⎵⎵ versus RR⎵⎵; (ii) SS⎵S versus RR⎵S; (iii) ⎵⎵⎵S versus ⎵⎵⎵R; (iv) RR⎵S versus RR⎵R, and (v) SS⎵S versus RR⎵R. Comparisons (i) and (ii) (variation at C1 and C19 resistotypes) revealed a strong signal on linkage group (LG) 3 corresponding to the C locus. Comparisons (iii) and (iv) (variation at P20 resistotype) revealed a strong signal on LG 5 corresponding to the E locus. Comparison (v) (variation at C1 and C19, and P20 resistotypes) revealed a strong signal on both regions. Left panel: Manhattan plots of relationships between different resistotype groups (showing only SNPs with Pcorrected < 0.01). The x axis corresponds to SNP data mapped on the 2.4 D. magna reference genome (Routtu et al. 2014), representing only SNPs, not physical distance on the genome. Middle panel: Quantile-quantile plots of noncorrected P values excluding SNPs from linkage groups 3 and 5, since these scaffolds displayed an excess of strongly associated markers. Right panel: Comparison of allele frequencies between resistotype groups at the C and the E loci. Significant SNPs on LG 3 or LG 5 were used (SNPs with P < Plim/100, with Plim as defined in the Materials and Methods section, eq. 1). For each SNP, the allele with the minor allele frequency (MAF) within resistotype groups that presented only one allele at the C or the E locus (all homozygous individuals) was used for comparisons. Hence, the x axis represents allele frequency of the dominant allele within resistotype groups (considering total allele number, or chromosome number: 2n). Labels attached to peaks describe the inferred possible genotypes at the C or the E locus within resistotype groups. In comparisons at the C locus on LG 3, resistotype groups susceptible to C1 and C19 presented only one allele, that is, they contained only homozygous recessive individuals at the C locus (dominant allele frequency of zero). Resistotype groups resistant to C1 and C19 did contain the dominant allele (frequency between 0.5 and 1), showing that resistance is dominant at the C locus, as the resistant group contains heterozygous individuals. Similarly, in comparisons at the E locus on LG 5, resistotype groups resistant to P20 do not present the dominant allele (frequency of zero), whereas resistotype groups susceptible to P20 do, that is, contain heterozygous individuals (dominant allele frequency between 0.5 and 1). This shows that, in contrast with the C locus, susceptibility is dominant at the E locus. Screening individual genomes revealed that some SS⎵S individuals (susceptible to C1 and C19, and P20) presented the “ee” genotype at the E locus (resistance to P20), although susceptibility is dominant at the E locus. This was not observed in RR⎵S individuals (resistant to C1 and C19 but susceptible to P20) (supplementary table S3, Supplementary Material online). This observation can be explained by an epistatic relationship linking the C and the E loci. This epistasis confers susceptibility to P20 to individuals susceptible to C1 and C19, that is, presenting the “cc” genotype regardless of the genotype at the E locus. In contrast, with groups containing SS⎵S individuals, that is, comparisons (iii) and (iv), some SS⎵S individuals present the “ee” genotype at the E locus. In these groups, the frequency of the dominant allele can be lower than 0.5.
Fig. 5.
Fig. 5.
Model for the genetic architecture of resistance to C1, C19, and P20 Pasteuria ramosa isolates in the Aegelsee Daphnia magna population as inferred from the GWAS analysis (fig. 4) and the genetic crosses (tables 1 and 2). (A) Schematic representation of the genetic model. Resistance to C1 and C19 is determined by the ABC cluster as described in Metzger et al. (2016), and the model is extended to include the newly discovered E locus. The dominant allele at the B locus induces resistance (R) to C19 and susceptibility (S) to C1. The dominant allele at the C locus confers resistance to both C1 and C19, regardless of the genotype at the B locus (epistasis). The newly discovered E locus contributes to determining resistance to P20. Resistance is dominant at the C locus (resistance to C1 and C19) but recessive at the E locus (resistance to P20). Homozygosity for the recessive allele at the B and C loci induces susceptibility to P20, regardless of the genotype at the E locus (epistasis). Hence epistasis can only be observed phenotypically in the “bbccee” genotype, which has the resistotype SS⎵S. Without epistasis, the “bbccee” genotype is expected to have the phenotype SS⎵R, a phenotype we never observed in the population or in our genetic crosses. (B) Multilocus genotypes and resistotypes at the B, C, and E loci. Resistotypes are grouped by background color. As the C allele epistatically nullifies the effect of the B locus, only combinations of the B and E loci are shown where the C locus is homozygous for the c allele. This model does not consider variation at the A locus, as the recessive allele at this locus is believed to be fixed in the Aegelsee D. magna population.

Similar articles

Cited by

References

    1. Alves JM, Carneiro M, Cheng JY, Lemos de Matos A, Rahman MM, Loog L, Campos PF, Wales N, Eriksson A, Manica A, et al.2019. Parallel adaptation of rabbit populations to myxoma virus. Science 363(6433):1319–1326. - PMC - PubMed
    1. Andras JP, Ebert D.. 2013. A novel approach to parasite population genetics: experimental infection reveals geographic differentiation, recombination and host-mediated population structure in Pasteuria ramosa, a bacterial parasite of Daphnia. Mol Ecol. 22(4):972–986. - PubMed
    1. Andras JP, Fields PD, Du Pasquier L, Fredericksen M, Ebert D.. 2020. Genome-wide association analysis identifies a genetic basis of infectivity in a model bacterial pathogen. Mol Biol Evol. - PMC - PubMed
    1. Auguie B. 2017. gridExtra: miscellaneous functions for “Grid” graphics. Available from: https://CRAN.R-project.org/package=gridExtra. Last accessed on December 2020.
    1. Auguie B. 2019. egg: extensions for “ggplot2”: custom geom, custom themes, plot alignment, labelled panels, symmetric scales, and fixed panel size. Available from: https://CRAN.R-project.org/package=egg. Last accessed on December 2020.

Publication types

Supplementary concepts