

Spatial distribution and associated factors of underweight in Ethiopia: An analysis of Ethiopian demographic and health survey, 2016
- PMID: 33259562
- PMCID: PMC7707465
- DOI: 10.1371/journal.pone.0242744
Spatial distribution and associated factors of underweight in Ethiopia: An analysis of Ethiopian demographic and health survey, 2016
Abstract
Background: Underweight is one form of indicators of under-nutrition, which results from the poor nutrient intake and underlying health problems. Its impact is beyond an individual and extends to a country level. It has been known from the literature that underweight has a negative effect on income and development of a country. In the context of Ethiopia, factors predicting underweight remain unknown and there is a paucity of evidence on geographical distribution of underweight among individuals aged 15-49 years. Therefore, the aim of this study was to examine the geographic distribution of underweight and its associated factors among individuals aged 15-49 years in Ethiopia.
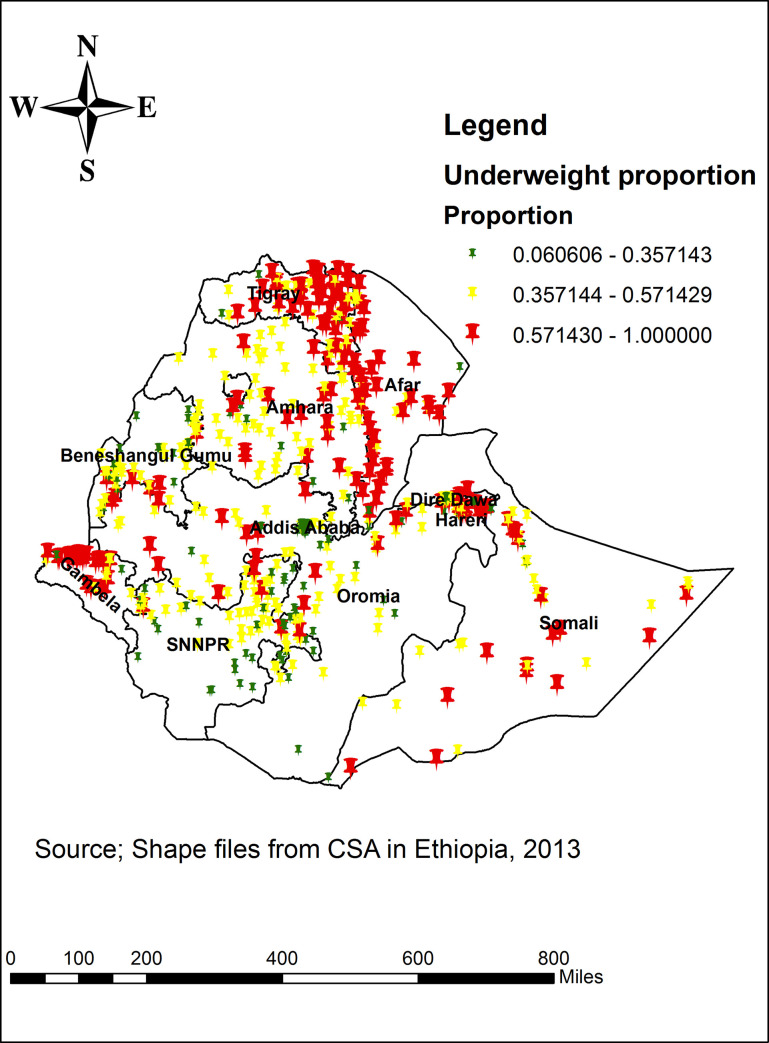
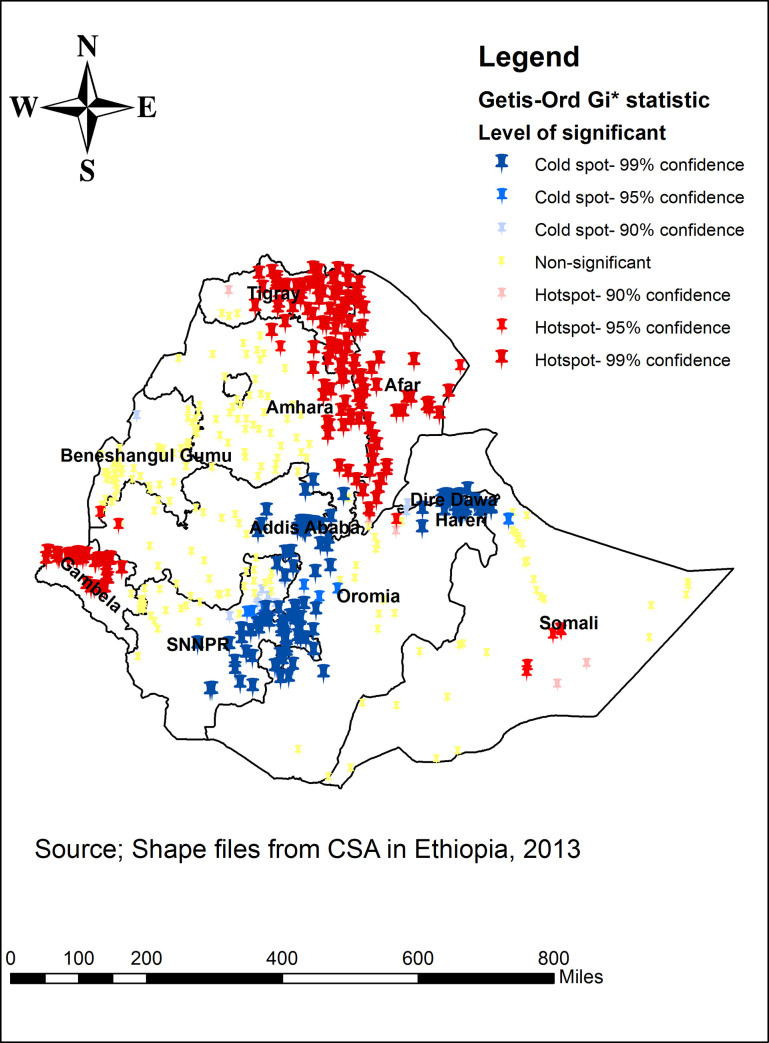
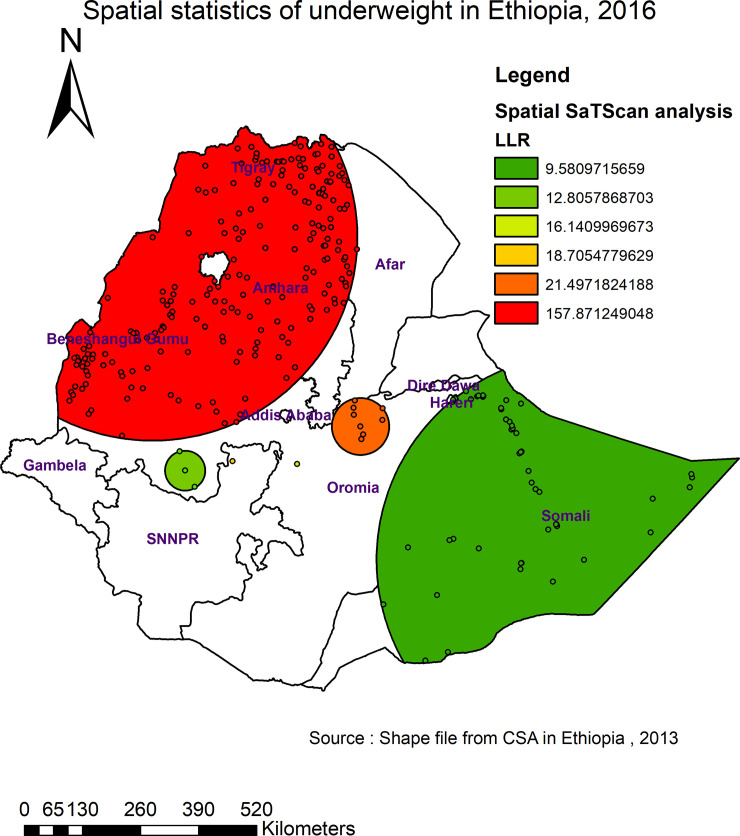
Methods: Secondary data analysis was done on a data set consisting of 28,450 individuals and obtained from the Ethiopian Demography and Health Survey (EDHS) 2016. The spatial distribution of underweight across the country was identified by ArcGIS software. Hotspots analysis was done using Getis-Ord Gi* statistic within ArcGIS. In SaTScan software, the Bernoulli model was fitted by Kulldorff's methods to identify the purely spatial clusters of underweight. A binary logistic regression was applied to determine factors associated with being underweight.
Result: In Ethiopia, the spatial distribution of underweight was clustered with Global Moran's I = 0.79 at p-value < 0.0001. The highest underweight clusters were observed in Tigray, Gambella, eastern part of Amhara, and western and central part of Afar regions. Male individuals [AOR = 1.21; 95% CI: (1.15 1.28)], never married [AOR = 1.14; 95% CI: (1.05, 1.24)], rural residents [AOR = 1.32; 95% CI: (1.18, 1.47)], rich [AOR = 0.85; 95% CI: (0.76, 0.94)], cigarette smoking [AOR = 1.25; 95% CI: (1.07, 1.46)], drinking treated water [AOR = 0.91; 95% CI: (0.83, 0.99)] and open filed defecation [AOR = 1.17; 95% CI: (1.08, 1.26)] were found to have a significant association with being underweight.
Conclusions: There was a significant clustering of underweight among individuals aged 15-49 years. Gender, age, marital status, place of residence, wealth index, cigarette smoking, using untreated water and types of toilet were the significant factors of being underweight. Therefore, effective public health interventions like building safe and supportive environments for nutrition, providing socio-economic protection and nutrition-related education for poor and rural resident would be better to mitigate these situations and associated risk factors in hot spot areas. In addition, policymakers should strengthen and promote nutrition sensitive policies and activities in order to alleviate the underlying and basic causes of underweight.
Conflict of interest statement
The authors have declared that no competing interests exist.
Figures

Similar articles
-
Spatial variation and determinants of underweight among children under 5 y of age in Ethiopia: A multilevel and spatial analysis based on data from the 2019 Ethiopian Demographic and Health Survey.Nutrition. 2022 Oct;102:111743. doi: 10.1016/j.nut.2022.111743. Epub 2022 May 23. Nutrition. 2022. PMID: 35816812
-
Geographic variation and associated factors of long-acting contraceptive use among reproductive-age women in Ethiopia: a multi-level and spatial analysis of Ethiopian Demographic and Health Survey 2016 data.Reprod Health. 2021 Jun 10;18(1):122. doi: 10.1186/s12978-021-01171-2. Reprod Health. 2021. PMID: 34112194 Free PMC article.
-
Mapping geographical inequalities of incomplete immunization in Ethiopia: a spatial with multilevel analysis.Front Public Health. 2024 Jun 7;12:1339539. doi: 10.3389/fpubh.2024.1339539. eCollection 2024. Front Public Health. 2024. PMID: 38912271 Free PMC article.
-
Geographical variation and factors associated with unsafe child stool disposal in Ethiopia: A spatial and multilevel analysis.PLoS One. 2021 Apr 29;16(4):e0250814. doi: 10.1371/journal.pone.0250814. eCollection 2021. PLoS One. 2021. PMID: 33914836 Free PMC article.
-
Applied nutritional investigation spatial variation and determinants of stunting among children aged less than 5 y in Ethiopia: A spatial and multilevel analysis of Ethiopian Demographic and Health Survey 2019.Nutrition. 2022 Nov-Dec;103-104:111786. doi: 10.1016/j.nut.2022.111786. Epub 2022 Jul 1. Nutrition. 2022. PMID: 35970098 Review.
Cited by
-
Determinants of health insurance coverage among women in Mauritania: a multilevel analysis.BMC Public Health. 2024 Jan 19;24(1):229. doi: 10.1186/s12889-024-17691-y. BMC Public Health. 2024. PMID: 38243212 Free PMC article.
-
Maternal anemia and baby birth size mediate the association between short birth interval and under-five undernutrition in Ethiopia: a generalized structural equation modeling approach.BMC Pediatr. 2022 Feb 28;22(1):108. doi: 10.1186/s12887-022-03169-6. BMC Pediatr. 2022. PMID: 35227241 Free PMC article.
-
Spatial multilevel analysis of age at death of under-5 children and associated determinants: EDHS 2000-2016.BMJ Open. 2023 Oct 18;13(10):e073419. doi: 10.1136/bmjopen-2023-073419. BMJ Open. 2023. PMID: 37852770 Free PMC article.
-
Spatial distribution, magnitude, and predictors of high fertility status among reproductive age women in Ethiopia: Further analysis of 2016 Ethiopia Demographic and Health Survey.PLoS One. 2023 Sep 8;18(9):e0290960. doi: 10.1371/journal.pone.0290960. eCollection 2023. PLoS One. 2023. PMID: 37682844 Free PMC article.
-
Determinants of healthcare insurance coverage among women of reproductive age in Tanzania: A multilevel mixed effect analysis.PLoS One. 2024 Dec 19;19(12):e0302806. doi: 10.1371/journal.pone.0302806. eCollection 2024. PLoS One. 2024. PMID: 39700176 Free PMC article.
References
-
- WHO. The use and interpretation of anthropometry: report of a WHO expert committee 1995. [312–409]. - PubMed
-
- Fryar CD, Ogden CLJAJ. Prevalence of underweight among adults aged 20 years and over: United States, 2007–2008. 2010;1.
-
- WHO. More than one in three low- and middle-income countries face both extremes of malnutrition 2019 [updated 16 December].
MeSH terms
LinkOut - more resources
Full Text Sources
