

Metabolic abnormalities in G6PC3-deficient human neutrophils result in severe functional defects
- PMID: 33259599
- PMCID: PMC7724913
- DOI: 10.1182/bloodadvances.2020002225
Metabolic abnormalities in G6PC3-deficient human neutrophils result in severe functional defects
Abstract
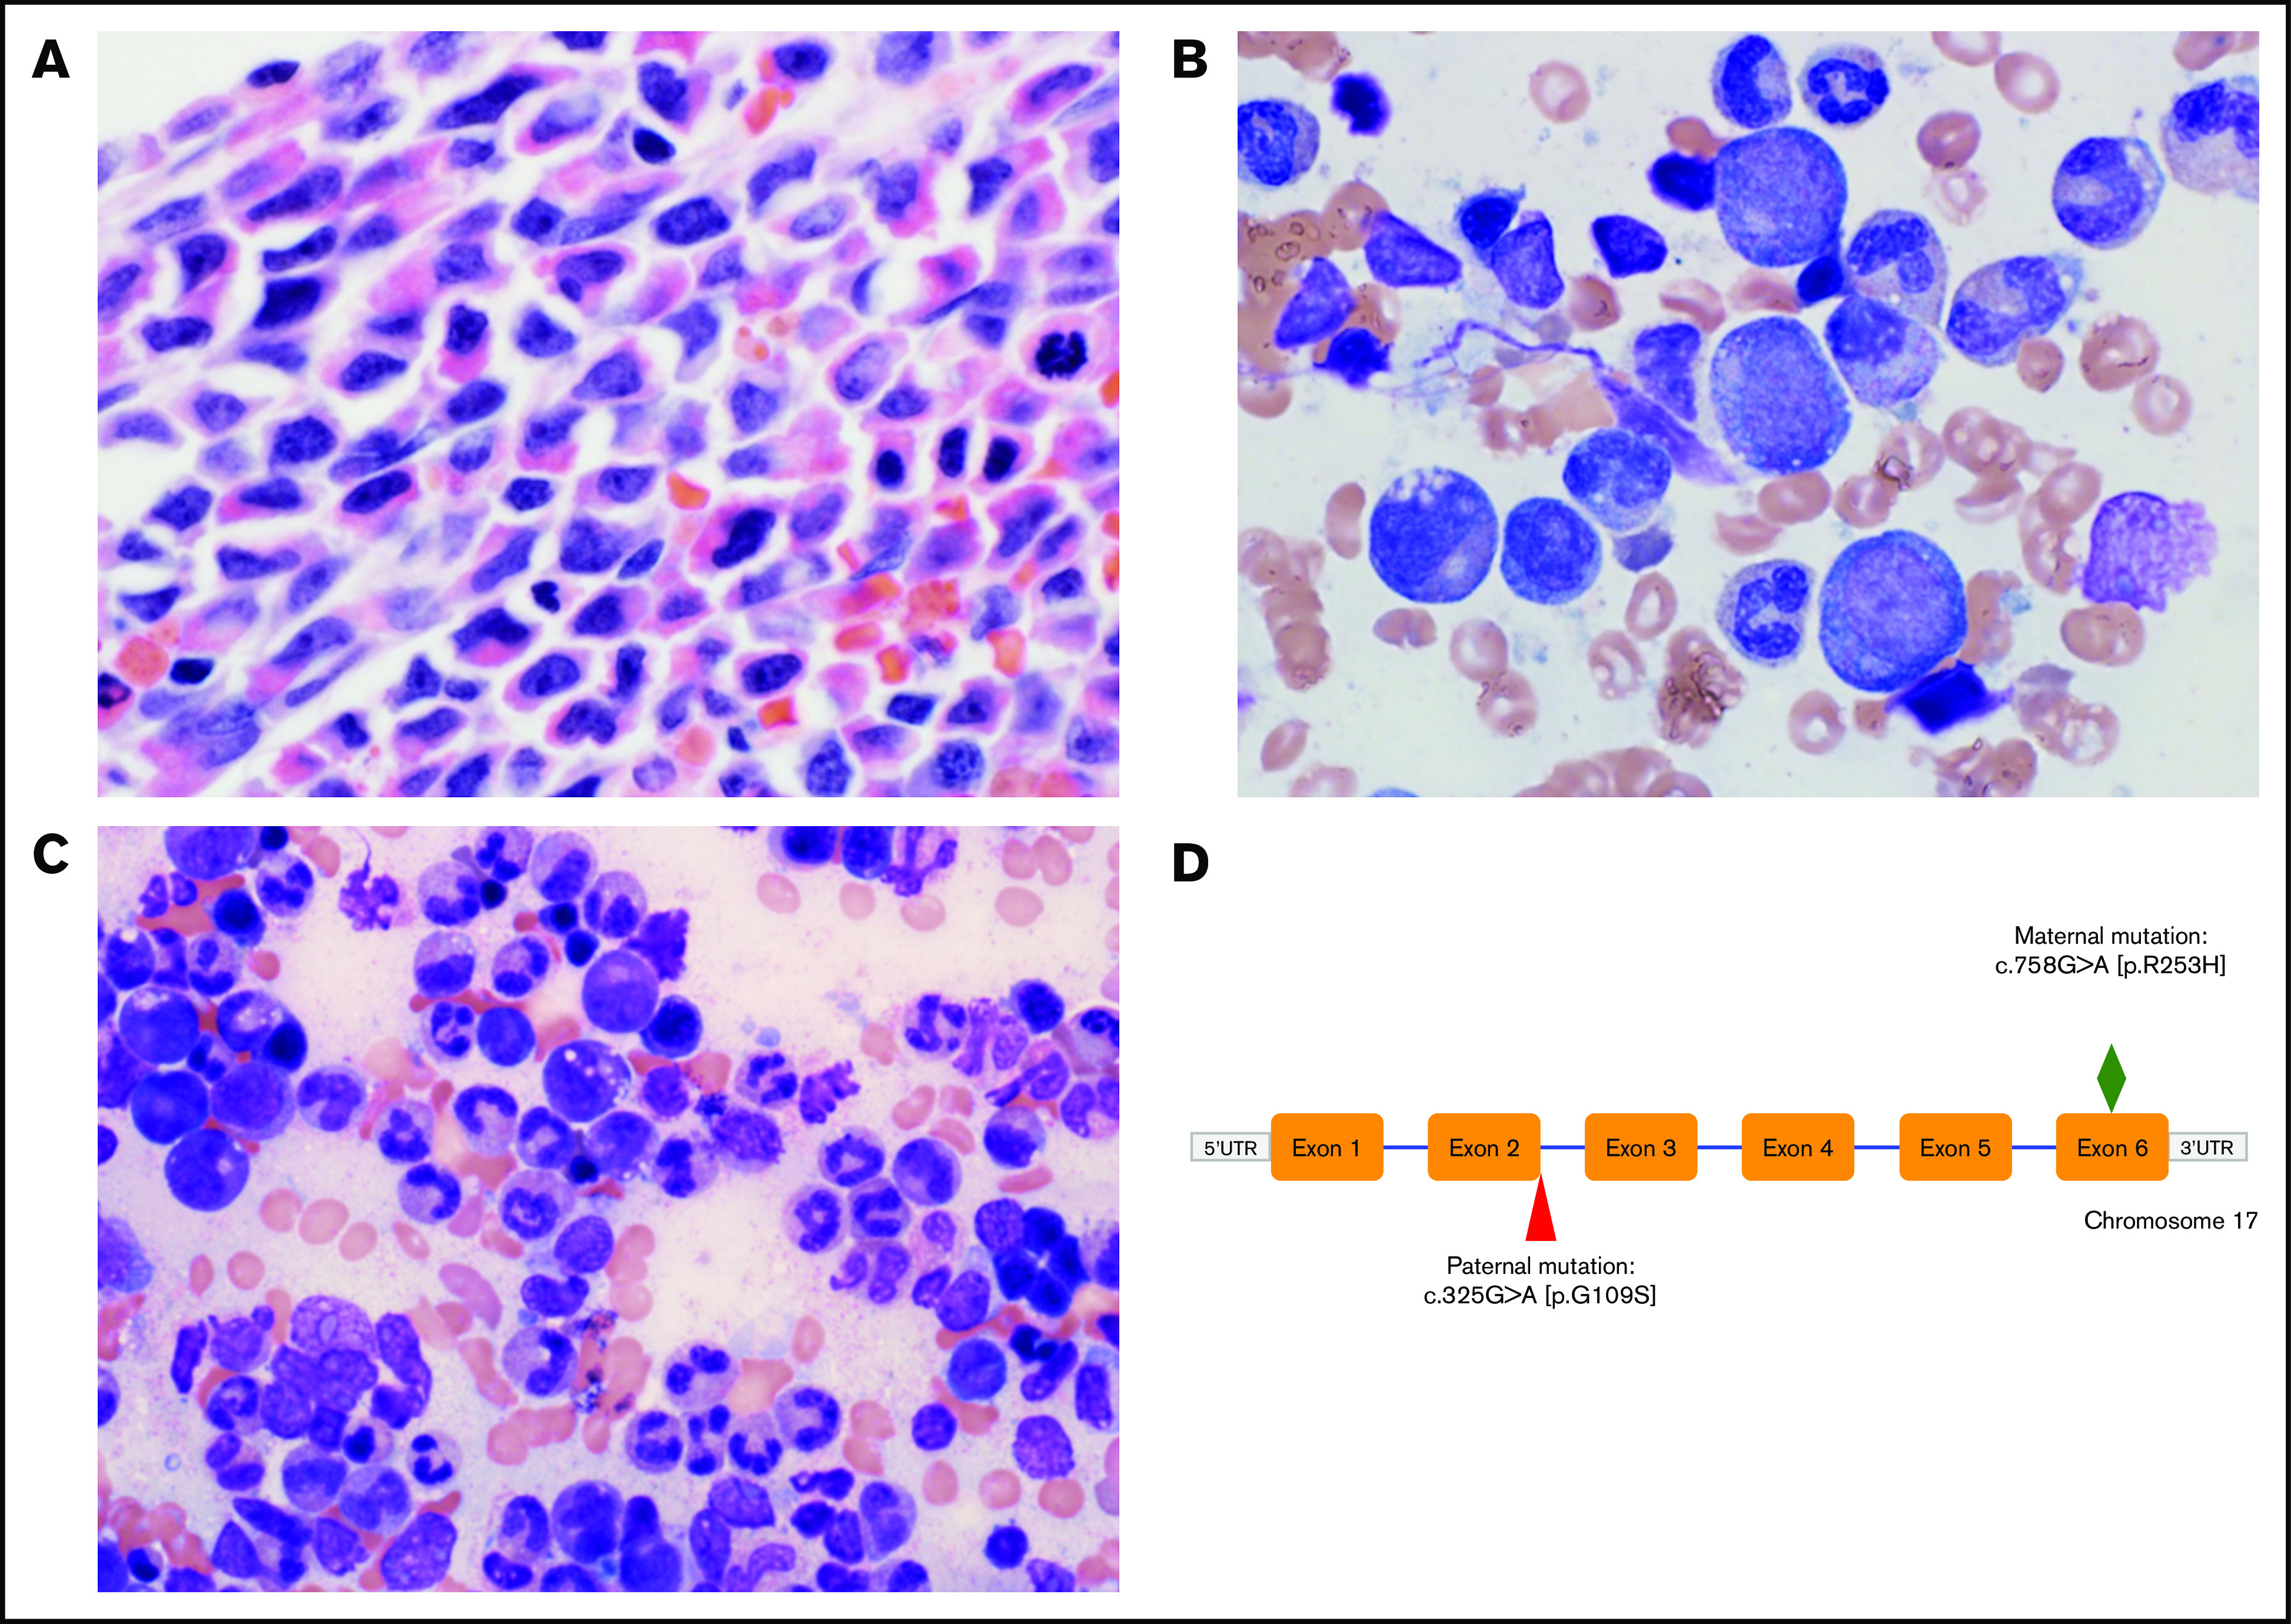
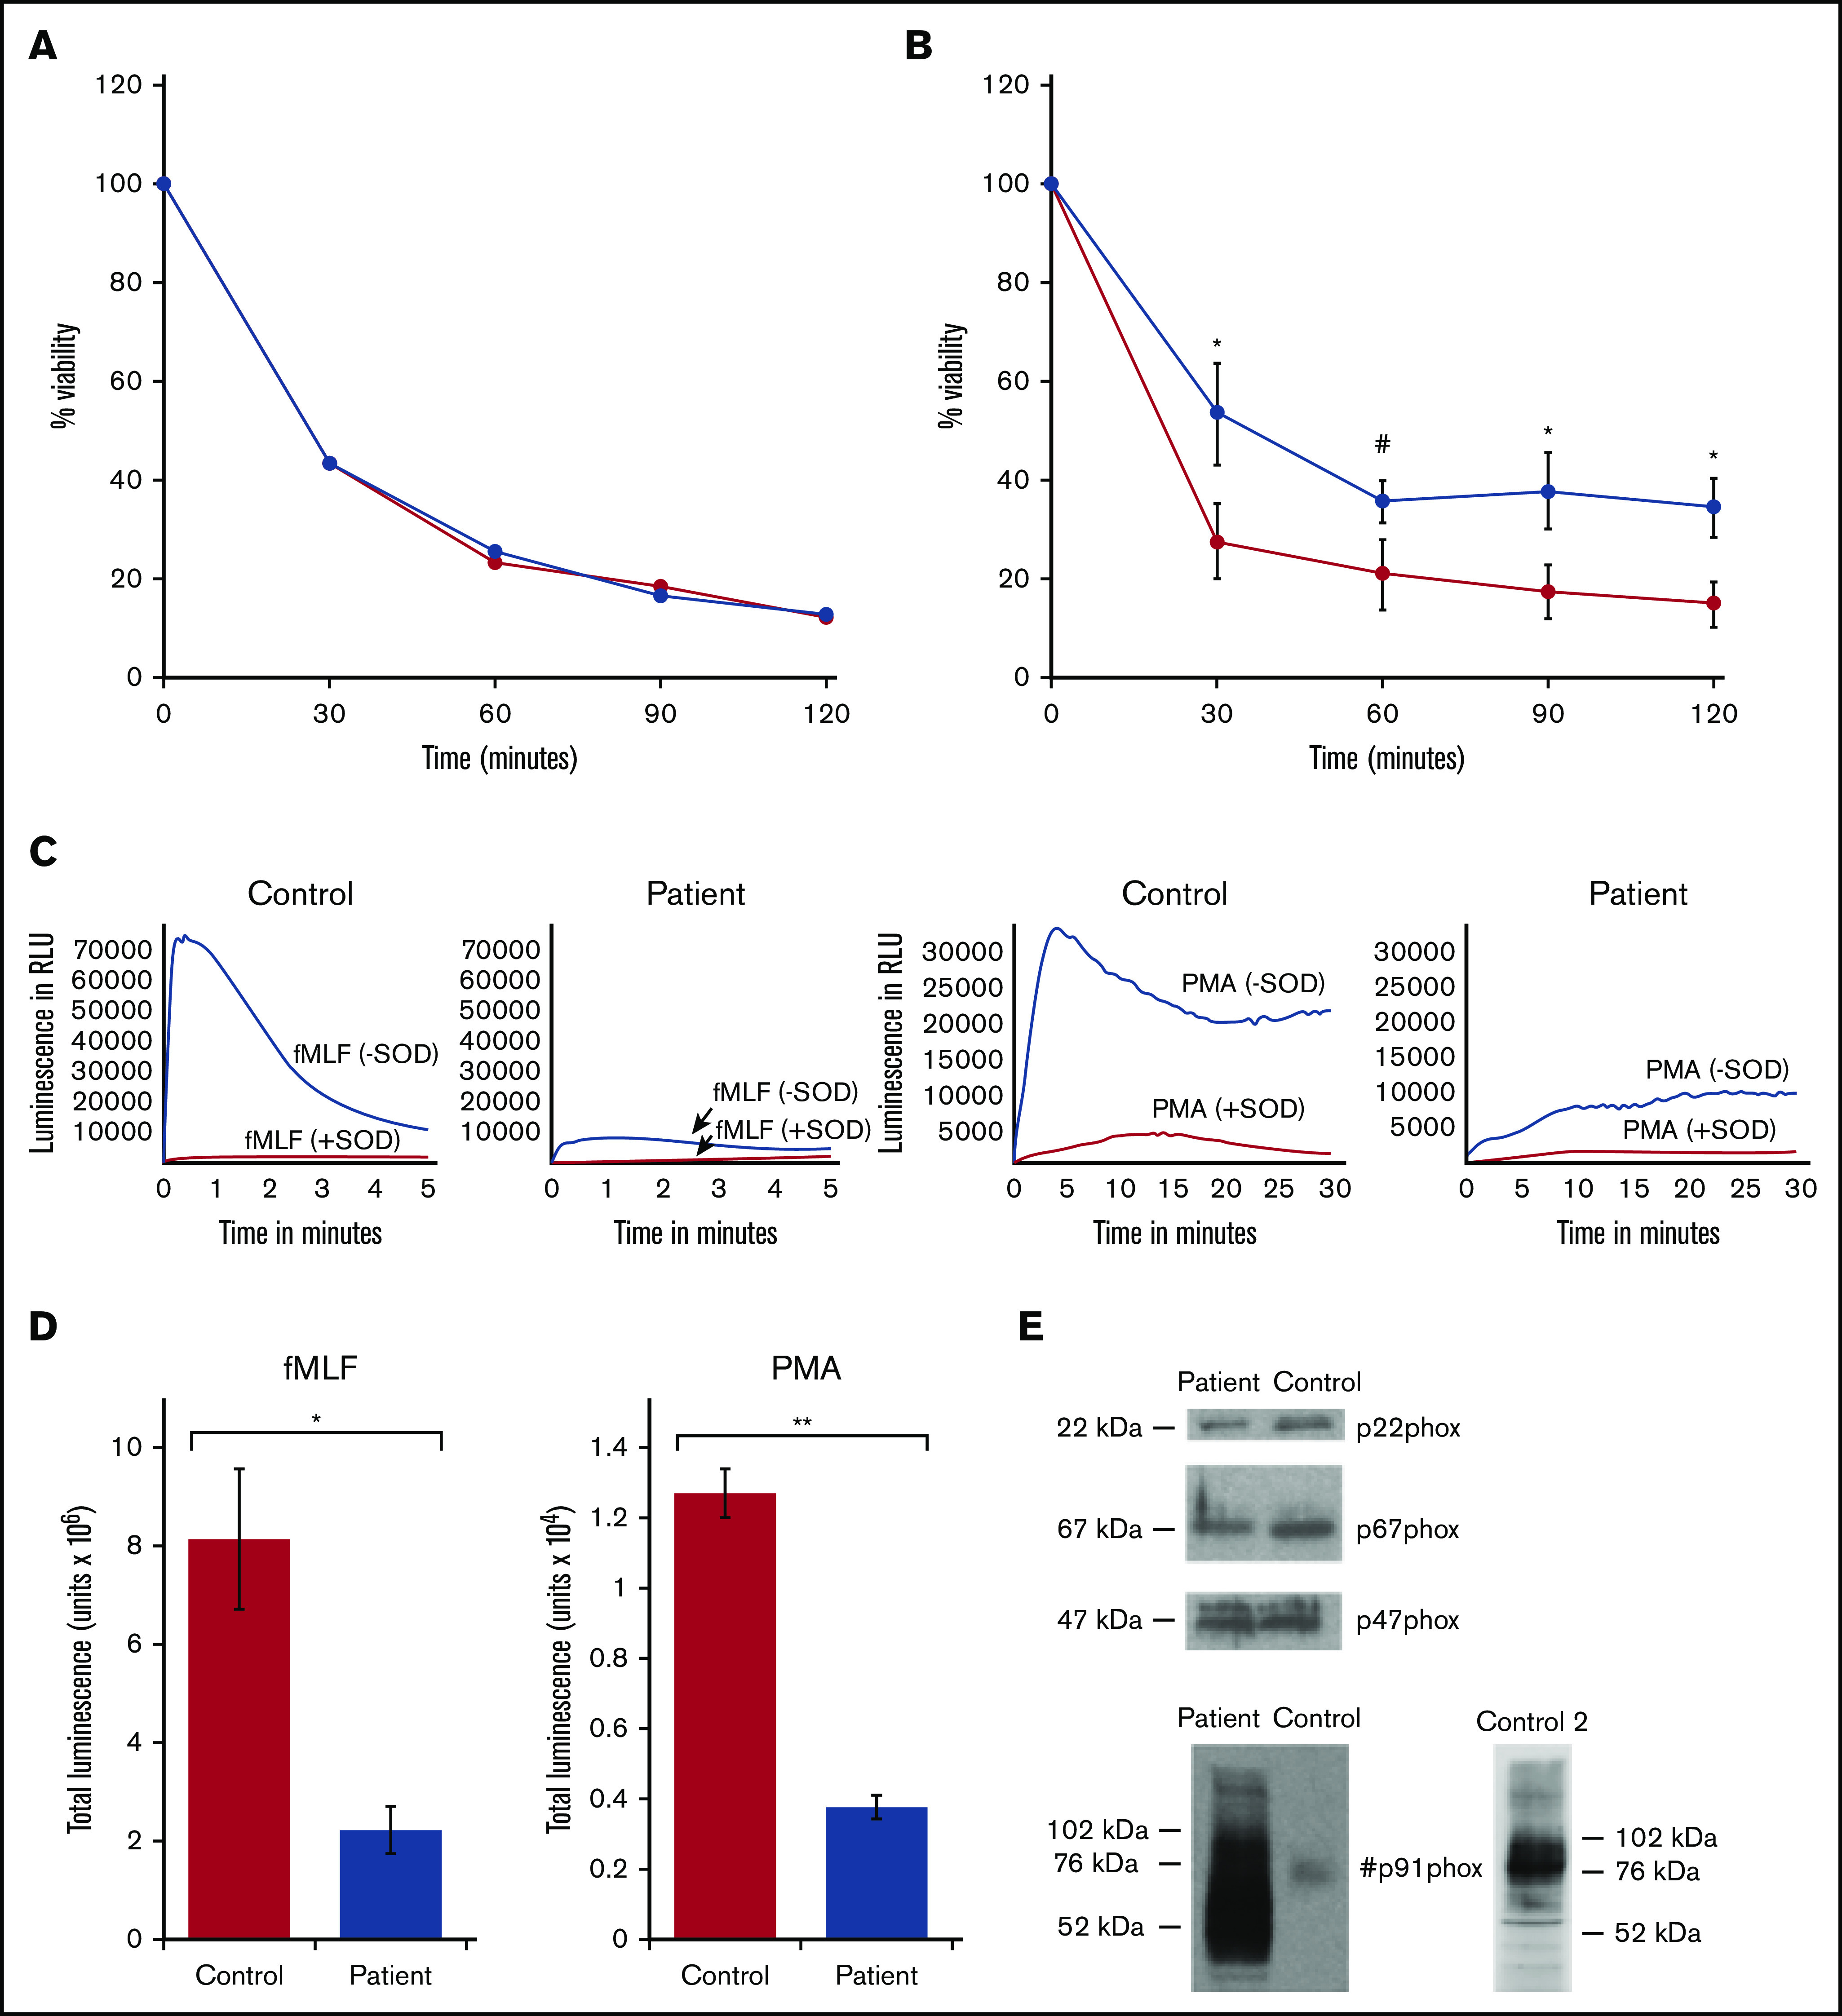
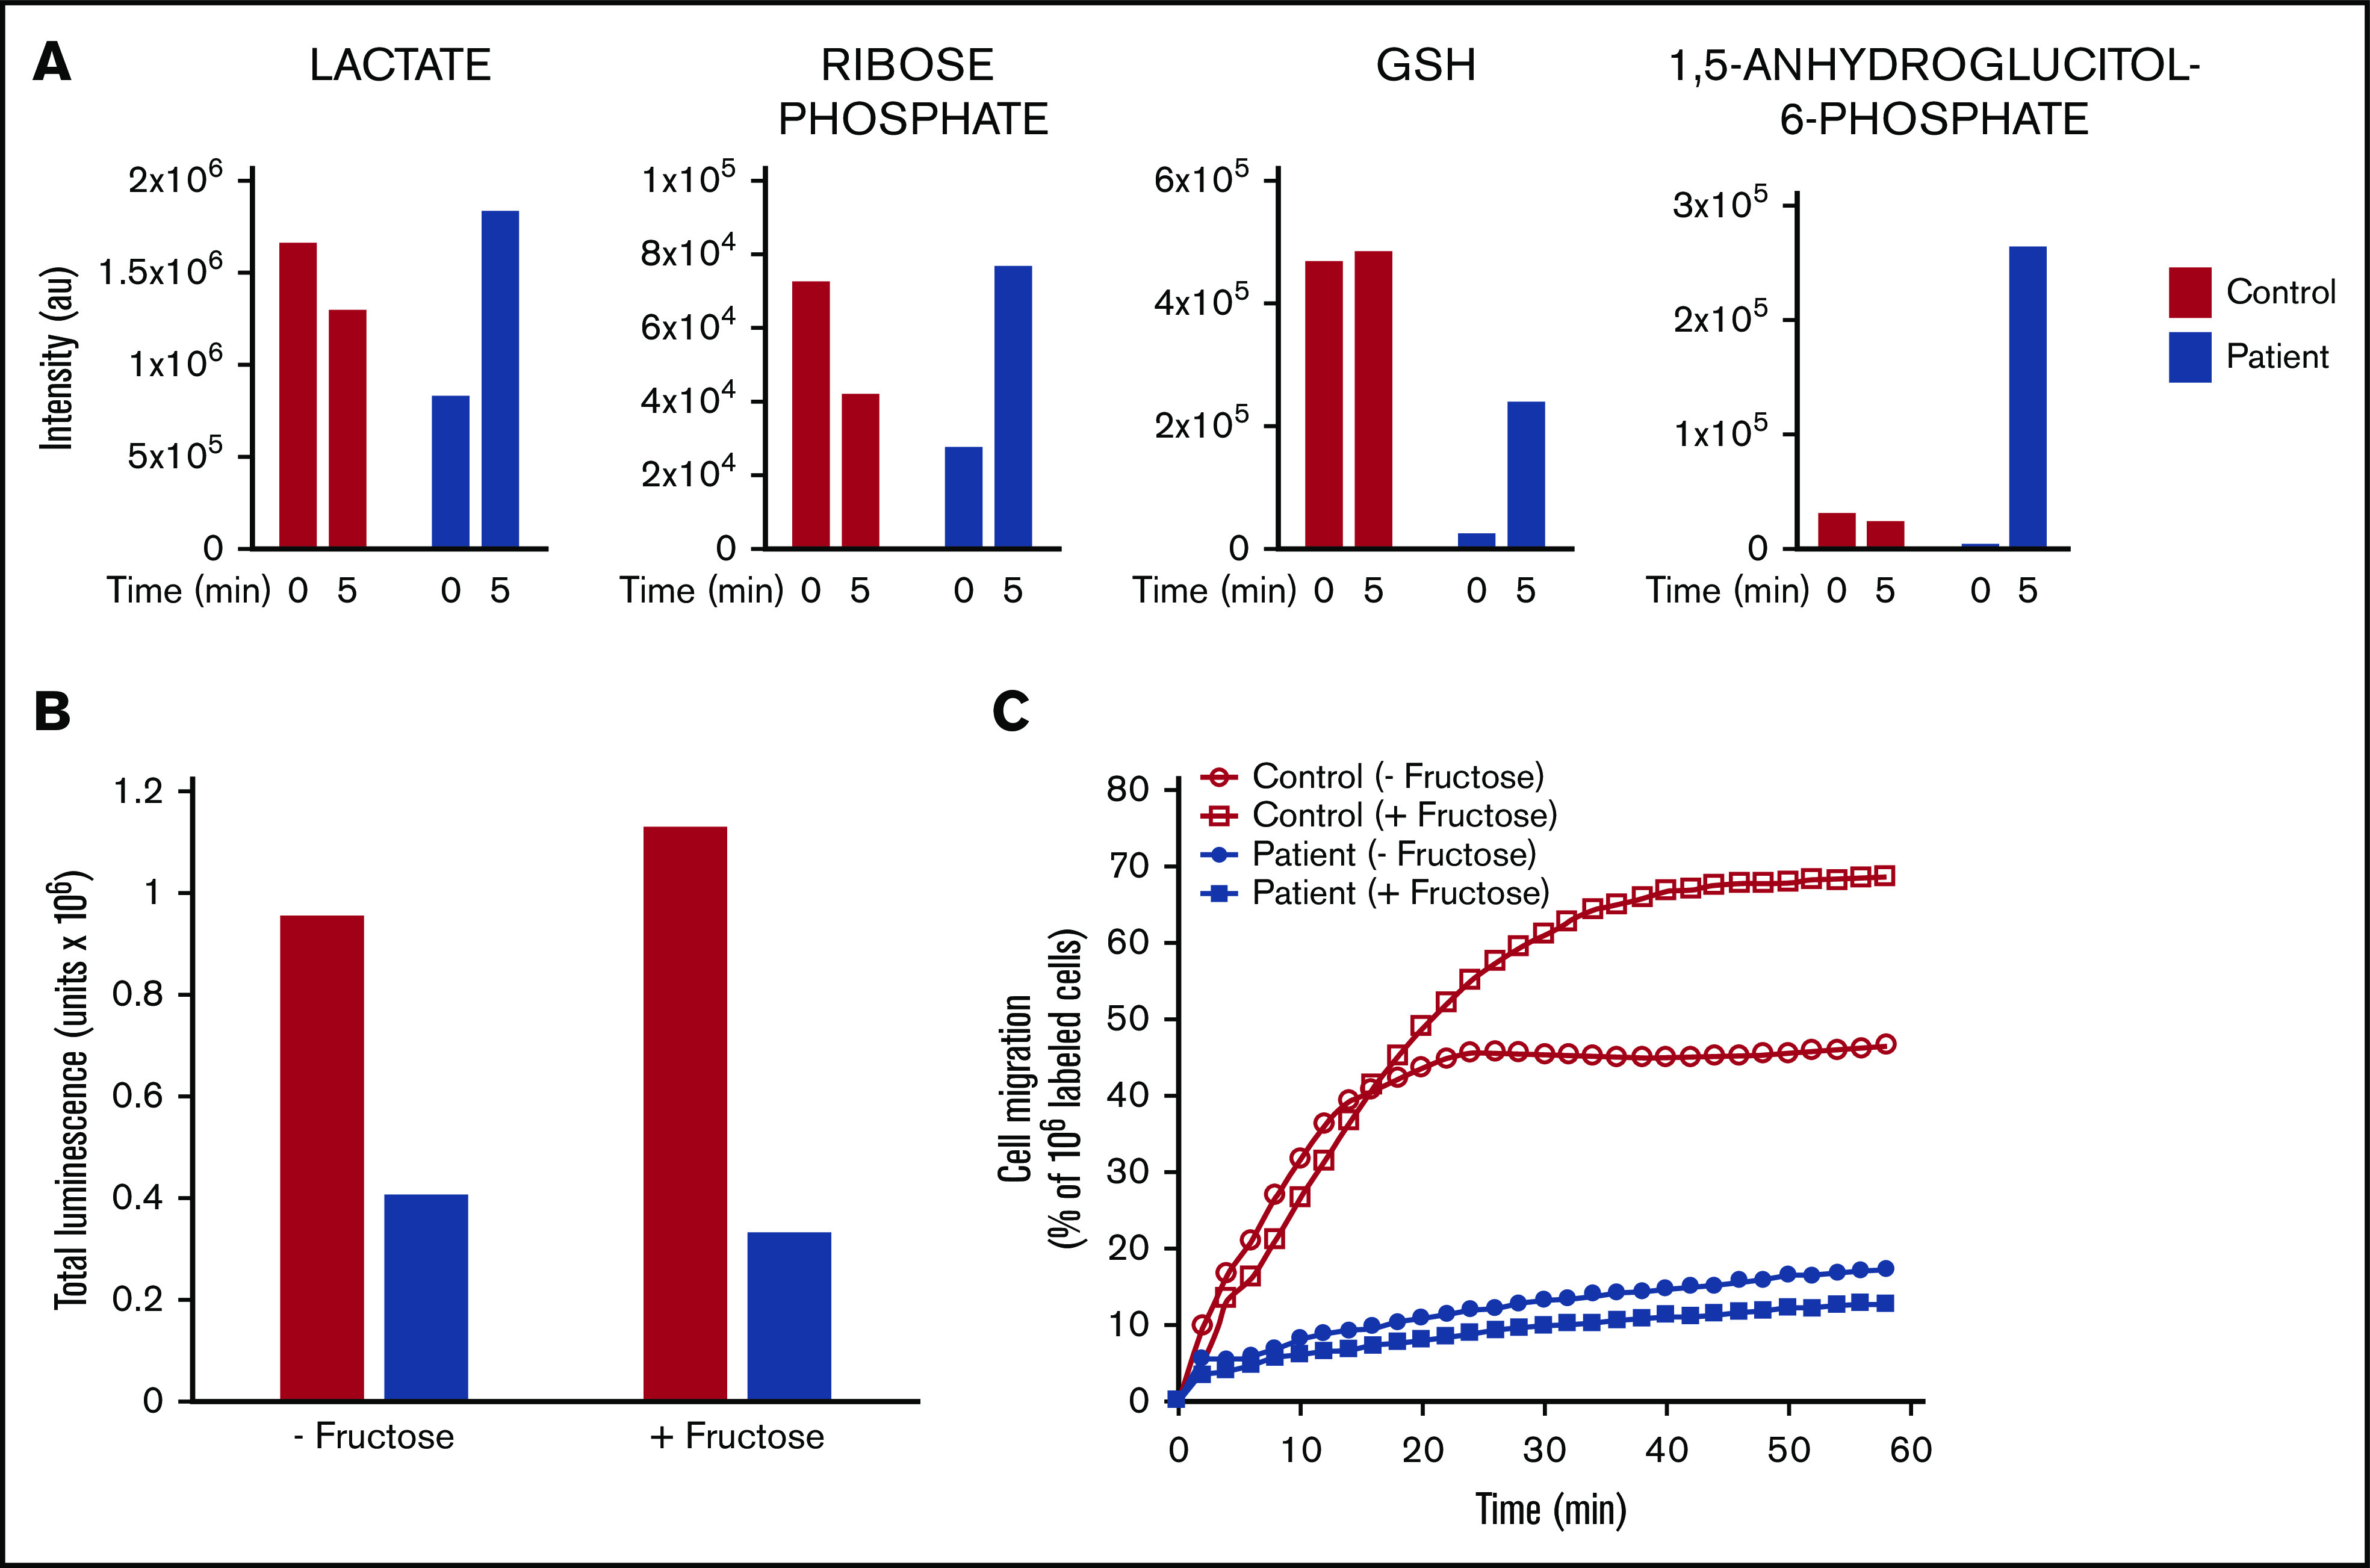
Severe congenital neutropenia type 4 (SCN-4) is an autosomal recessive condition in which mutations in the G6PC3 gene encoding for the catalytic 3 subunit of glucose-6-phosphatase-β result in neutropenia, neutrophil dysfunction, and other syndromic features. We report a child with SCN-4 caused by compound heterozygous mutations in G6PC3, a previously identified missense mutation in exon 6 (c.758G>A[p.R235H]), and a novel missense mutation in exon 2 (c.325G>A[p.G109S]). The patient had recurrent bacterial infections, inflammatory bowel disease, neutropenia, and intermittent thrombocytopenia. Administration of granulocyte colony-stimulating factor (G-CSF) resolved the neutropenia and allowed for detailed evaluation of human neutrophil function. Random and directed migration by the patient's neutrophils was severely diminished. Associated with this were defects in CD11b expression and F-actin assembly. Bactericidal activity at bacteria/neutrophil ratios >1:1 was also diminished and was associated with attenuated ingestion. Superoxide anion generation was <25% of control values, but phox proteins appeared quantitatively normal. Extensive metabolomics analysis at steady state and upon incubation with stable isotope-labeled tracers (U-13C-glucose, 13C,15N-glutamine, and U-13C-fructose) demonstrated dramatic impairments in early glycolysis (hexose phosphate levels), hexosemonophosphate shunt (required for the generation of the NADPH), and the total adenylate pool, which could explain the dramatic cell dysfunction displayed by the patient's neutrophils. Preliminary experiments with fructose supplementation to bypass the enzyme block demonstrated that the metabolic profile could be reversed, but was not sustained long enough for functional improvement. In human deficiency of G6PC3, metabolic defects resulting from the enzyme deficiency account for diverse neutrophil functional defects and present a major risk of infection.
© 2020 by The American Society of Hematology.
Conflict of interest statement
Conflict--interest disclosure: The authors declare no competing financial interests.
Figures


Similar articles
-
Altered Functions of Neutrophils in Two Chinese Patients With Severe Congenital Neutropenia Type 4 Caused by G6PC3 Mutations.Front Immunol. 2021 Jul 8;12:699743. doi: 10.3389/fimmu.2021.699743. eCollection 2021. Front Immunol. 2021. PMID: 34305938 Free PMC article.
-
Severe congenital neutropenia resulting from G6PC3 deficiency with increased neutrophil CXCR4 expression and myelokathexis.Blood. 2010 Oct 14;116(15):2793-802. doi: 10.1182/blood-2010-01-265942. Epub 2010 Jul 8. Blood. 2010. PMID: 20616219 Free PMC article.
-
A clinical and molecular review of ubiquitous glucose-6-phosphatase deficiency caused by G6PC3 mutations.Orphanet J Rare Dis. 2013 Jun 13;8:84. doi: 10.1186/1750-1172-8-84. Orphanet J Rare Dis. 2013. PMID: 23758768 Free PMC article. Review.
-
Lack of glucose recycling between endoplasmic reticulum and cytoplasm underlies cellular dysfunction in glucose-6-phosphatase-beta-deficient neutrophils in a congenital neutropenia syndrome.Blood. 2010 Oct 14;116(15):2783-92. doi: 10.1182/blood-2009-12-258491. Epub 2010 May 24. Blood. 2010. PMID: 20498302 Free PMC article.
-
Novel G6PC3 Mutations in Patients with Congenital Neutropenia: Case Reports and Review of the Literature.Endocr Metab Immune Disord Drug Targets. 2021;21(9):1660-1668. doi: 10.2174/1871530321666210616110631. Endocr Metab Immune Disord Drug Targets. 2021. PMID: 34137364 Review.
Cited by
-
Management of a Patient with Cardiovascular Disease Should Include Assessment of Primary and Secondary Immunodeficiencies: Part 1-Primary Immunodeficiencies.Healthcare (Basel). 2024 Oct 4;12(19):1976. doi: 10.3390/healthcare12191976. Healthcare (Basel). 2024. PMID: 39408156 Free PMC article. Review.
-
Treatment of the Neutropenia Associated with GSD1b and G6PC3 Deficiency with SGLT2 Inhibitors.Diagnostics (Basel). 2023 May 19;13(10):1803. doi: 10.3390/diagnostics13101803. Diagnostics (Basel). 2023. PMID: 37238286 Free PMC article. Review.
-
G6PC3 is involved in spermatogenesis by maintaining meiotic sex chromosome inactivation.Acta Biochim Biophys Sin (Shanghai). 2024 Oct 16;57(2):286-294. doi: 10.3724/abbs.2024172. Acta Biochim Biophys Sin (Shanghai). 2024. PMID: 39420835 Free PMC article.
-
Severe congenital neutropenia due to G6PC3 deficiency: early and delayed phenotype of a patient.Allergy Asthma Clin Immunol. 2023 Jun 9;19(1):51. doi: 10.1186/s13223-023-00804-4. Allergy Asthma Clin Immunol. 2023. PMID: 37296469 Free PMC article.
-
Molecular and clinical characterization of a founder mutation causing G6PC3 deficiency.Res Sq [Preprint]. 2024 Jul 11:rs.3.rs-4595246. doi: 10.21203/rs.3.rs-4595246/v1. Res Sq. 2024. Update in: J Clin Immunol. 2024 Dec 4;45(1):53. doi: 10.1007/s10875-024-01836-0. PMID: 39041036 Free PMC article. Updated. Preprint.
References
Publication types
MeSH terms
Substances
Grants and funding
LinkOut - more resources
Full Text Sources
Research Materials
