. 2021 Jan;51(1):180-190.
doi: 10.1002/eji.202049058. Epub 2020 Dec 23.

High seroprevalence but short-lived immune response to SARS-CoV-2 infection in Paris

Affiliations

High seroprevalence but short-lived immune response to SARS-CoV-2 infection in Paris

François Anna et al. Eur J Immunol. 2021 Jan.

Abstract

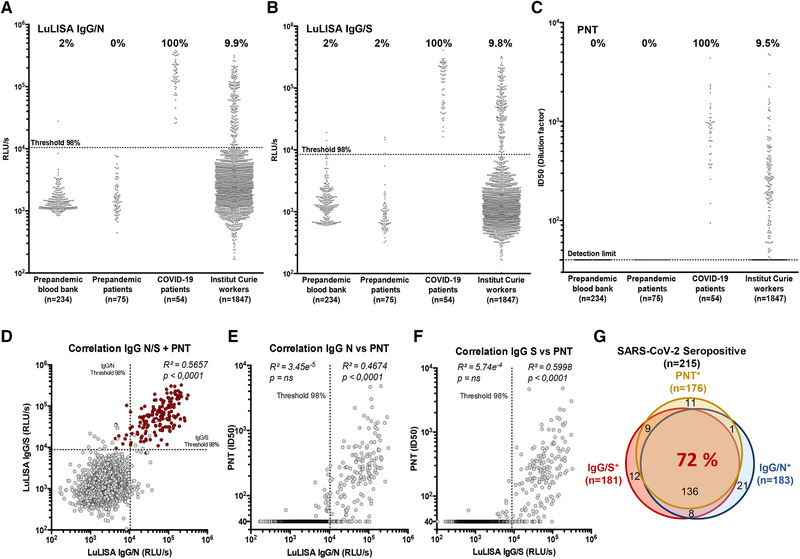
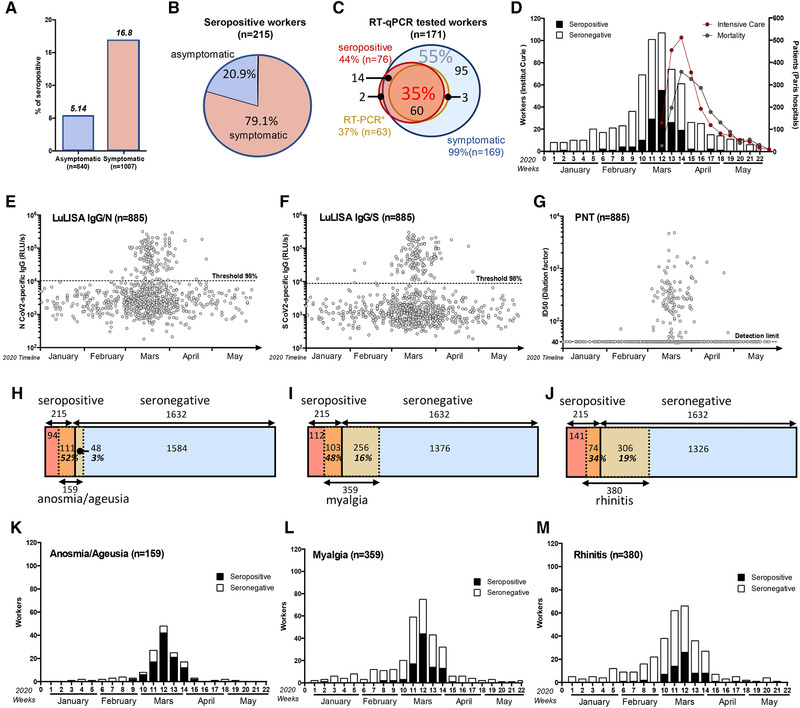
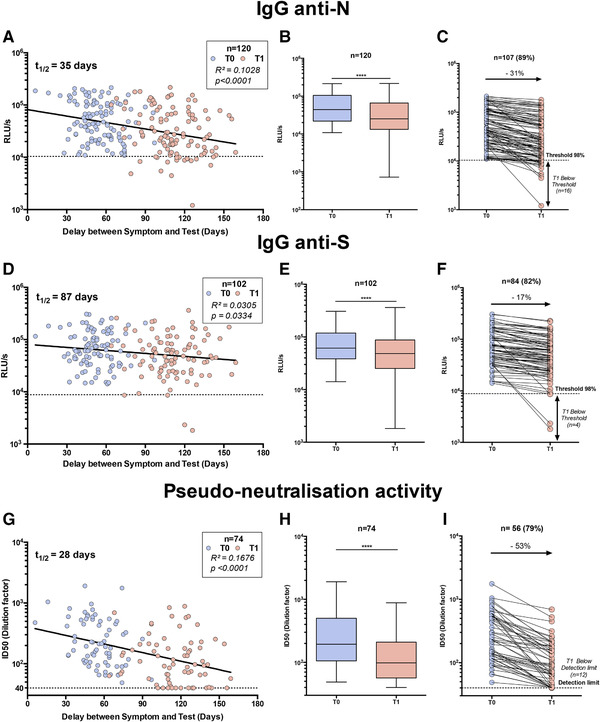
Although the COVID-19 pandemic peaked in March/April 2020 in France, the prevalence of infection is barely known. Using high-throughput methods, we assessed herein the serological response against the severe acute respiratory syndrome coronavirus 2 (SARS-CoV-2) of 1847 participants working in three sites of an institution in Paris conurbation. In May-July 2020, 11% (95% confidence interval [CI]: 9.7-12.6) of serums were positive for IgG against the SARS-CoV-2 N and S proteins, and 9.5% (95% CI: 8.2-11.0) were neutralizer in pseudo-typed virus assays. The prevalence of seroconversion was 11.6% (95% CI: 10.2-13.2) when considering positivity in at least one assay. In 5% of RT-qPCR positive individuals, no systemic IgGs were detected. Among immune individuals, 21% had been asymptomatic. Anosmia (loss of smell) and ageusia (loss of taste) occurred in 52% of the IgG-positive individuals and in 3% of the negative ones. In contrast, 30% of the anosmia-ageusia cases were seronegative, suggesting that the true prevalence of infection may have reached 16.6%. In sera obtained 4-8 weeks after the first sampling, anti-N and anti-S IgG titers and neutralization activity in pseudo-virus assay declined by 31%, 17%, and 53%, resulting thus in half-life of 35, 87, and 28 days, respectively. The population studied is representative of active workers in Paris. The short lifespan of the serological systemic responses suggests an underestimation of the true prevalence of infection.

Keywords: COVID-19; ELISA; LuLISA; SARS-CoV-2; bioluminescence.


Conflict of interest statement

YJ, SG, and TR have patented the proluciferins (hikarazines) synthesis and uses (EP 3395803/WO 2018197727, 2018) and applied for a patent, which includes claims describing the LuLISA. FA and PC have applied for a patent claiming the PNT. The rest of the authors declare no commercial or financial conflict of interest.

Figures

Figure 1
Figure 1
Serological responses to SARS‐CoV‐2 among Institut Curie workers using LuLISA IgG/N, IgG/S, and PNT assays. (A–C) Sera from prepandemic samples from healthy donors (blood bank), prepandemic patients (breast cancer), COVID‐19 patients (RT‐PCR positive), and Institut Curie workers were evaluated in LuLISA IgG/N (A) or IgG/S (B) and PNT (C) assays. For LuLISA, raw values are represented. Sera were considered positive for anti‐N or ‐S IgG if the value was above the 98% threshold (See Supporting Information Fig. S1 for calculation details). For PNT assay, values after ID50 calculation are represented (see Supporting Information Fig. S3 for calculation details and Fig. S7 for raw values). Negative sera are represented with an ID50 below detection limit (40). Percentages of positive are indicated above each series. (D) Correlation plots between LuLISA IgG/N, IgG/S, and PNT (red dots) or between PNT and LuLISA IgG/N (E) or IgG/S (F). Thresholds at confidence index of 98% are shown (dotted lines). Correlation coefficients (R 2) and associated p values from Pearson test (one‐tailed) are indicated above each corresponding area. Numerical values of each combination of assays are summarized with a Venn diagram (G) in overlapping areas. Proportion (%) of triple‐positive individuals is indicated in red.
Figure 2
Figure 2
Temporal distribution of symptoms appearance and serology correlates with COVID‐19 outbreak in France. (A) Seroprevalence among asymptomatic and symptomatic workers. (B) Proportion of asymptomatic and symptomatic seropositive workers. (C) Correlation between symptom reporting (blue circle), serological profile (red circle), and RT‐qPCR result (orange circle) among RT‐qPCR tested workers. Proportion (%) of triple‐positive individuals is indicated in red and RT‐qPCR negative, seronegative among symptomatic workers in blue. (D–G) Temporal distribution of serological test results according to the first symptom onset. (D) Number of workers (left y‐axis) reporting at least one symptom but seronegative (white) or seropositive (black). Curves of intensive care admission and mortality in all Paris hospitals are also plotted (right y‐axis). (E–G) Individual test results according to date of symptom onset. (E) LuLISA IgG/N, (F) LuLISA IgG/S, and (G) PNT. (H–J) Prevalence of symptoms according to serology status. Seropositive workers are represented in red and seronegative in blue. Symptomatic workers are represented in orange/yellow. Number of workers for each area is indicated. Percentage represents the proportion of symptomatic in seropositive (orange area) individuals and symptomatic in seronegative ones (yellow area). (K–M) Prevalence of symptoms during pandemic outbreak according to serology status. Plots represent the number of workers reporting symptoms (y‐axis) per week in 2020 (x‐axis). Only the three most representative symptoms from Table 2 are plotted: Anosmia/ageusia as an example of temporally and clinically correlated to COVID‐19 (H and K), Myalgia as clinically only correlated (I and L), and rhinitis as poorly correlated (J and M).
Figure 3
Figure 3
Serological profile follow‐up overtime. Workers whose serum was positive for IgG anti‐N (A–C), anti‐S (D–F), and pseudo‐neutralization activity (G–I) at the first blood sampling (t 0) were reassessed together with serum obtained 6–12 weeks later (t1 ). (A–G) Test values according to delay between date of symptom onset and the two serum analyses: t 0 (blue dots) and t 1 (red dots). Linear regression is plotted. Coefficient of determination and associated p value are indicated. (B–H) Whisker‐plots summarizing test value for both tests (t 0 and t 1). Statistical significance was determined using a Wilcoxon test (****p < 0.0001). (C–I) Individual follow‐up of seropositive workers with a decreasing value. Variation of mean (t 0 /t 1) is indicated in %.

References

    1. Guan, W. J. , Ni, Z. Y. , Hu, Y. , Liang, W. H. , Ou, C. Q. , He, J. X. , Liu, L. et al., Clinical characteristics of coronavirus disease 2019 in China. N. Engl. J. Med. 2020. 382: 1708–1720. - PMC - PubMed
    1. Wu, F. , Zhao, S. , Yu, B. , Chen, Y. M. , Wang, W. , Song, Z. G. , Hu, Y. et al., A new coronavirus associated with human respiratory disease in China. Nature 2020. 579: 265–269. - PMC - PubMed
    1. Zhu, N. , Zhang, D. , Wang, W. , Li, X. , Yang, B. , Song, J. , Zhao, X. , et al., A novel coronavirus from patients with pneumonia in China, 2019. N. Engl. J. Med. 2020. 382: 727–733. - PMC - PubMed
    1. Lescure, F. X. , Bouadma, L. , Nguyen, D. , Parisey, M. , Wicky, P. H. , Behillil, S. , Gaymard, A. et al., Clinical and virological data of the first cases of COVID‐19 in Europe: a case series. Lancet Infect. Dis. 2020. 20: 697–706. - PMC - PubMed
    1. Wolfel, R. , Corman, V. M. , Guggemos, W. , Seilmaier, M. , Zange, S. , Muller, M. A. , Niemeyer, D. et al., Virological assessment of hospitalized patients with COVID‐2019. Nature 2020. 581: 465–469. - PubMed

Publication types