. 2020 Dec 10;183(6):1617-1633.e22.
doi: 10.1016/j.cell.2020.11.012. Epub 2020 Nov 30.

Histone H3.3G34-Mutant Interneuron Progenitors Co-opt PDGFRA for Gliomagenesis

Affiliations

Histone H3.3G34-Mutant Interneuron Progenitors Co-opt PDGFRA for Gliomagenesis

Carol C L Chen et al. Cell. .

Abstract

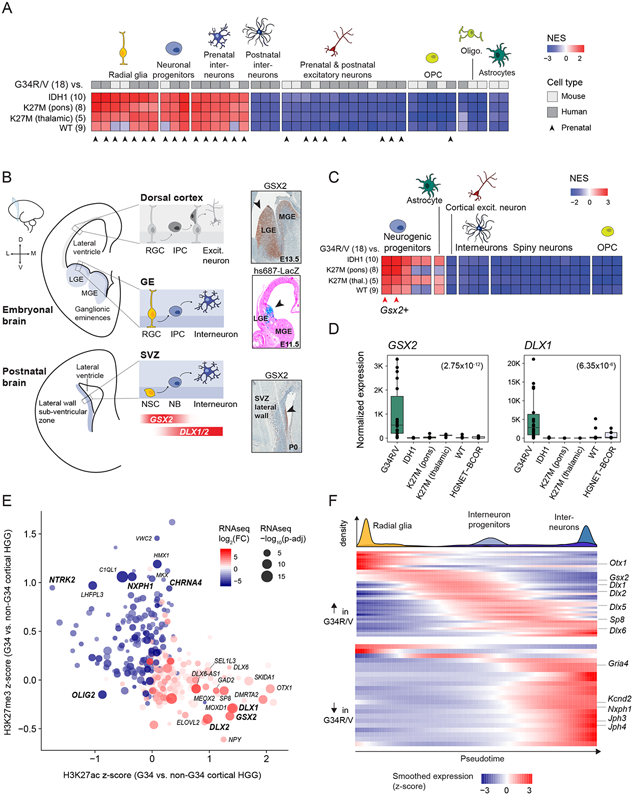
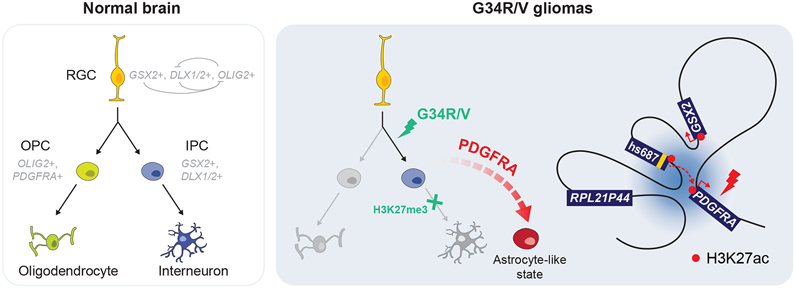
Histone H3.3 glycine 34 to arginine/valine (G34R/V) mutations drive deadly gliomas and show exquisite regional and temporal specificity, suggesting a developmental context permissive to their effects. Here we show that 50% of G34R/V tumors (n = 95) bear activating PDGFRA mutations that display strong selection pressure at recurrence. Although considered gliomas, G34R/V tumors actually arise in GSX2/DLX-expressing interneuron progenitors, where G34R/V mutations impair neuronal differentiation. The lineage of origin may facilitate PDGFRA co-option through a chromatin loop connecting PDGFRA to GSX2 regulatory elements, promoting PDGFRA overexpression and mutation. At the single-cell level, G34R/V tumors harbor dual neuronal/astroglial identity and lack oligodendroglial programs, actively repressed by GSX2/DLX-mediated cell fate specification. G34R/V may become dispensable for tumor maintenance, whereas mutant-PDGFRA is potently oncogenic. Collectively, our results open novel research avenues in deadly tumors. G34R/V gliomas are neuronal malignancies where interneuron progenitors are stalled in differentiation by G34R/V mutations and malignant gliogenesis is promoted by co-option of a potentially targetable pathway, PDGFRA signaling.

Keywords: GSX2; H3.3 G34R/V; PDGFRA; cell-of-origin; chromatin conformation; gliomas; interneuron progenitors; oncohistones; pediatric cancer; single-cell transcriptome.


Conflict of interest statement

Declaration of Interests P.B. and R.B. receive grant funding from the Novartis Institute of Biomedical Research for an unrelated project. J.R.H. has received compensation for consultation from Bayer for unrelated work.

Figures

Figure 1.
Figure 1.. PDGFRA is frequently mutated in G34R/V tumours.
A. Oncoprint showing frequent occurrence of PDGFRA mutations in G34R/V (n = 95), relative to K27M (n = 53), IDH1/SETD2 (n = 80), and H3/IDH1-WT (n = 28) HGG subgroups, details in Table S1. Lines linking consecutive G34R/V samples indicate primary/recurrent tumours from the same patient. B. Spectrum and frequency of PDGFRA somatic mutations identified in G34R/V HGGs. Bold face indicates mutations observed in 2 or more patients. C. Immunohistochemistry staining of total PDGFRA and phosphorylated ERK1/2 in G34R/V HGGs, separated by PDGFRA mutation status. A primary PDGFRAWT and recurrence PDGFRAMUT tumour pair (P-1190) are indicated. See also Figure S1 and Table S1.
Figure 2.
Figure 2.. Transcriptional and epigenetic programs in G34R/V gliomas indicate an interneuron progenitor origin.
A. Heatmap of enrichment scores of forebrain cell type signatures in G34R/V compared to other HGG subgroups, by gene set enrichment analysis (GSEA). Normalized Enrichment Scores (NES) are shown for all signatures significantly enriched (adjusted p-value < 0.01) in G34R/V vs. IDH1. Number of tumour samples is indicated in parentheses. OPC: oligodendrocyte progenitor cells. B. Left: Schematic of the embryonic and postnatal forebrain, coronal section. LGE: lateral ganglionic eminence; MGE: medial ganglionic eminence, RGC: radial glia cell; IPC: intermediate neuronal progenitor cell, NSC: neural stem cell, NB: neuroblast. Right: Immunohistochemistry staining of Gsx2 in sagittal sections of E13.5 mouse ganglionic eminences (GE) and P0 (SVZ), and enhancer reporter activity of hs687-LacZ in coronal sections of E11.5 mouse embryos profiled by VISTA enhancer browser. C. Heatmap of enrichment scores of striatal sub-ventricular zone (SVZ) cell type signatures in G34R/V compared to other HGG subgroups, by GSEA. NES scores are shown for all signatures significantly enriched (adjusted p-value < 0.01) in G34R/V vs. IDH1. Number of samples is indicated in parentheses. D. Expression levels of interneuron markers GSX2 and DLX1 in tumour subgroups. Adjusted p-values (Negative Binomial Wald test) for the comparison of G34R/V to other entities are indicated in parentheses. E. Promoter-associated H3K27ac and H3K27me3 for genes significantly differentially expressed between G34R/V and IDH1 HGG by bulk RNA-seq. Genes relevant to glioma (OLIG2), or with high G34R/V-enrichment of either mark (z-score > 0.9) and RNA-seq absolute log2 fold change > 3 are labelled. F. Gene expression levels of G34R/V-specific genes along the interneuron differentiation trajectory (Jessa et al., 2019). Top panel: density of each cell type along pseudotime. Bottom panel: expression of genes identified as specific to G34R/V gliomas by epigenome and transcriptome analyses. Up in G34R/V: genes in the leading edge of the most enriched human interneuron signature, or genes upregulated by RNAseq and enriched for H3K27ac in G34R/V. Down in G34R/V: genes in the leading edge of the most depleted human interneuron signature, or genes downregulated by RNAseq and enriched for H3K27me3 in G34R/V (see Methods). Expression is z-scored across pseudotime. See also Figure S2, and Tables S2 and S3.
Figure 3.
Figure 3.. G34R/V HGGs aberrantly express PDGFRA, unlike normal interneuron progenitors.
A. Expression of selected interneuron transcription factors in the patient-derived cell line HSJD-GBM002 in stem cell media (top, n = 6) or differentiation media (bottom, n = 2). Green: unedited or parental clones containing G34R. Blue: edited clones with the G34R mutation removed by CRISPR. Horizontal bar indicates the median. B. Parallel coordinate plot depicting epigenomic and transcriptomic changes in HSJD-GBM002 G34R and edited clones. Genomic bins (5kb) were stratified into 6 quantiles (Q1 to Q6) based on H3K36me3 difference upon CRISPR editing, and changes for the other histone marks and transcription were computed for each quantile. Solid line = median, shaded area = 25% and 75% percentile. C. Single-sample gene set enrichment (ssGSEA) score for radial glia cell (RGC) and interneuron gene signatures in transcriptomes of HSJD-GBM002 clones in differentiation media. D. Pdgfra, Gsx2, and Dlx1/2 expression in mouse scRNA-seq developmental forebrain atlas (left) and postnatal striatal sub-ventricular zone (SVZ) atlas (right). Mean expression and proportion of cells expressing the gene are indicated. OPC: oligodendrocyte progenitor cells. E. 5kb genomic bins ranked by H3K27ac z-score, showing the top-ranking loci with H3K27ac enrichment in G34R/V vs. non-G34 HGGs. See also Figures S3 and S4, and Tables S2 and S3.
Figure 4.
Figure 4.. Active chromatin conformation facilitates PDGFRA-GSX2 co-option in G34R/V tumours.
A. Top, Hi-C heatmaps depicting sub-TAD structure at the PDGFRA-GSX2-hs687 locus in glioma cell lines. Small black triangle illustrates a TAD between PDGFRA and the hs687 enhancer enriched for contacts in G34R/V lines. Large dashed triangle demarcates the TAD formed by contact to a known distal insulator. Heatmap represents the log2 ratios of observed interactions relative to expected interactions at a 5kb resolution. Middle, virtual 4C plots representing the average intensity of PDGFRA-anchored contacts in G34R/V and non-G34 glioma cell lines. Black bar denotes virtual 4C anchor region. Red bar and * denotes regions with significantly increased contact in G34R/V relative to non-G34 lines (p-value < 0.05). Bottom, composite CTCF and H3K27ac ChIP-seq of primary cortical glioma G34R/V, IDH1/SETD2, and WT subgroups. Teal bars and * denotes significantly H3K27ac-enriched regions in G34R/V (z-score > 0.5, p-value < 0.05). B. Top, Hi-C heatmaps from murine embryonic stem cells (ESCs), E13.5 cortex and ganglionic eminences (GE) depicting sub-TAD structure at the Pdgfra-Gsx2-hs687 locus, as in (A). Middle, virtual 4C plots representing the average intensity of Pdgfra-anchored contacts in ESCs, E13.5 cortex and ganglionic eminences. Black bar denotes virtual 4C anchor region. Red bar and * denotes regions with significantly increased contact in GE relative to cortex (p-value < 0.05). Grey bar and * denotes region with significantly increased contact in ESC, relative to cortex (p-value < 0.05). Bottom, PRC2 ChIA-PET in ESCs illustrating PRC2-bound chromatin contacts. Underneath, H3K27me3, H3K27ac and H3K4me3 ChIP-seq for ESCs, murine adult cortex and E13.5 GE. C. Schematic illustrating chromosome conformation and chromatin landscape at the Pdgfra-hs687 locus. The active hs687 enhancer (yellow) is in close contact with poised Pdgfra selectively in the ganglionic eminences. See also Figure S5, and Table S4.
Figure 5.
Figure 5.. G34R/V tumours are devoid of oligodendrocytes, and PDGFRA mutant tumours exhibit expanded astrocytic compartments.
A. UMAP embedding of scRNA-seq G34R/V malignant cells from patient samples colored by patient of origin (left) or consensus cell type projection (middle, right). The two primary/recurrence tumour pairs are highlighted. B. Pie charts depicting the proportion of each cell type in individual tumours. C. Radar plots depicting the proportion of cells projected to a certain cell type within each tumour entity. Each line represents one sample, color coded as in (A) for G34R/V tumours. Outer circle: 100%, middle circle: 50%, inner circle: 0%. D. Mean expression of foetal interneuron and astrocyte gene signatures in individual cells from mouse scRNA-seq developmental forebrain atlas (left), and in cells from G34R/V tumours (right). For tumours, only cells called malignant and projected as neurons or astrocytes were included. See also Figure S6, and Table S5.
Figure 6.
Figure 6.. Mutant Pdgfra is a strong oncogenic driver while G34R/V may be dispensable for tumour maintenance.
A. Left, fish plots depicting tumour clonal structure of G34R/V primary and matched recurrence samples from patients P-1978, P-1190, and P-3200. Right, phylogeny of G34R/V primary and matched recurrence samples from patients P-1978, P-1190, and P-3200. Scale bar: 10 mutations. Dashed lines: potentially germline mutations. B. Doughnut plots representing the proportion of cells projected to each cell type in two primary/recurrence pairs, highlighting the increased proportion of astrocyte-like cells in the PDGFRAMUT recurrence (outer circle) compared to the PDGFRAWT primary tumour (inner circle). C. Immunohistochemical GFP staining of coronal forebrain sections from in-utero electroporated mice. All mice received shAtrx, sgTp53 in addition to PdgfraWT or PdgraD842V, and H3.3 WT/G34R. D. Kaplan-Meier curve depicting survival of in-utero electroporated mice. All mice received shAtrx, sgTp53 in addition to PdgfraWT or PdgraD842V, and empty vector/H3.3 WT/G34R. E. Immunofluorescence validation of CRISPR-mediated removal of G34V in KNS-42 clones. F. Kaplan-Meier survival curves of KNS-42 clones. Teal depicts the parental line carrying G34V, dashed blue depicts edited clones. G. Immunofluorescence validation of CRISPR-mediated repair/removal of G34R in HSJD-GBM002 clones. H. Kaplan-Meier survival curves of HSJD-GBM002 clones. Teal depicts the parental and unedited clones carrying G34R, dashed blue depicts edited clones. See also Figure S7, and Table S6.
Figure 7.
Figure 7.. Model of aberrant development in G34R/V gliomas, compared to normal development in the ventral forebrain.
Left: During normal development, radial glial cells (RGC) in the ventral forebrain give rise to oligodendrocyte precursor cells (OPC) which differentiate into oligodendrocytes, and intermediate neuronal progenitor cells (IPC) which differentiate into cortical interneurons. Right: G34R/V gliomas retain molecular features of a committed interneuron progenitor (GSX2, DLX1/2+) and oncohistone-mediated H3K27me3 gain may impede terminal neuronal differentiation. G34R/V tumours exhibit dual neuronal and astrocytic components. Elevated expression and oncogenic PDGFRA mutation may promote the abnormal astrocyte-like state. G34R/V HGGs display a topologically associated domain (TAD) which brings the GSX2 associated cis-regulatory elements (hs687) into proximity with the PDGFRA promoter to induce overexpression.

References

    1. Anderson AG, Kulkarni A, Harper M, and Konopka G (2020). Single-Cell Analysis of Foxp1-Driven Mechanisms Essential for Striatal Development. Cell reports 30, 3051–3066.e3057. - PMC - PubMed
    1. Barbie DA, Tamayo P, Boehm JS, Kim SY, Moody SE, Dunn IF, Schinzel AC, Sandy P, Meylan E, Scholl C, et al. (2009). Systematic RNA interference reveals that oncogenic KRAS-driven cancers require TBK1. Nature 462, 108–112. - PMC - PubMed
    1. Bolger AM, Lohse M, and Usadel B (2014). Trimmomatic: a flexible trimmer for Illumina sequence data. Bioinformatics (Oxford, England) 30, 2114–2120. - PMC - PubMed
    1. Bonev B, Mendelson Cohen N, Szabo Q, Fritsch L, Papadopoulos GL, Lubling Y, Xu X, Lv X, Hugnot J-P, Tanay A, et al. (2017). Multiscale 3D Genome Rewiring during Mouse Neural Development. Cell 171, 557–572.e524. - PMC - PubMed
    1. Bourgey M, Dali R, Eveleigh R, Chen KC, Letourneau L, Fillon J, Michaud M, Caron M, Sandoval J, Lefebvre F, et al. (2019). GenPipes: an open-source framework for distributed and scalable genomic analyses. GigaScience 8. - PMC - PubMed

Publication types

MeSH terms