. 2020 Dec 10;183(6):1634-1649.e17.
doi: 10.1016/j.cell.2020.11.004. Epub 2020 Nov 30.

Shared Immunogenic Poly-Epitope Frameshift Mutations in Microsatellite Unstable Tumors

Affiliations

Shared Immunogenic Poly-Epitope Frameshift Mutations in Microsatellite Unstable Tumors

Vladimir Roudko et al. Cell. .

Abstract

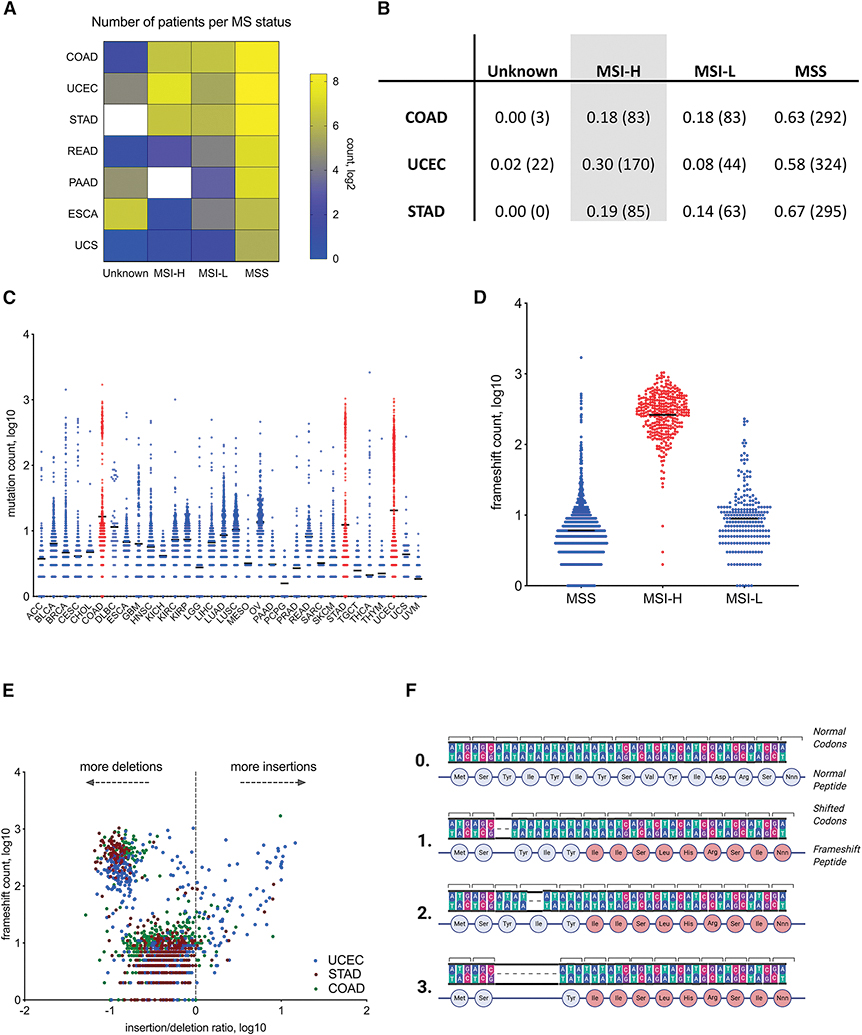
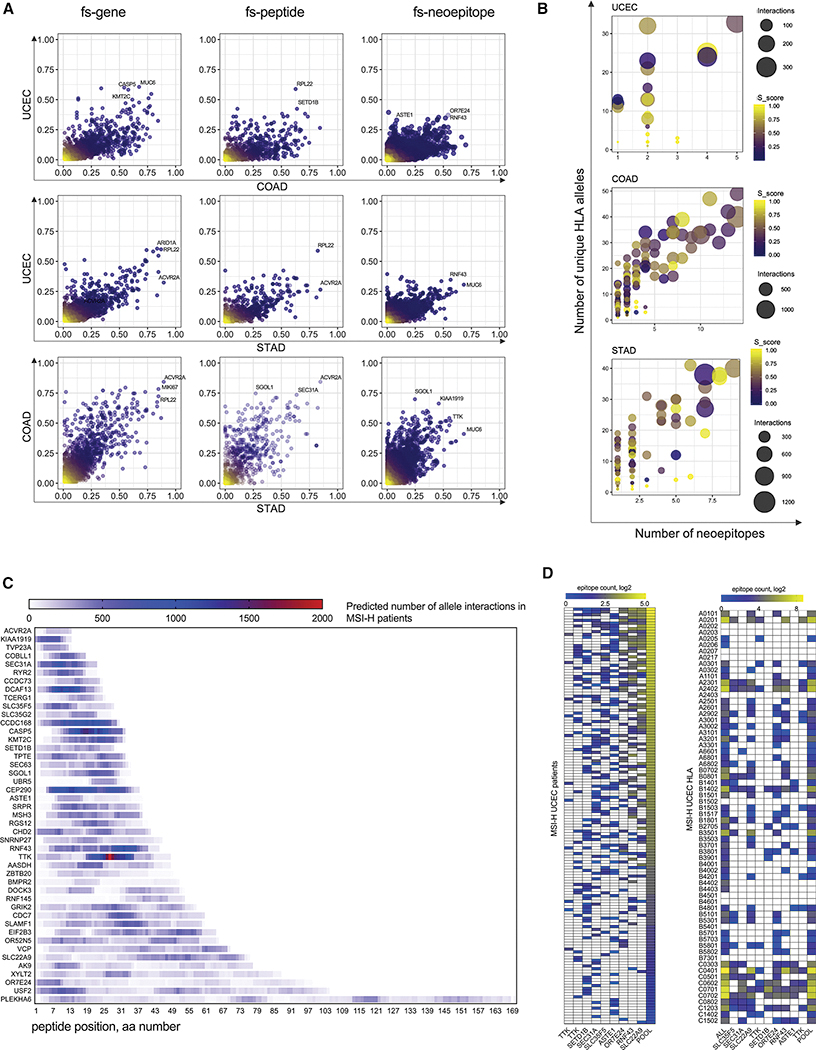
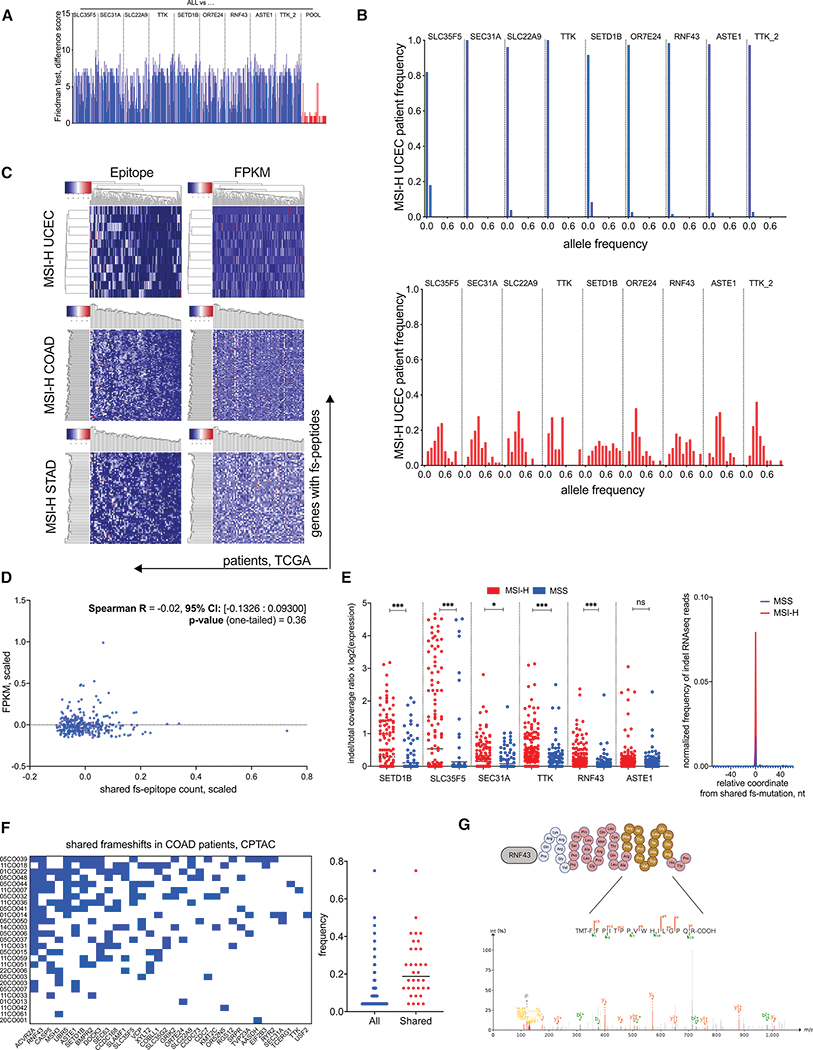
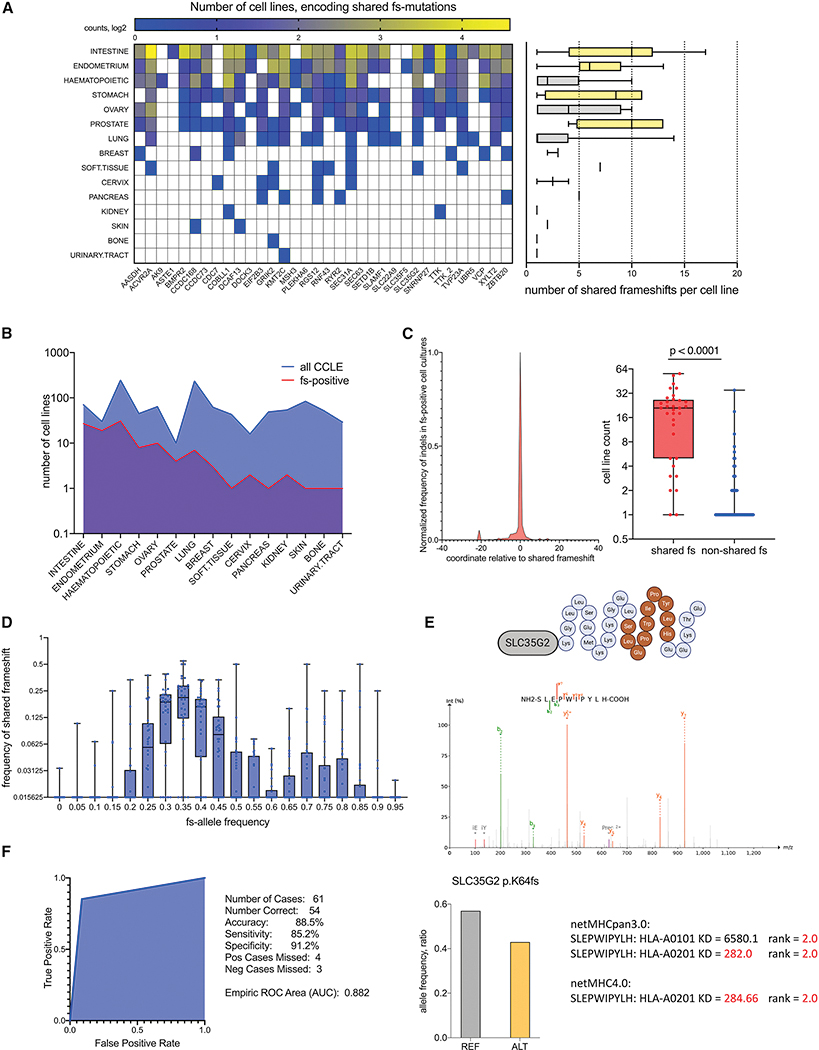
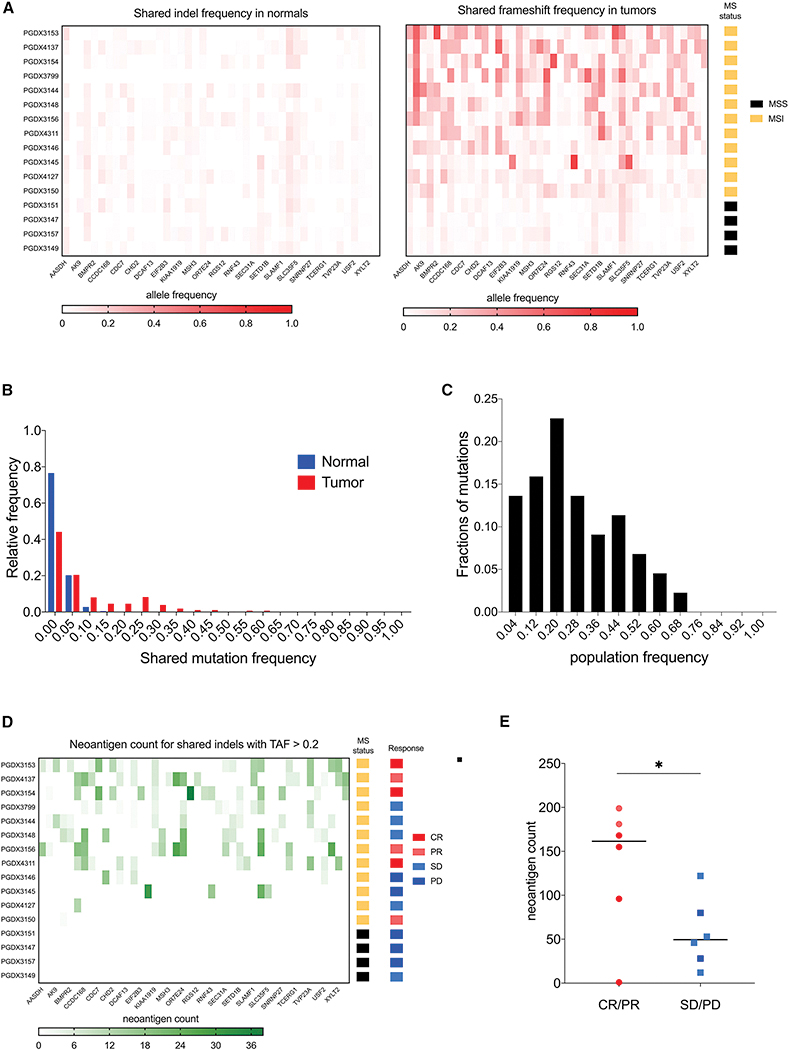
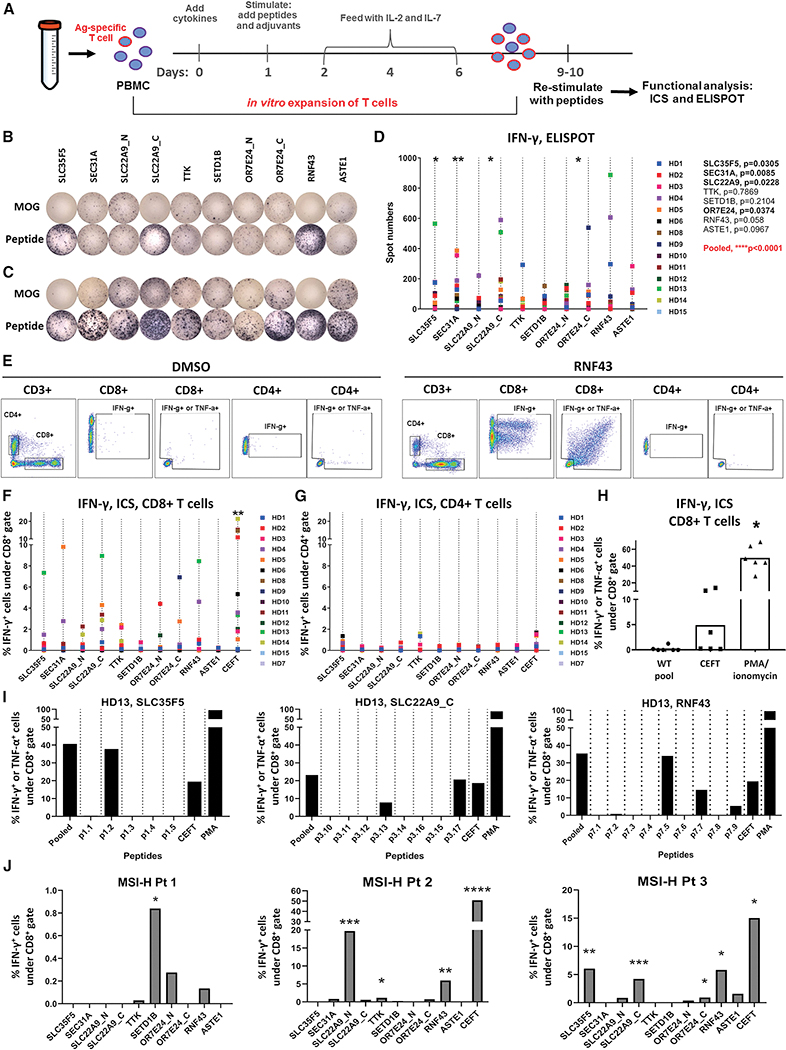
Microsatellite instability-high (MSI-H) tumors are characterized by high tumor mutation burden and responsiveness to checkpoint blockade. We identified tumor-specific frameshifts encoding multiple epitopes that originated from indel mutations shared among patients with MSI-H endometrial, colorectal, and stomach cancers. Epitopes derived from these shared frameshifts have high population occurrence rates, wide presence in many tumor subclones, and are predicted to bind to the most frequent MHC alleles in MSI-H patient cohorts. Neoantigens arising from these mutations are distinctly unlike self and viral antigens, signifying novel groups of potentially highly immunogenic tumor antigens. We further confirmed the immunogenicity of frameshift peptides in T cell stimulation experiments using blood mononuclear cells isolated from both healthy donors and MSI-H cancer patients. Our study uncovers the widespread occurrence and strong immunogenicity of tumor-specific antigens derived from shared frameshift mutations in MSI-H cancer and Lynch syndrome patients, suitable for the design of common "off-the-shelf" cancer vaccines.


Conflict of interest statement

Declaration of Interests N.B. is an extramural member of the Parker Institute for Cancer Immunotherapy (PICI), receives research funds from Genentech, Oncovir, Regeneron and Dragonfly Therapeutics, and is on the advisory boards of Novartis, Roche, Avidea, Boehringer Ingelheim, Rome Therapeutics, BreakBio, Carisma Therapeutics, Roswell Park, and the Cancer Research Institute. C.B. is a PICI Bridge scholar. B.G. has received honoraria for speaking engagements from Merck, Bristol-Meyers Squibb, and Chugai Pharmaceuticals, has received research funding from Bristol-Meyers Squibb, and has been a compensated consultant for PMV Pharma and Rome Therapeutics of which he is a cofounder. V.R., C.C.B., N.B., B.G., S.B., and T.O. have a pending provisional patent application (no. 62/813,829 filed on March 5, 2019). The other authors have not declared any competing interests.

Figures

Figure 1.
Figure 1.
Microsatellite instability in COAD, STAD and UCEC tumors documented in TCGA. Majority of MSI-H frameshifts are deletions. A. Quantification of patients with microsatellite instable (MSI) tumors by designation applied in TCGA. MSI-H is MSI-high, MSI-L is MSI-low, MSS is MS-stable, and Unknown - undetermined MS status. B. Table showing the fraction (absolute number) of patients with UCEC, COAD and STAD tumors identified as MSI-H, MSI-L, MSS or Unknown. C. Frameshift (fs-) load (Y-axis, log10) in different tumor types across TCGA. D. Segregation of fs-load by MSI designation in COAD, STAD and UCEC patients. E. Comparison of fs-load (Y-axis, log10) with insertion-deletion ratio (X-axis, log10) in COAD, STAD and UCEC patients. F. Schematic of the shared fs-peptide hypothesis. Examples of possible deletions within the MS locus of a protein coding gene that generates similar stretches of new amino acids. 0 – normal gene, 1–3 – deletions within MS locus.
Figure 2.
Figure 2.
Frequencies of shared fs-events and fs-peptides, and fs-epitope distribution in STAD, COAD and UCEC MSI-H tumors. A. Scatterplots of patient frequencies of frameshifted genes (LEFT), fs-peptides (CENTER) and fs-epitopes (RIGHT) in UCEC, STAD and COAD MSI-H tumors. B. Three scatterplots showing the selection criteria for identification of shared fs-peptides in MSI-H UCEC, COAD and STAD. Each dot represents a fs-peptide shared in at least 20% of patients in each cohort. Number of predicted 9-mer epitopes per peptide (X-axis) is plotted against the number of predicted interacting MHC alleles (Y-axis). Size of the circle represents the number of predicted pMHC interactions. Color of the dot reflects the somatic score of the fs-mutation. C. MHC-I epitope mapping of 46 shared fs-peptides from MSI-H UCEC, COAD and STAD tumors combined together. D. Quantification of MHC-I epitopes derived from 9 shared fs-peptides of MSI-H UCEC cohort shown per each patient (rows, left panel) or each MHC-I allele (rows, right panel).
Figure 3.
Figure 3.
Genomic and expression properties of shared fs-mutations in MSI-H tumors. A. Friedman difference test, measuring the difference between pMHC interactions found in all MSI-H UCEC patients (ALL) and either pMHC interactions in each fs-peptide separately or combined together (POOL). Each bar represents the difference score per each MHC allele. B. Tumor allele frequency of nine shared frameshift mutations in normal (Top) and tumor (Bottom) tissues of MSI-H UCEC TCGA patients. C. Unsupervised hierarchical clustering of shared fs-mutation load (Left) and corresponding expression FPKM values of frameshifted genes (Right) in MSI-H UCEC (Top), COAD (Center) and STAD (Bottom) tumors. Patients plotted in columns; genes plotted in rows. D. Spearman correlation test between shared fs-mutation load and fs-gene expression. E. Normalized expression of nine shared fs-mutations in MSI-H UCEC patients. LEFT – ratio of indel to total read count spanning the microsatellite region in MSI-H and MSS patient cohorts of UCEC, STAD and COAD tumors. Statistical significance is derived from non-parametric Mann-Whitney two-tailed test. RIGHT – normalized frequency of fs-mutation in RNF43 within 100 nucleotide genomic loci: 50 nt upstream and 50 nt downstream of the shared frameshift in MSI-H and MSS RNAseq samples. F. LEFT - Clustering of MSI-H COAD patients with shared frameshift mutations from the CPTAC dataset. RIGHT – patients’ frequencies of all and shared frameshift mutations in the CPTAC dataset. G. MS/MS detection of predicted shared RNF43 frameshift in an MSI-H UCEC sample from the CPTAC UCEC dataset. MS/MS spectra of tryptic peptide (yellow fragment) derived from predicted fs-peptide (red sequence) is identified by Pepquery analysis (PMS p-value 0.00099).
Figure 4.
Figure 4.
Detection of shared fs-mutations in the cancer cell line encyclopedia (CCLE). A. Quantification of shared fs-mutations in cell lines per tissue of tumor origin and per each frameshifted gene. Histogram plot on the right shows the number of shared fs-mutations per cell line. Bar-plot is highlighted according to shared frameshift load: high (yellow) and low (grey). B. Absolute number of cell lines with detected shared fs-mutation compared to total number of cell lines in CCLE. Cell lines are sorted according to tissue origin. C. Distribution of all detected indels in genes with shared fs-mutations (34 genes in CCLE). Left – metagene, showing normalized frequency of all detected indels in 34 genes, around shared fs-mutation. Right– t-test of number of cell lines encoding shared fs-mutations versus all other fs-mutations, detected in selected 34 genes. D. Comparison of fs-allele frequency per cell line with fs-mutation frequency among cancer cell lines. E. MS/MS detection of fs-peptide epitopes eluted from MHC-I complexes of the HCT116 cell line. MS/MS spectra of an MHC class I epitope (dark orange) derived from shared SLC35G2 fs-peptide (light grey) is identified following Pepquery analysis (PMS p-value 0.001). Shared fs-mutation allele frequency is ~ 0.4 in HCT116 according to CCLE (bar plot). netMHC predictions of MHC class I allele affinities of MS/MS detected peptides using HCT116 MHC-alleles. Significant interactions with interaction thresholds of rank = 2.0 or KD < 500 nM are shown. F. ROC analysis of shared fs-mutation recall by Sanger sequencing in the selected cell lines (HCT116, LOVO, Hec59, HeclB). Indel calling by WES is highly specific and sensitive (91.2% and 85.2% respectively).
Figure 5.
Figure 5.
Detection of shared fs-neoantigens in MSI-H patients undergoing immunotherapy. A. Heatmap plots of shared fs-mutation allele frequency in normal (LEFT) and tumor (RIGHT) samples of patients undergoing PD-1 immunotherapy. MS status of each patient is highlighted in the far-right bar column. B. Distribution of shared fs-mutation frequencies in normal and tumor samples. The cutoff of 0.2 is suggested to filter somatic events. C. Distribution of population frequencies of 46 shared fs-mutations. 70% of shared fs-mutations are present in > 20% patients. D. Heatmap of shared fs-neoantigen load derived from fs-mutations with allele frequency > 0.2. MS status and objective clinical responses are shown in the right bar columns. E. Shared fs-neoantigen load in MSI-H patients classified by clinical objective response rate: CR/PR – complete and partial responses; SD/PD - stable and progressed disease. Statistical significance is determined by unpaired t-test (p-value < 0.049). Color code is the same as in D.
Figure 6.
Figure 6.
Shared fs-peptides predicted from UCEC MSI-H tumors elicit T cell responses. A. T cell immunogenicity assay used to evaluate antigen-specific T cell responses. PBMCs from healthy donors (HD) were expanded in vitro following stimulation with fs-peptide OLPs as shown in Figure S10. Expanded T cells were re-stimulated with either the peptide pool they were expanded with or the control peptide pool MOG. Representative IFN-γ ELISPOT images for B. HD13 or C. for selected responsive HD. D. Summary of ELISPOT data, 5×10⁴ cells/well (n=14). Statistical significance for MOG vs OLPs was evaluated by Wilcoxon signed-rank test. E. Representative flow cytometry plots demonstrating gating strategy. Summary of flow data (n=15) for IFN-γ in F. CD8 and G. CD4 T cell subsets. Statistical significance for DMSO vs OLPs was evaluated by Wilcoxon signed-rank test. **p=0.0032 for SLC22A9 and **0.0031 for CEFT. H. Frequency of IFN-γ or TNF-α producing CD8+ T cells upon stimulation with WT peptide pool. I. PBMCs from HD13 were stimulated and expanded with OLP pools for SLC35F5, SLC22A9 or RNF43. Expanded cells were re-stimulated either with pooled OLPs or the individual peptides constituting each peptide pool (detailed in Figure S8) or MOG. Frequencies of IFN-γ or TNF-α producing CD8+ T cells were measured by ICS in duplicates and average values are shown. J. PBMCs from MSI-H patients (Pt 1 and 3 with UCEC, Pt 2 with COAD) were stimulated and expanded with fs-peptide OLPs. After expansion, each group of cells was re-stimulated with the corresponding OLP pool or MOG. Frequencies of IFN-γ producing CD8+ T cells were measured by ICS, in duplicates. Average values are shown. Statistical significance for MOG vs OLPs was evaluated by unpaired t test for each patient. Pt 1 : SETD1B*: p=0.0118; Pt 2: SLC22A9_N***: p=0.0003, TTK*: p=0.0172, RNF43**: p=0.0031; Pt 3: SLC35F5**: p=0.0064, SLC22A9_C***: p=0.0008, OR7E24_C*: p=0.0167, RNF43*: p=0.0177. For all assays, stimulation with DMSO or MOG were used as negative controls and CEFT and/or PMA/Ionomycin were used as positive control. The spot numbers and % IFN-γ or IFN-γ/TNF-α values were calculated by subtracting the values obtained after MOG or DMSO stimulation from the values after peptide stimulation and negative values were set to zero.

Comment in

References

    1. Ahmed D et al. (2013) ‘Epigenetic and genetic features of 24 colon cancer cell lines.’, Oncogenesis, 2(9), pp. 1–9. doi: 10.1038/oncsis.2013.35. - DOI - PMC - PubMed
    1. Van Allen EM et al. (2015) ‘Genomic correlates of response to CTLA-4 blockade in metastatic melanoma’, Science, 350(6257), pp. 207–211. doi: 10.1126/science.aad0095. - DOI - PMC - PubMed
    1. Andreatta M and Nielsen M (2016) ‘Gapped sequence alignment using artificial neural networks: application to the MHC class I system’, Bioinformatics, 32(4), pp. 511–517. Available at: 10.1093/bioinformatics/btv639. - DOI - PMC - PubMed
    1. Apcher S et al. (2011) ‘Major source of antigenic peptides for the MHC class I pathway is produced during the pioneer round of mRNA translation.’, Proceedings of the National Academy of Sciences of the United States of America, 108(28), pp. 11572–7. doi: 10.1073/pnas.1104104108. - DOI - PMC - PubMed
    1. Balachandran VP et al. (2017) ‘Identification of unique neoantigen qualities in long-term survivors of pancreatic cancer’, Nature. Nature Publishing Group, 551(7681), pp. S12–S16. doi: 10.1038/nature24462. - DOI - PMC - PubMed

Publication types

MeSH terms