Comparative Study
. 2021 Jan:128:104123.
doi: 10.1016/j.compbiomed.2020.104123. Epub 2020 Nov 24.

Comparative transcriptome analysis of SARS-CoV, MERS-CoV, and SARS-CoV-2 to identify potential pathways for drug repurposing

Affiliations
Comparative Study

Comparative transcriptome analysis of SARS-CoV, MERS-CoV, and SARS-CoV-2 to identify potential pathways for drug repurposing

Pandikannan Krishnamoorthy et al. Comput Biol Med. 2021 Jan.

Abstract

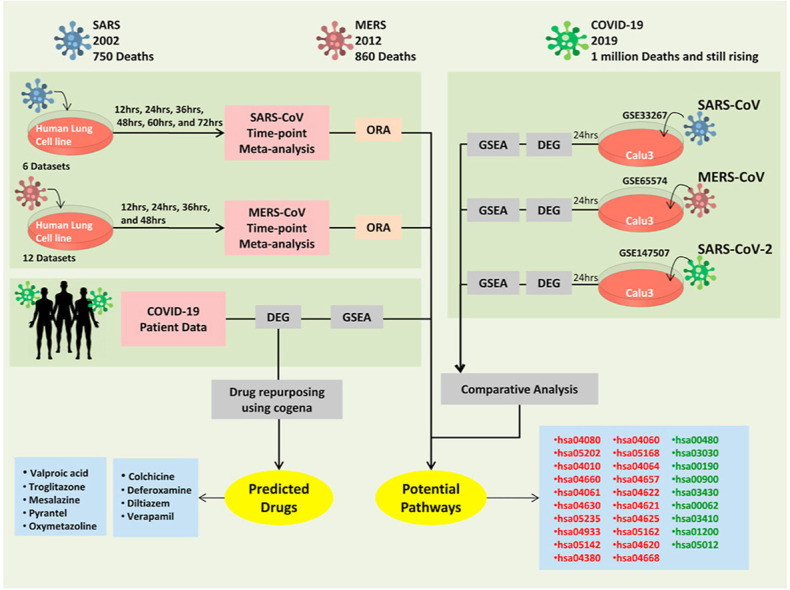
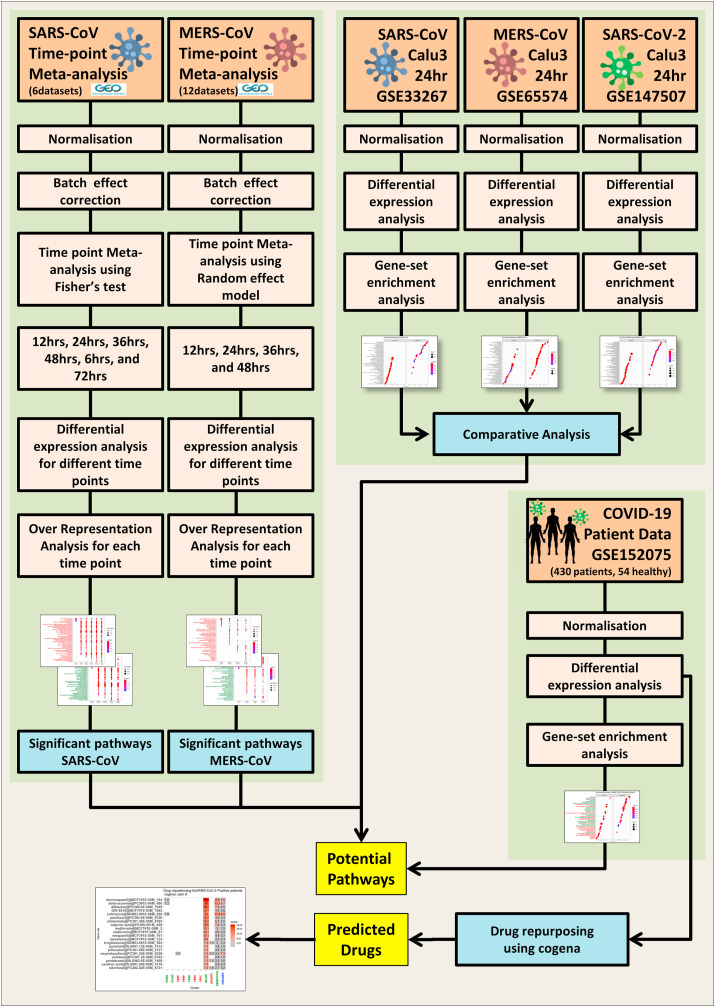
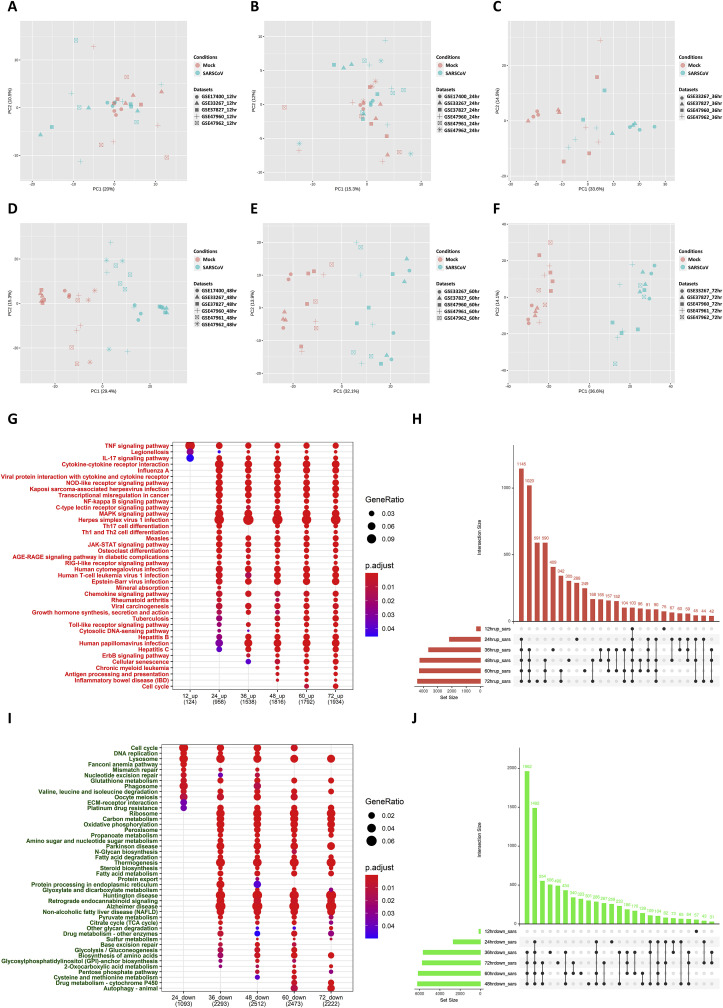
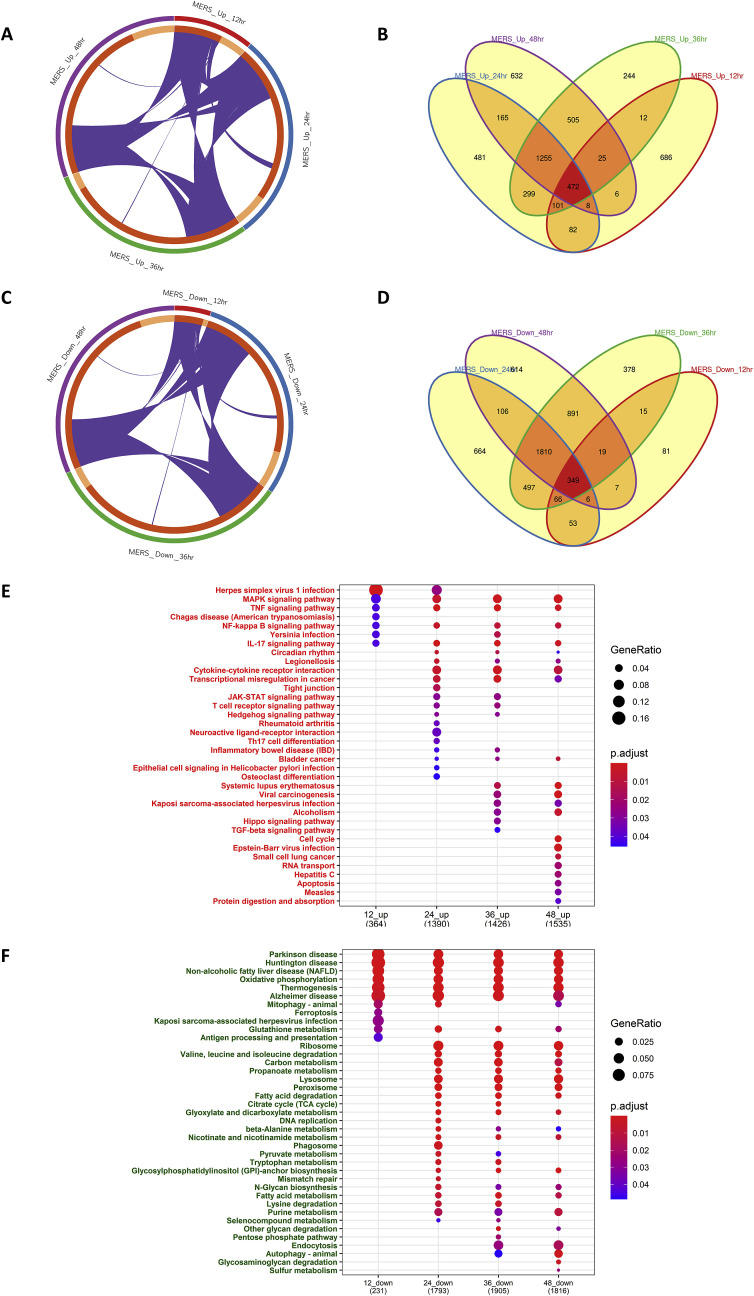
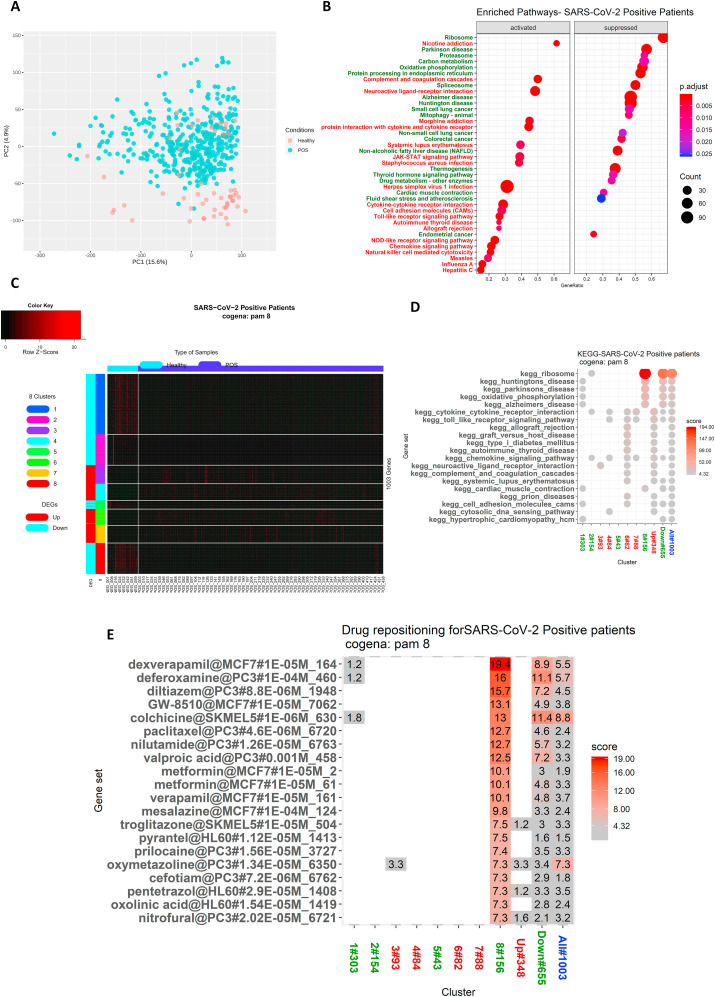
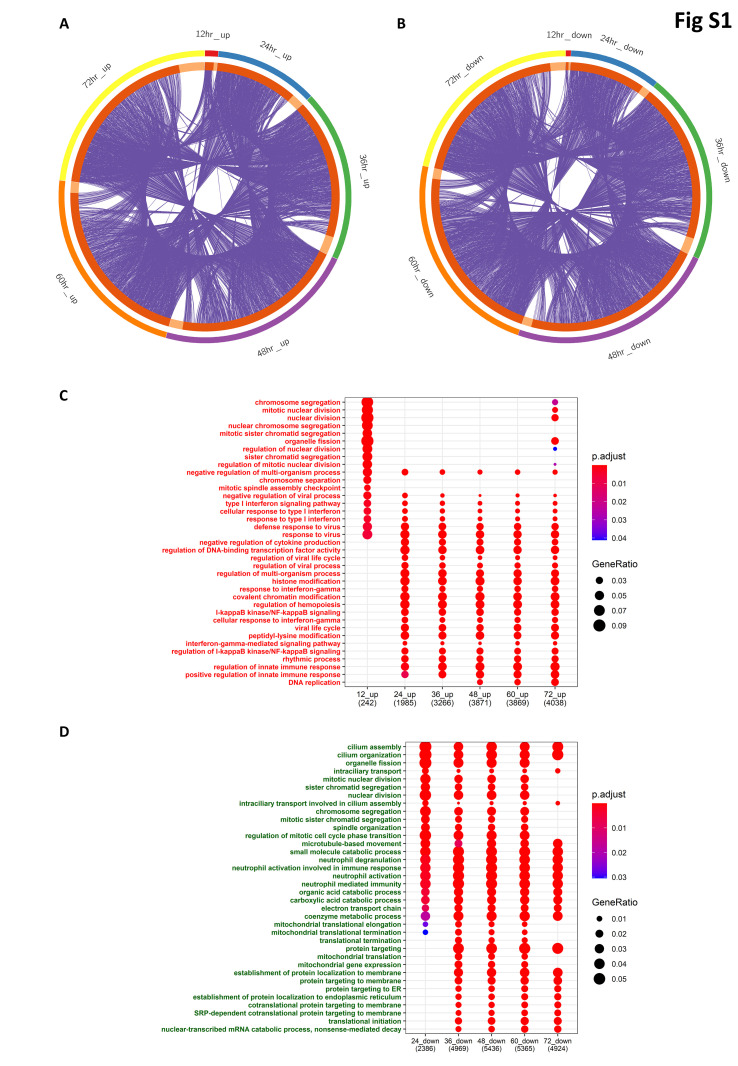
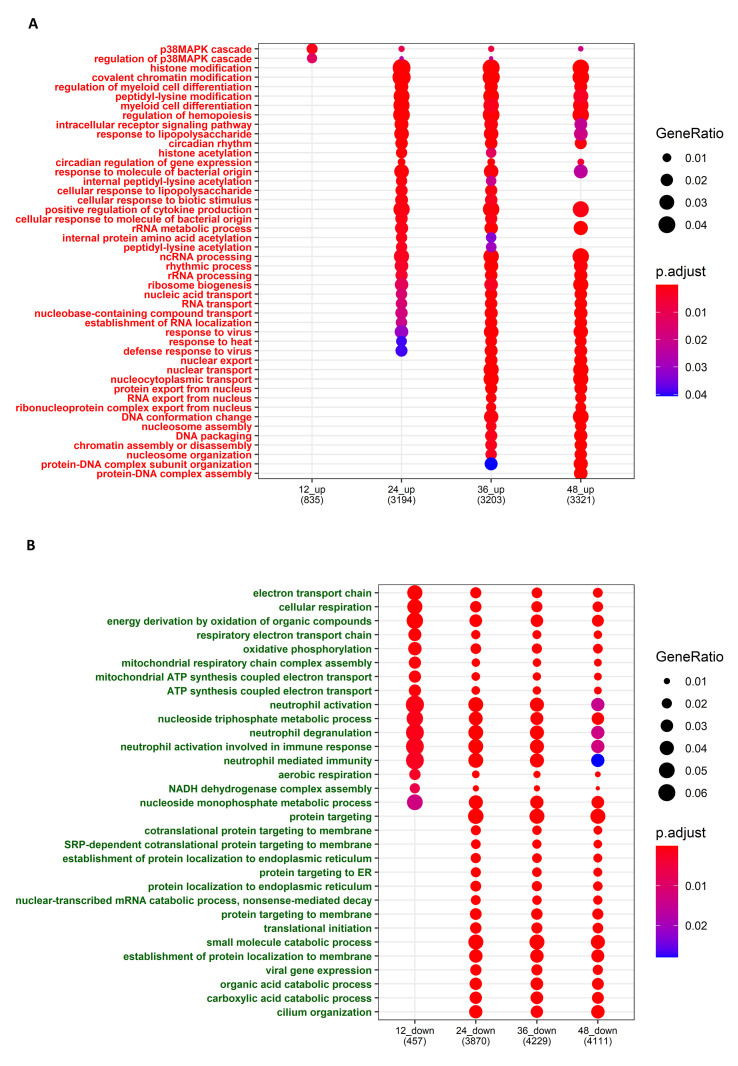
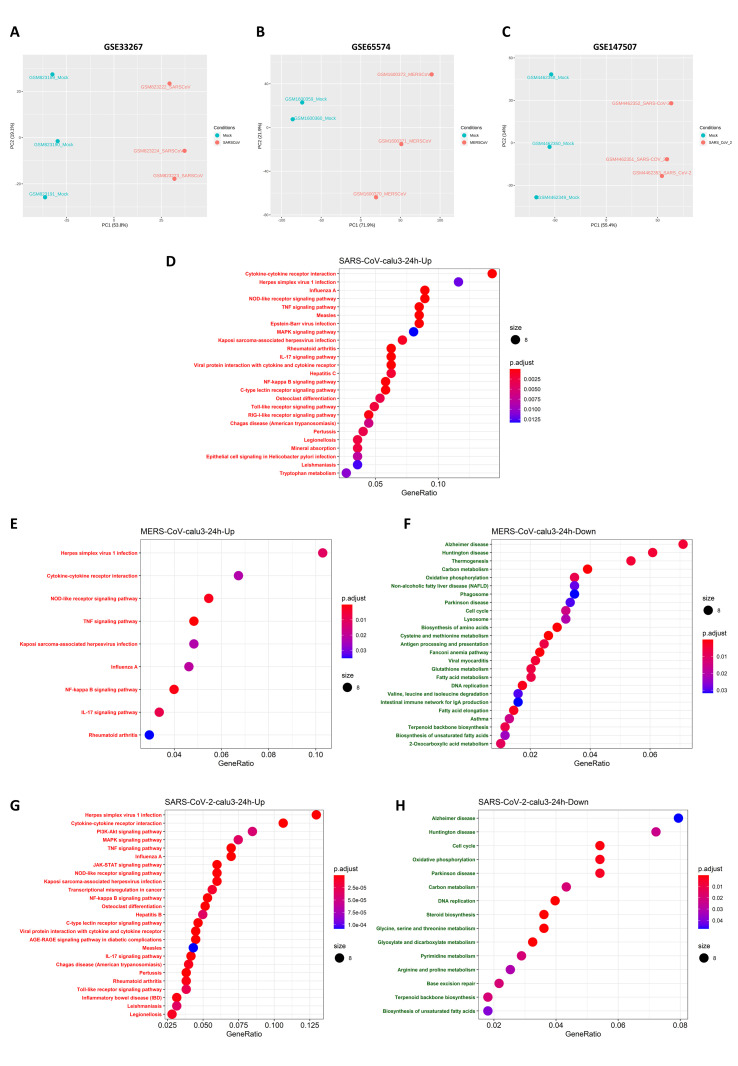
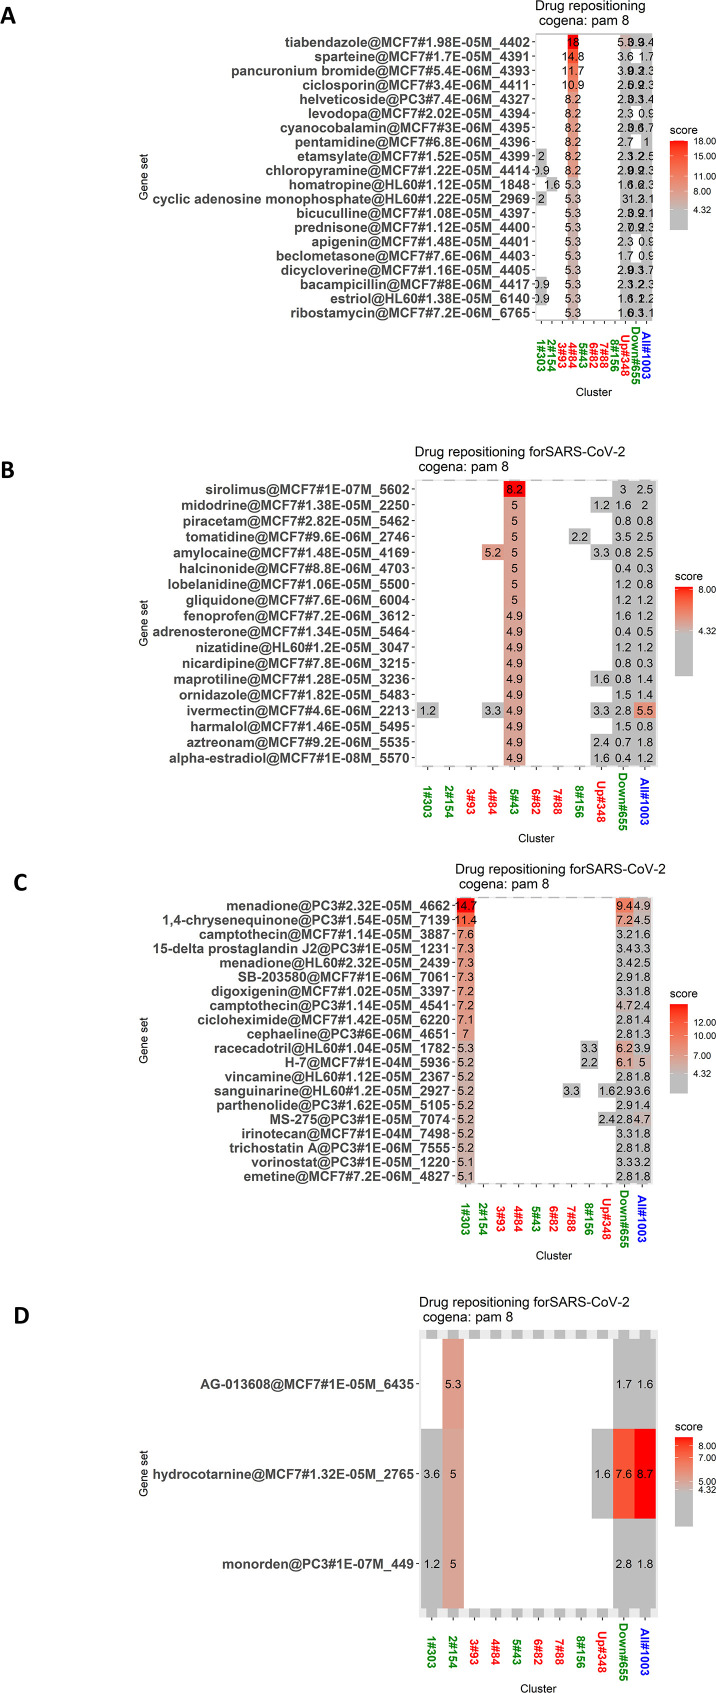
The ongoing COVID-19 pandemic caused by the coronavirus, SARS-CoV-2, has already caused in excess of 1.25 million deaths worldwide, and the number is increasing. Knowledge of the host transcriptional response against this virus and how the pathways are activated or suppressed compared to other human coronaviruses (SARS-CoV, MERS-CoV) that caused outbreaks previously can help in the identification of potential drugs for the treatment of COVID-19. Hence, we used time point meta-analysis to investigate available SARS-CoV and MERS-CoV in-vitro transcriptome datasets in order to identify the significant genes and pathways that are dysregulated at each time point. The subsequent over-representation analysis (ORA) revealed that several pathways are significantly dysregulated at each time point after both SARS-CoV and MERS-CoV infection. We also performed gene set enrichment analyses of SARS-CoV and MERS-CoV with that of SARS-CoV-2 at the same time point and cell line, the results of which revealed that common pathways are activated and suppressed in all three coronaviruses. Furthermore, an analysis of an in-vivo transcriptomic dataset of COVID-19 patients showed that similar pathways are enriched to those identified in the earlier analyses. Based on these findings, a drug repurposing analysis was performed to identify potential drug candidates for combating COVID-19.

Keywords: Coronavirus; Drug candidates; Drug repurposing; Meta-analysis; SARS-CoV-2; Transcriptome.


Conflict of interest statement

The authors declare that they have no known competing financial interests or personal relationships that could have appeared to influence the work reported in this paper.

Figures

Image 1
Graphical abstract
Fig. 1
Fig. 1
Schematic workflow for the comparison of different disease-causing coronaviruses transcriptional responses and drug repurposing analysis to identify novel drugs. Meta-analysis of SARS-CoV and MERS-CoV transcriptome data of each time point separately and significant genes were identified, and pathway enrichment analysis was performed, and the important pathways were identified. SARS-CoV, MERS-CoV, SARS-CoV-2 transcriptome data from three different studies performed in Calu-3 cell line at 24 h were analyzed to find significant genes, and GSEA analysis was performed to identify the common activated and suppressed pathways. In-vivo data of COVID-19 patient transcriptome was analyzed to check similar pathways that were enriched as observed in-vitro. The significant genes and their expression were subjected to drug repurposing analysis using a cogena workflow to identify potential drugs. SARS-CoV-Severe Acute Respiratory Syndrome coronavirus; MERS-CoV- Middle East Respiratory Syndrome coronavirus; SARS-CoV-2 – Severe Acute Respiratory Syndrome coronavirus; GSEA- Gene set enrichment analysis; COVID-19-Coronavirus disease-2019.
Fig. 2
Fig. 2
Time point wise meta-analysis of SARS-CoV transcriptome datasets to identify differential pathways. The common datasets for each time point were selected among screened datasets for meta-analysis. After normalization and bath adjustment using ComBat, the separation of samples at each time point 12 h,24 h,36 h,48 h,60 h,72 h (2A-F) is achieved by PCA. Differentially expressed genes in each dataset were calculated using the limma R package with a cutoff of logFC greater than 1, and the adjusted p-value less than 0.05. All the datasets at each time point were integrated using Fisher's method. The total number of significantly upregulated and downregulated genes common and unique between different time points were visualized through upset plots (2H,2J). The Over-representation analysis (ORA) for the KEGG pathway for upregulated (2G) and downregulated genes (2I) at each time points were visualized through dot plots. SARS-CoV-Severe Acute Respiratory Syndrome coronavirus; PCA – Principal component analysis; KEGG-Kyoto Encyclopedia of Genes and Genomes.
Fig. 3
Fig. 3
Time point wise meta-analysis of MERS-CoV transcriptome datasets to identify differential pathways. The common datasets for each time point were selected among the screened datasets for meta-analysis. After normalization and differential expression analysis of each datasets using limma with significance threshold logFC greater than 1 and adjusted p-value less than 0.05, the batch adjustment was performed. A random effect model was chosen to integrate the data after performing Cochran's Q-test with a significance threshold of less than 0.05. Such meta-analysis was performed at 12 h, 24 h, 36 h, 48 h time points. Significant upregulated and downregulated genes between different time points obtained through meta-analysis were visualized through circos plot (3A and 3C) and venn diagram (3B and 3D), respectively. The Overrepresentation analysis for the KEGG pathway for upregulated (3E) and downregulated (3F) genes for enriched pathways at each time points was visualized through dot plots. MERS-CoV- Middle East Respiratory Syndrome coronavirus; KEGG-Kyoto Encyclopedia of Genes and Genomes.
Fig. 4
Fig. 4
Comparison of Gene set enrichment analysis of SARS-CoV-2, SARS-CoV, and MERS-CoV transcriptomic response to Calu-3 cell line at 24 h identifies common activated and suppressed pathways: Differential expression analysis of GSE147507 (SARS-CoV-2) was performed, and they were visualized through the PCA plot (4A). The transcriptome datasets of the Calu-3 cell line infected by SARS-CoV, MERS-CoV, and SARS-CoV-2 at 24 h time point were analyzed for comparison. GSE33267 for SARS-CoV, which is a microarray-based transcriptome dataset, GSE65574 for MERS-CoV, which is a microarray dataset, and GSE147507 for SARS-CoV-2, an RNA-seq transcriptomic data (Calu-3) was analyzed at 24 h. The Schematic of comparative Gene set enrichment analysis of three different virus-infected profiles in the same Calu-3 cell line is shown in (4B). Gene set enrichment analysis KEGG pathway of MERS-CoV (4C), SARS-CoV (4D), and SARS-CoV-2 (4E) were visualized through dot plots for significantly activated and suppressed pathways in each of virus infections. SARS-CoV-Severe Acute Respiratory Syndrome coronavirus; MERS-CoV- Middle East Respiratory Syndrome coronavirus; SARS-CoV-2 – Severe Acute Respiratory Syndrome coronavirus; KEGG-Kyoto Encyclopedia of Genes and Genomes.
Fig. 5
Fig. 5
GSEA and Coexpression Gene enrichment (Cogena) analysis of SARS-CoV-2 positive patients' transcriptome identify potential pathways and drug candidates. GSE152075, high throughput transcriptome sequencing data obtained from SARS-CoV-2 positive (POS) patients’ nasal swabs were re-analyzed. The Segregation of Healthy and SARS-CoV-2 positive (POS) group was visualized through the PCA plot (5A). The Differential expression analysis was performed using EdgeR with significance threshold logFC>1.5 and adjusted p-value less than 0.05. GSEA analysis identified the activated and suppressed pathways in SARS-CoV-2 positive patients and visualized through the dot plot (5B). The Normalized expression of significant genes was subjected to cogena analysis, and different clusters were visualized through heatmap (5C). KEGG gene enrichment analysis for each cluster was visualized through the dot plot (5D). Drug repurposing analysis of the selected cluster identified potential drug candidates, which were visualized along with their enrichment score (5E). PCA-Principal component analysis; SARS-CoV-2 – Severe Acute Respiratory Syndrome coronavirus; KEGG-Kyoto Encyclopedia of Genes and Genomes.
Figure S1
Figure S1
Gene ontology analysis of significant genes obtained through SARS-COV meta-analysis at each time points. Circos plot denoting a relation between different genes upregulated (A) and downregulated(B) significantly at each time points after meta-analysis. Gene Ontology analysis of the Biological process for each time point for upregulated (C) and downregulated (D) significant genes after meta-analysis were visualized through dot plots
Figure S2
Figure S2
Gene ontology analysis of significant genes obtained through MERS-COV meta-analysis at each time points. The Gene Ontology analysis for biological processes at each time points for the genes upregulated (A) and (B) downregulated obtained through meta-analysis were visualized through dot plots
Figure S3
Figure S3
ORA analysis of Calu-3 datasets of SARS-CoV, MERS-CoV, and SARS-CoV-2 at 24 hours post infection Differential expression analysis of GSE33267 (SARS-CoV), GSE65574 (MERS-COV), GSE147507 (SARS-CoV-2) was performed individually, and they were visualized through PCA plots (A), (B), (C), respectively. The significant genes with logFC greater than 1 and adjusted p-value less than 0.05 were subject to overrepresentation analysis for KEGG pathways enrichment. SARS-CoV upregulated genes enriched pathways were visualized through the dot plot (C). Significantly downregulated genes did not enrich any pathways. MERS-CoV upregulated, and down-regulated genes pathways enrichment was visualized through the dot plots (D) and (E), respectively. SARS-CoV-2 upregulated and downregulated genes pathway enrichment was visualized through dot plots (F) and (G), respectively.
Figure S4
Figure S4
Drug repurposing analysis for all clusters of co-expressed genes The Potential drug candidates targeting the clusters 4 (A),5(B),1(C),2(E)were visualized along with their enrichment scores.

Similar articles

Cited by

References

    1. Carrasco-Hernandez R., Jacome R., Lopez Vidal Y., Ponce de Leon S. Are RNA viruses candidate agents for the next global pandemic? A review. ILAR J. 2017;58(3):343–358. - PMC - PubMed
    1. Duffy S. Why are RNA virus mutation rates so damn high? PLoS Biol. 2018;16(8) - PMC - PubMed
    1. Kin N., Miszczak F., Lin W., Gouilh M.A., Vabret A., Consortium E. Genomic analysis of 15 human coronaviruses OC43 (HCoV-OC43s) circulating in France from 2001 to 2013 reveals a high intra-specific diversity with new recombinant genotypes. Viruses. 2015;7(5):2358–2377. - PMC - PubMed
    1. Yin Y., Wunderink R.G. MERS, SARS and other coronaviruses as causes of pneumonia. Respirology. 2018;23(2):130–137. - PMC - PubMed
    1. Drosten C., Gunther S., Preiser W. Identification of a novel coronavirus in patients with severe acute respiratory syndrome. N. Engl. J. Med. 2003;348(20):1967–1976. - PubMed

Publication types

MeSH terms

Substances