

Dietary Habits and Risk of Early-Onset Dementia in an Italian Case-Control Study
- PMID: 33260315
- PMCID: PMC7760835
- DOI: 10.3390/nu12123682
Dietary Habits and Risk of Early-Onset Dementia in an Italian Case-Control Study
Abstract
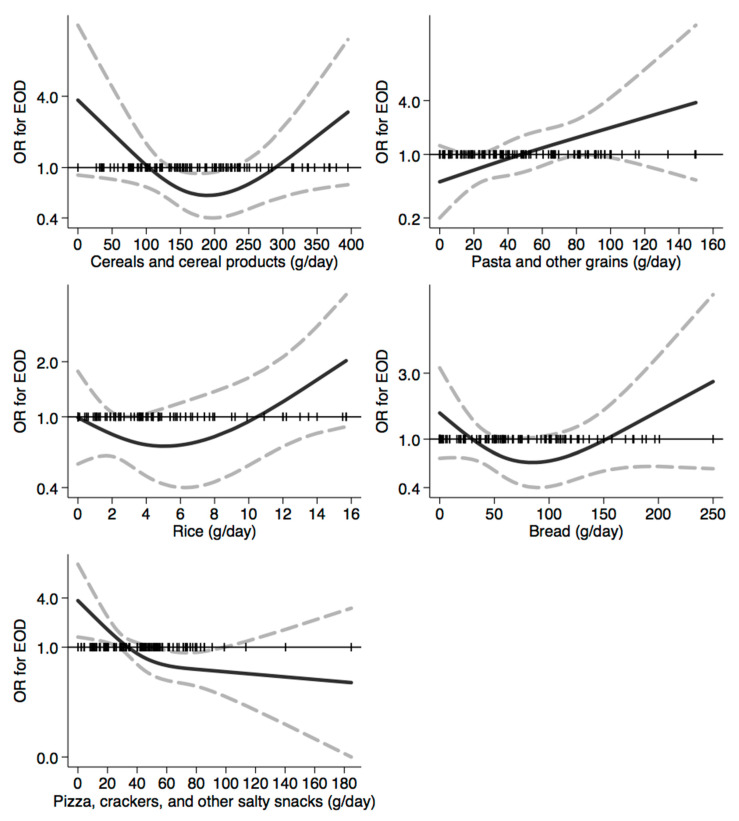
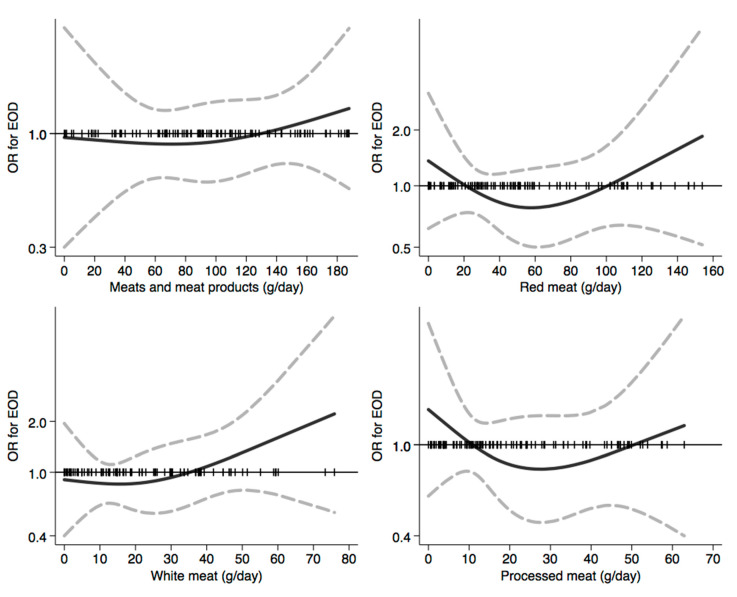
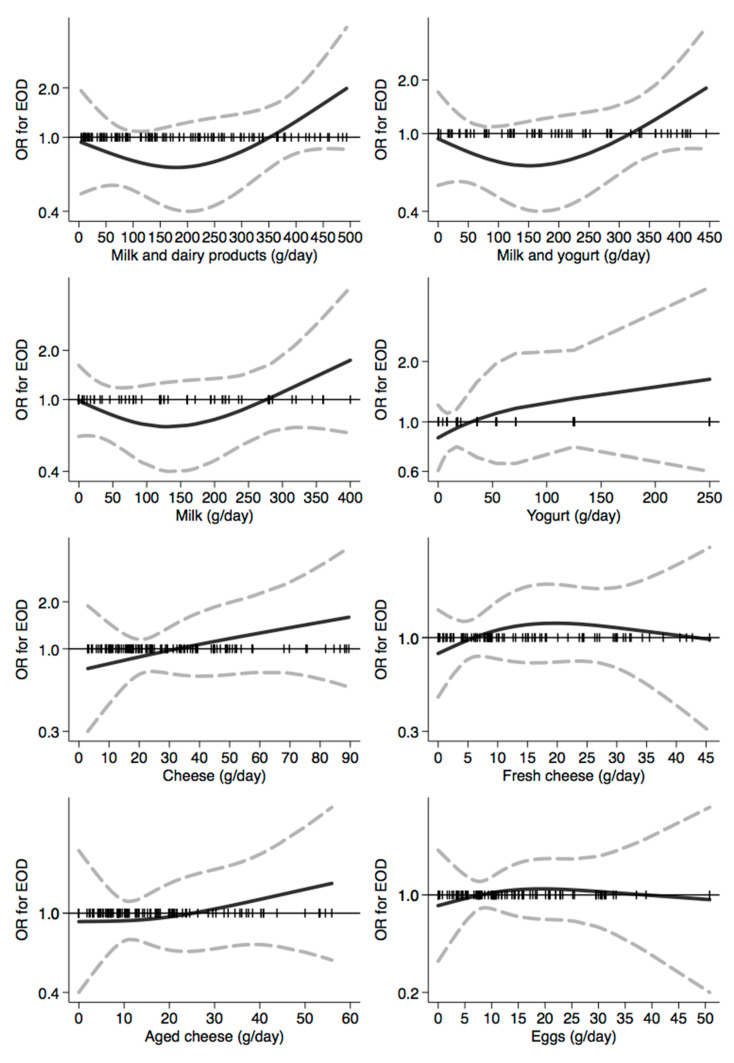
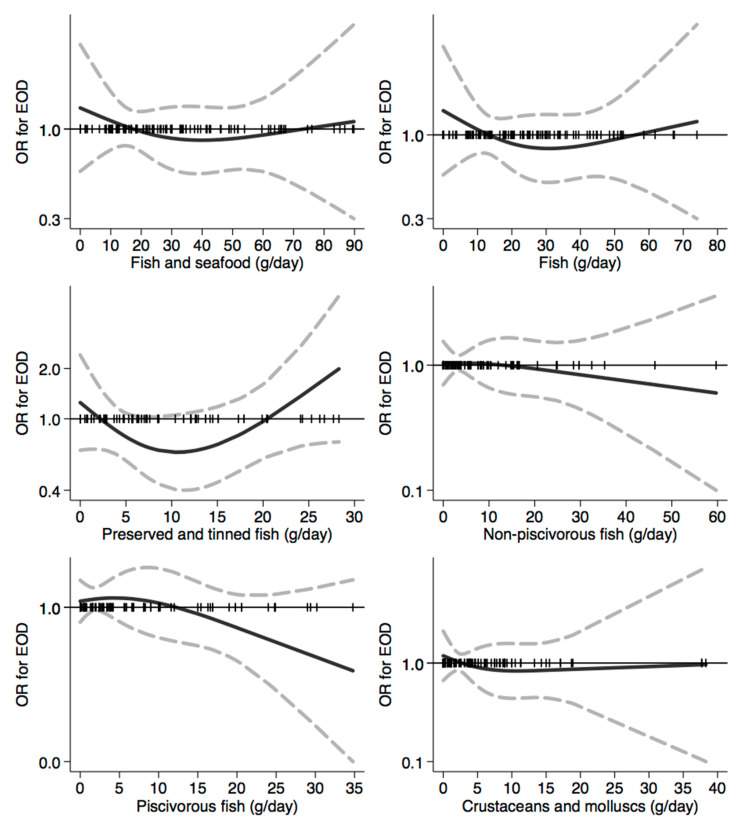
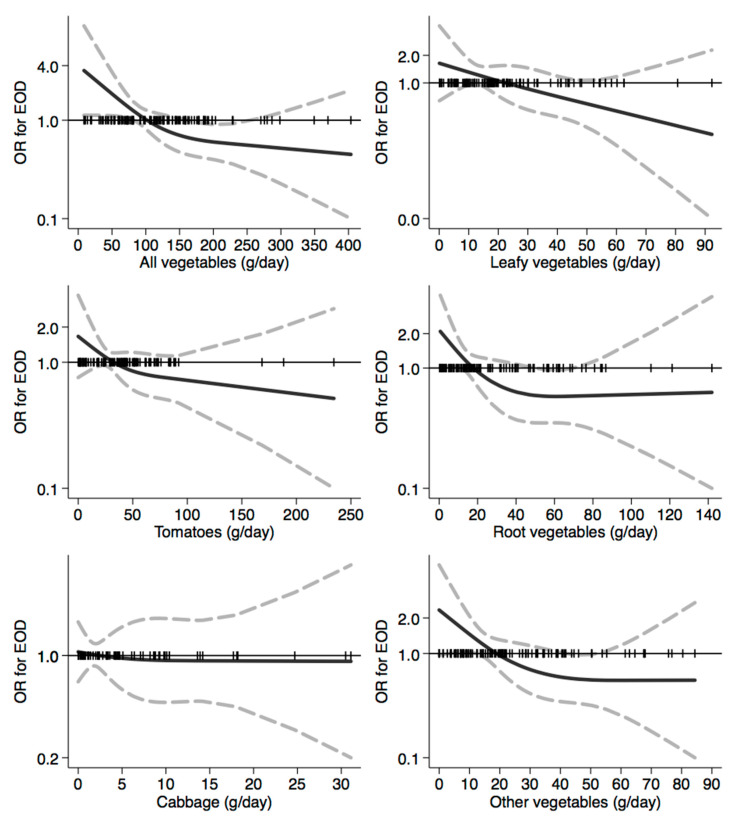
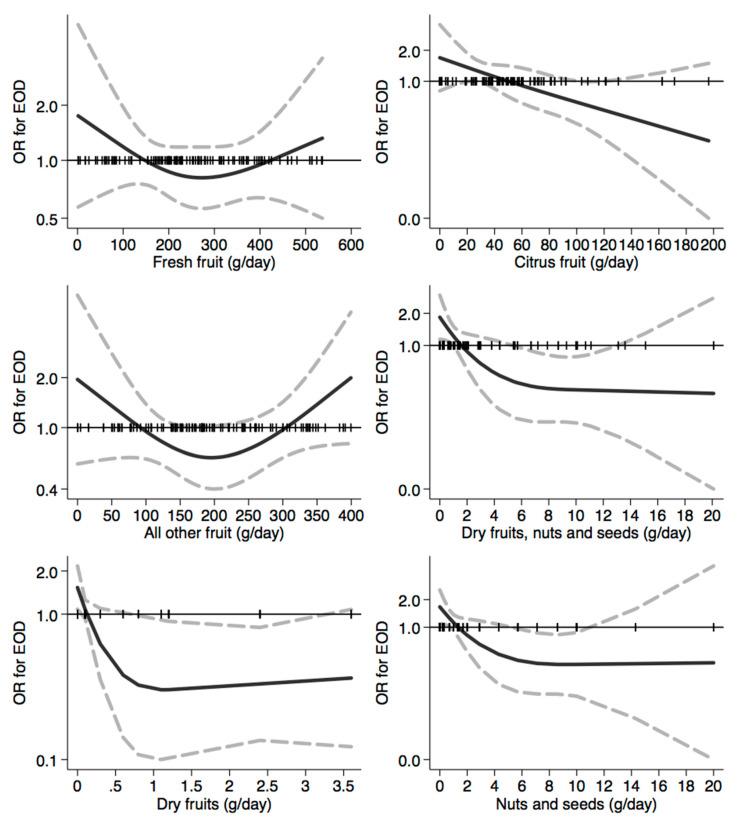
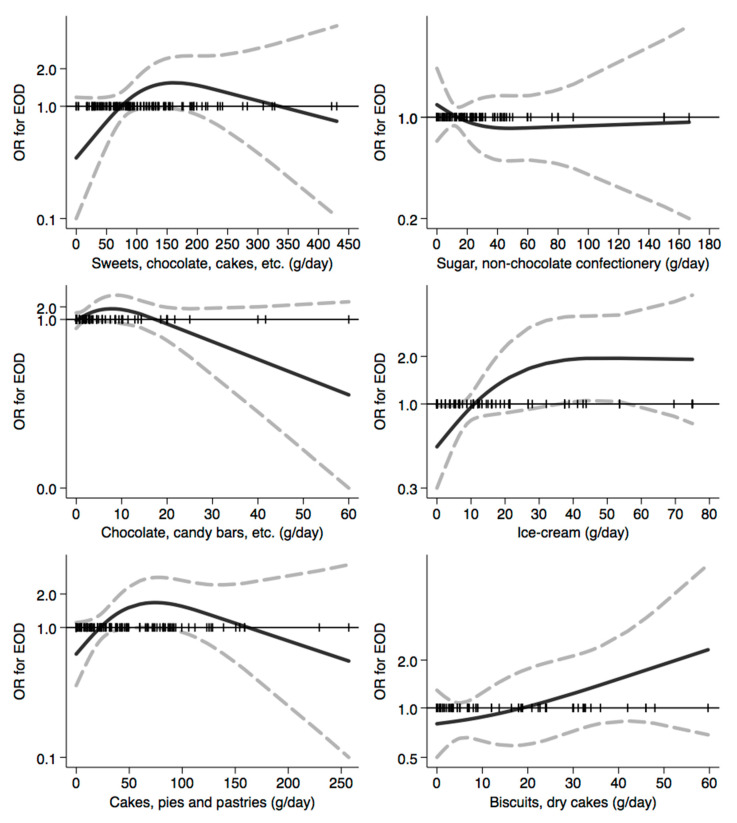
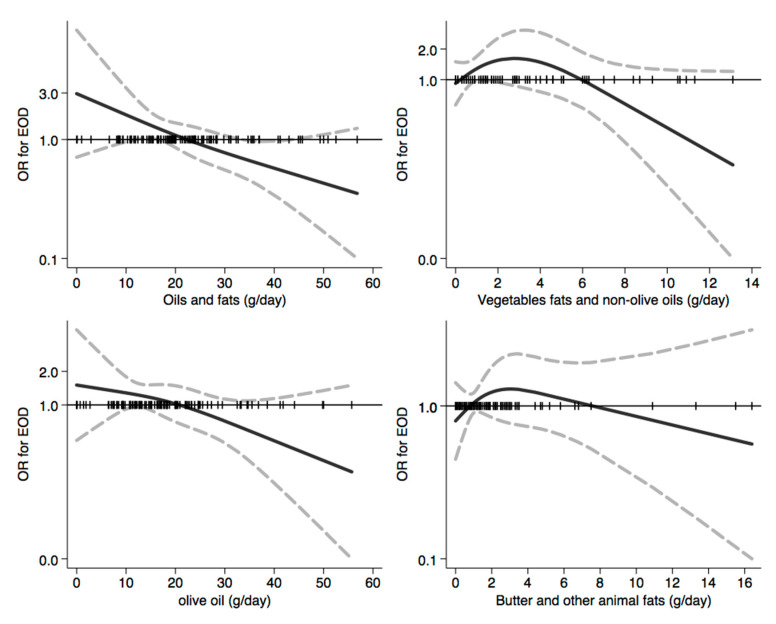
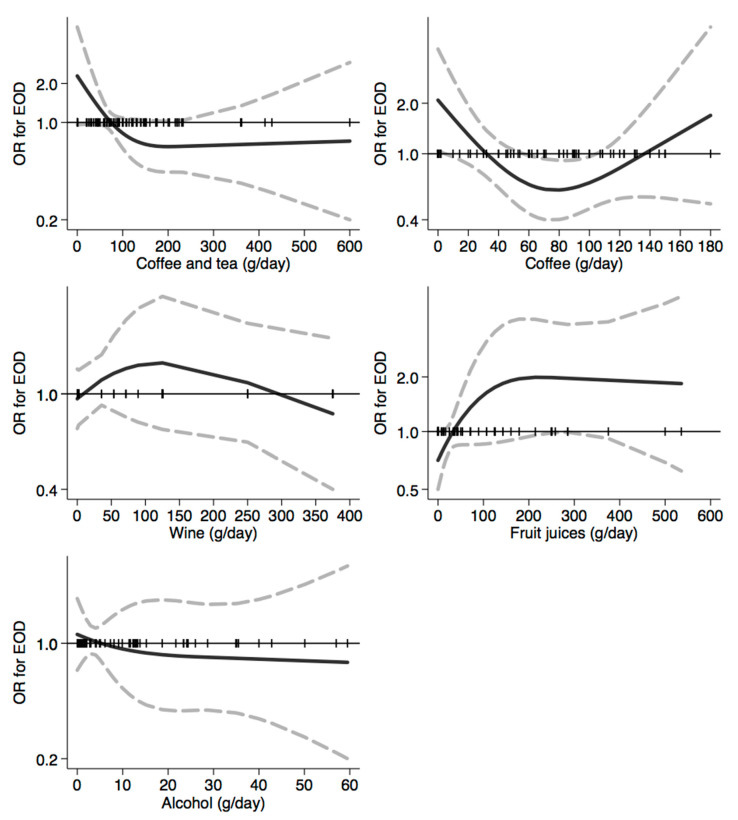
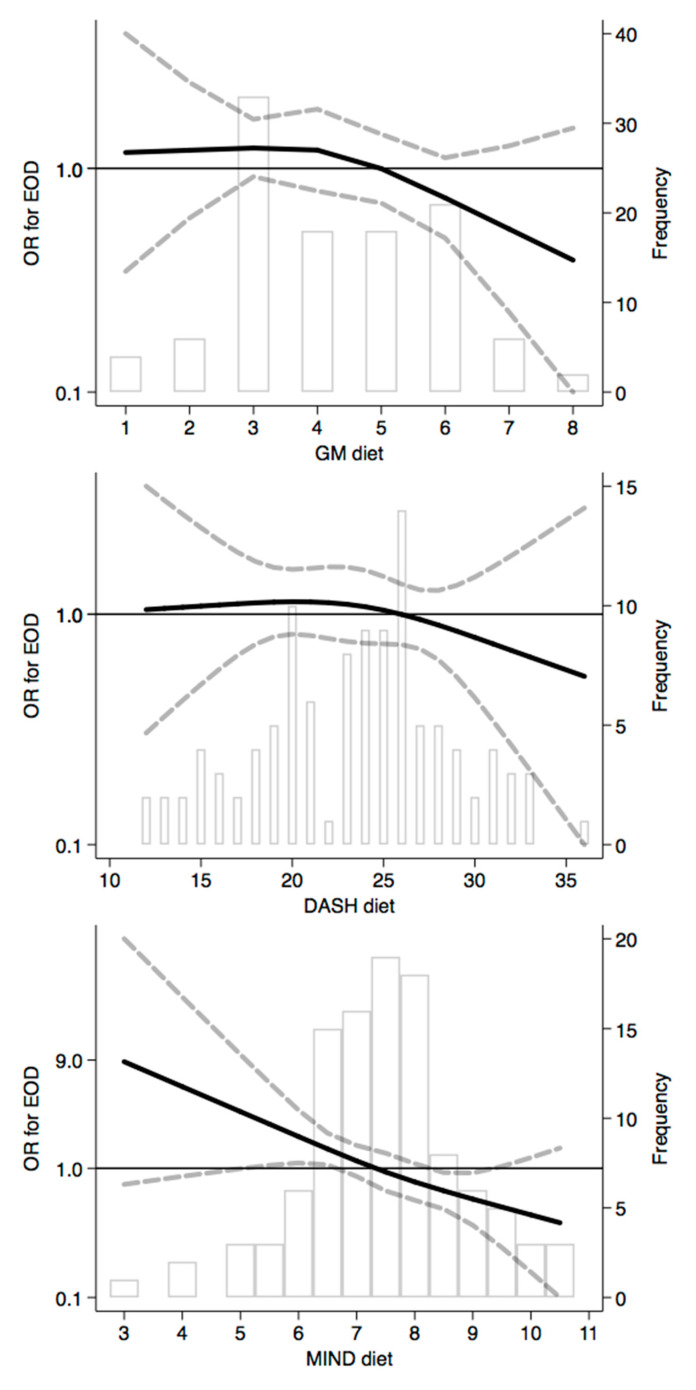
Risk of early-onset dementia (EOD) might be modified by environmental factors and lifestyles, including diet. The aim of this study is to evaluate the association between dietary habits and EOD risk. We recruited 54 newly-diagnosed EOD patients in Modena (Northern Italy) and 54 caregivers as controls. We investigated dietary habits through a food frequency questionnaire, assessing both food intake and adherence to dietary patterns, namely the Greek-Mediterranean, the Dietary Approaches to Stop Hypertension (DASH), and the Mediterranean-DASH Intervention for Neurodegenerative Delay (MIND) diets. We modeled the relation between dietary factors and risk using the restricted cubic spline regression analysis. Cereal intake showed a U-shaped relation with EOD, with risk increasing above 350 g/day. A high intake (>400 g/day) of dairy products was also associated with excess risk. Although overall fish and seafood consumption showed no association with EOD risk, we found a U-shaped relation with preserved/tinned fish, and an inverse relation with other fish. Similarly, vegetables (especially leafy) showed a strong inverse association above 100 g/day, as did citrus and dry fruits. Overall, sweet consumption was not associated with EOD risk, while dry cake and ice-cream showed a positive relation and chocolate products an inverse one. For beverages, we found no relation with EOD risk apart from a U-shaped relation for coffee consumption. Concerning dietary patterns, EOD risk linearly decreased with the increasing adherence to the MIND pattern. On the other hand, an inverse association for the Greek-Mediterranean and DASH diets emerged only at very high adherence levels. To the best of our knowledge, this is the first study that explores the association between dietary factors and EOD risk, and suggests that adherence to the MIND dietary pattern may decrease such risk.
Keywords: DASH diet; MIND diet; Mediterranean diet; dietary habits; early-onset dementia; prevention; risk.
Conflict of interest statement
The authors declare no conflict of interest.
Figures

Similar articles
-
The Mediterranean, Dietary Approaches to Stop Hypertension (DASH), and Mediterranean-DASH Intervention for Neurodegenerative Delay (MIND) Diets Are Associated with Less Cognitive Decline and a Lower Risk of Alzheimer's Disease-A Review.Adv Nutr. 2019 Nov 1;10(6):1040-1065. doi: 10.1093/advances/nmz054. Adv Nutr. 2019. PMID: 31209456 Free PMC article.
-
Influence of dietary patterns on urinary excretion of cadmium in an Italian population: A cross-sectional study.J Trace Elem Med Biol. 2023 Dec;80:127298. doi: 10.1016/j.jtemb.2023.127298. Epub 2023 Sep 7. J Trace Elem Med Biol. 2023. PMID: 37713806
-
Environmental Risk Factors for Early-Onset Alzheimer's Dementia and Frontotemporal Dementia: A Case-Control Study in Northern Italy.Int J Environ Res Public Health. 2020 Oct 29;17(21):7941. doi: 10.3390/ijerph17217941. Int J Environ Res Public Health. 2020. PMID: 33138082 Free PMC article.
-
Neuroprotective Dietary Patterns and Longitudinal Changes in Cognitive Function in Older Adults.J Acad Nutr Diet. 2025 Jun;125(6):785-795.e9. doi: 10.1016/j.jand.2024.09.012. Epub 2024 Sep 26. J Acad Nutr Diet. 2025. PMID: 39341341
-
Nutrition and risk of dementia: overview and methodological issues.Ann N Y Acad Sci. 2016 Mar;1367(1):31-7. doi: 10.1111/nyas.13047. Ann N Y Acad Sci. 2016. PMID: 27116239 Free PMC article. Review.
Cited by
-
Mediterranean Diet, Ketogenic Diet or MIND Diet for Aging Populations with Cognitive Decline: A Systematic Review.Life (Basel). 2023 Jan 6;13(1):173. doi: 10.3390/life13010173. Life (Basel). 2023. PMID: 36676122 Free PMC article. Review.
-
Associations between Urinary and Dietary Selenium and Blood Metabolic Parameters in a Healthy Northern Italy Population.Antioxidants (Basel). 2021 Jul 26;10(8):1193. doi: 10.3390/antiox10081193. Antioxidants (Basel). 2021. PMID: 34439441 Free PMC article.
-
High intake of ultra-processed food is associated with dementia in adults: a systematic review and meta-analysis of observational studies.J Neurol. 2024 Jan;271(1):198-210. doi: 10.1007/s00415-023-12033-1. Epub 2023 Oct 13. J Neurol. 2024. PMID: 37831127 Free PMC article.
-
Environmental and lifestyle risk factors for early-onset dementia: a systematic review.Acta Biomed. 2022 Dec 16;93(6):e2022336. doi: 10.23750/abm.v93i6.13279. Acta Biomed. 2022. PMID: 36533768 Free PMC article.
-
Atrial Fibrillation and Other Cardiovascular Factors and the Risk of Dementia: An Italian Case-Control Study.Int J Environ Res Public Health. 2024 May 27;21(6):688. doi: 10.3390/ijerph21060688. Int J Environ Res Public Health. 2024. PMID: 38928935 Free PMC article.
References
-
- WHO Dementia. [(accessed on 15 November 2020)];2019 Available online: https://www.who.int/news-room/fact-sheets/detail/dementia.
-
- Wolters F.J., Ikram M.A. Epidemiology of dementia: The burden on society, the challenges for research. Methods Mol. Biol. 2018;1750:3–14. - PubMed
MeSH terms
Grants and funding
LinkOut - more resources
Full Text Sources
Medical
