Review
. 2020 Nov 29;20(23):6819.
doi: 10.3390/s20236819.

A Review of Low-Cost Particulate Matter Sensors from the Developers' Perspectives

Affiliations
Review

A Review of Low-Cost Particulate Matter Sensors from the Developers' Perspectives

Brigida Alfano et al. Sensors (Basel). .

Erratum in

Abstract

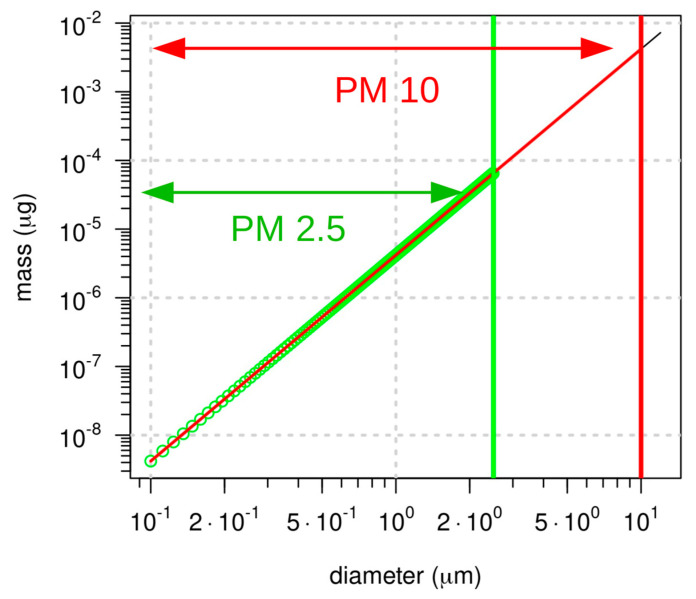
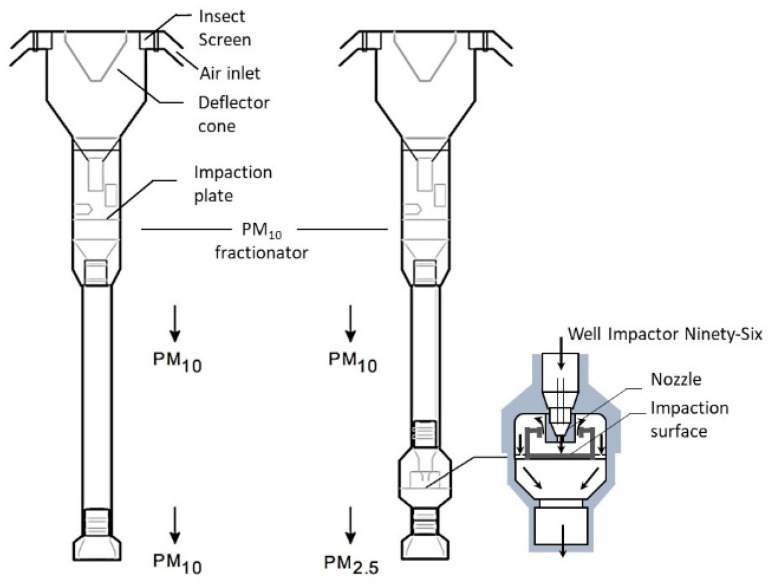
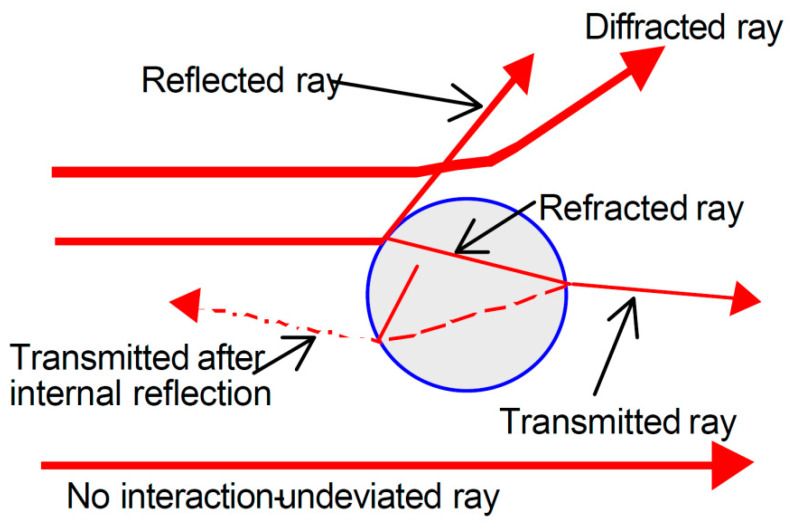
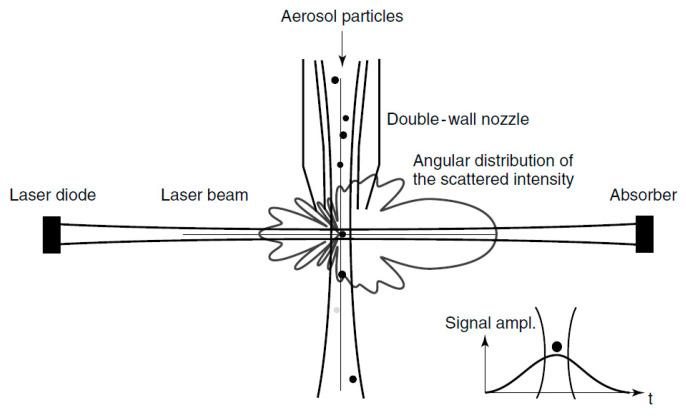
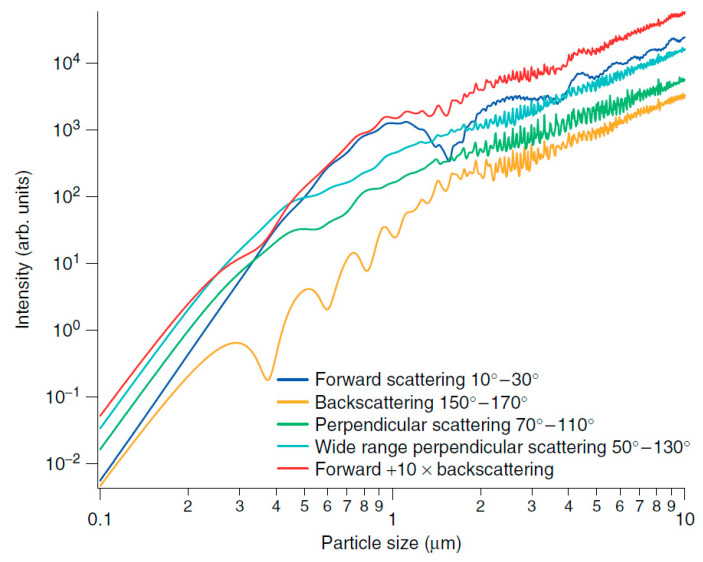
The concerns related to particulate matter's health effects alongside the increasing demands from citizens for more participatory, timely, and diffused air quality monitoring actions have resulted in increasing scientific and industrial interest in low-cost particulate matter sensors (LCPMS). In the present paper, we discuss 50 LCPMS models, a number that is particularly meaningful when compared to the much smaller number of models described in other recent reviews on the same topic. After illustrating the basic definitions related to particulate matter (PM) and its measurements according to international regulations, the device's operating principle is presented, focusing on a discussion of the several characterization methodologies proposed by various research groups, both in the lab and in the field, along with their possible limitations. We present an extensive review of the LCPMS currently available on the market, their electronic characteristics, and their applications in published literature and from specific tests. Most of the reviewed LCPMS can accurately monitor PM changes in the environment and exhibit good performances with accuracy that, in some conditions, can reach R2 values up to 0.99. However, such results strongly depend on whether the device is calibrated or not (using a reference method) in the operative environment; if not, R2 values lower than 0.5 are observed.

Keywords: IoT AQ nodes; air quality; air quality monitoring; calibration; characterization; low cost particulate matter sensors; particulate matter; performances.


Conflict of interest statement

The authors declare no conflict of interests.

Figures

Figure 1
Figure 1
Mass particle vs. diameter for the two classes of particulate (PM2.5 (green) and PM10 (red)) in a logarithmic scale.
Figure 2
Figure 2
Schematic of a standard low-vol PM10 inlets aspirating at 16.7 lpm (actual conditions). On the right the schematic of a sampling head equipped with PM2.5 aerosol fractionation using a well impactor ninety-six (WINS).
Figure 3
Figure 3
The potential interaction between a light beam and an isolated spherical particle. When the ray and the particle are far enough away, there is no interaction; interaction with the edge of the particle leads to diffraction. When the ray intersects the particle, other phenomena occur, such as refraction, reflection (both internal and external), and transmission. The interaction is considered conservative because there is no absorption (image reprinted with permission of the authors in [52], provided by Micromeritics Instrument Corp.).
Figure 4
Figure 4
Generic scheme of an OPC: the particle crossing the illumination zone (viewing volume) generates a diffraction pattern at a 360° angle. The corresponding impulse recorded by the photodiode is shown in the inset; the intensity of the signal depends on the particle size, while its width is correlated to the viewing volume (image reprinted with permission of the authors in [59] provided by Wiley—VHC Publisher).
Figure 5
Figure 5
Calculated calibration curves for different scattering angles and integration ranges for polystyrene latex: in the case of forward and back-scattering, the relationship between size and scattering intensity in some size intervals, namely the 0.4–1 μm range for back-scattering and the 1–3 μm range for forward scattering, is not uniform. In the case of perpendicular scattering, shorter oscillations are observed in the range of 2–5 μm; this latter geometry is preferable both for its dimensional distribution and because it has less dependence on the refractive index of the particles (image reprinted with permission of [59] provided by Wiley—VHC Publisher).
Figure 6
Figure 6
A schematic of the PM characterization system: PM generator, purified air system, and test chamber with PM sensors, Reference Instruments and T, RH sensors.
Figure 7
Figure 7
Schematic of the chamber for particle measurements and the arrangement of particle sensors, developed by Wang Yang (2015). A SidePak Personal Aerosol Monitor AM510 (TSI Inc.), a scanning mobility particle sizer (SMPS, TSI Inc.), and an Air-Assure PM2.5 Indoor Air Quality Monitor (TSI Inc.) were used to provide reference measurement results to evaluate the performance of the sensors (image reprinted with permission provided by Taylor and Francis and Copyright Clearance Center—License Number 4836480810613).
Figure 8
Figure 8
Schematic of the experimental set-up realized by Austin’s group. The blue circles indicate the location of the mixing fans inside the chamber (2015) (image reprinted under the terms of the Creative Commons Attribution License which permits unrestricted use; PLoS ONE 10(9), e0137789, doi:10.1371/journal.pone.0137789).
Figure 9
Figure 9
Experimental set up used by Peter’s group (2016) (A). Schematics of the aerosol generation systems shown in panel (B) (image reprinted with permission provided by the Taylor and Francis and Copyright Clearance Center—License Number 4836480661138).
Figure 10
Figure 10
Schematic of the chamber system developed by Papapostolu et al. (2017) (image reprinted with ELSEVIER PERMISSION—License Number 4833500101157).
Figure 11
Figure 11
Experimental setup to characterize the aerosol chamber and evaluate the PM sensors of Hapidin (2019) (image reprinted under the terms of the Taiwan Association for Aerosol Research and Aerosol and Air Quality Research. All articles published on this site use the Creative Commons Attribution 4.0 License (CC BY 4.0); Aerosol and Air Quality Research, 19: 181–194, 2019; doi:10.4209/aaqr.2017.12.0611).
Figure 12
Figure 12
Schematics of low-cost dust sensor evaluation systems: (A) chamber test; (B) low-speed duct test (image reprinted under the terms of the Creative Commons Attribution 4.0 License (CC BY 4.0); Indoor air, 30(1), 137–146, doi:10.1111/ina.12615).
Figure 13
Figure 13
Schematic of the chamber system with the main components developed by Omidvarborna et al. (2020) (image reprinted with ELSEVIER PERMISSION—License Number 4834170480943).
Figure 14
Figure 14
Schematic showing the arrangement of the test chamber and the supporting equipment (image reprinted under the terms and conditions of the Creative Commons Attribution (CC BY 4.0) license—License MDPI, Basel, Switzerland Sensors 2020, 20, 2219; doi:10.3390/s20082219).
Figure 15
Figure 15
Schematic diagram of collision nebulizer (reprinted with ELSEVIER PERMISSION—License Number 4834190009888).
Figure 16
Figure 16
Diagram of a typical pressurized metered dose inhaler showing the mechanism of particle formation (MMAD = mass median aerodynamic diameter). Adapted from Figure 1 in [78].

References

    1. Haklay M., Eleta I. Integrating Human Health into Urban and Transport Planning. Springer; Cham, Switzeland: 2019. On the front line of community-led air quality monitoring; pp. 563–580.
    1. Dowthwaite L., Sprinks J. Citizen science and the professional-amateur divide: Lessons from differing online practices. J. Sci. Commun. 2019;18 doi: 10.22323/2.18010206. - DOI
    1. EPA Criteria Air Pollutants. [(accessed on 30 September 2019)]; Available online: https://www.epa.gov/criteria-air-pollutants.
    1. Searched Topics: PM Pollution, NO2 Pollution, CO Pollution, PM Pollution, O3 Pollution. [(accessed on 30 September 2019)]; Available online: https://trends.google.com/trends.
    1. Kim K.-H., Kabir E., Kabir S. A review on the human health impact of airborne particulate matter. Environ. Int. 2015;74:136–143. doi: 10.1016/j.envint.2014.10.005. - DOI - PubMed

LinkOut - more resources