. 2020 Nov 29;9(12):3880.
doi: 10.3390/jcm9123880.

Impact of Tranexamic Acid on Chondrocytes and Osteogenically Differentiated Human Mesenchymal Stromal Cells (hMSCs) In Vitro

Affiliations

Impact of Tranexamic Acid on Chondrocytes and Osteogenically Differentiated Human Mesenchymal Stromal Cells (hMSCs) In Vitro

Mike Wagenbrenner et al. J Clin Med. .

Abstract

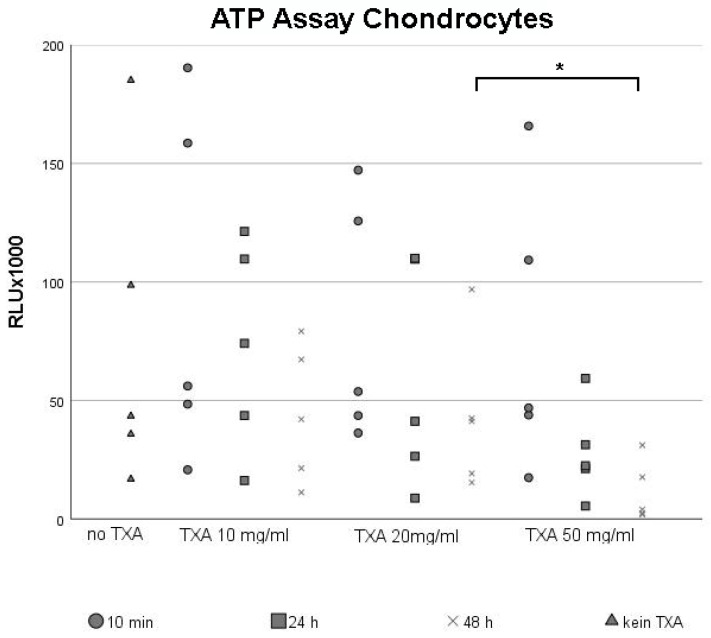
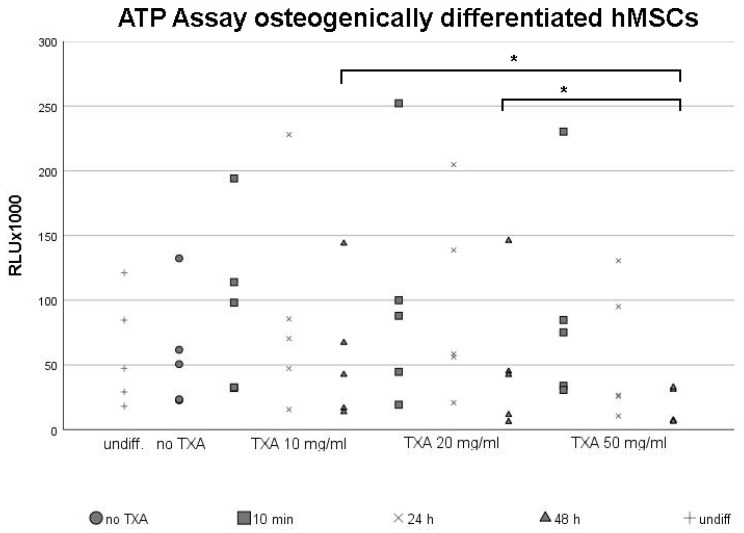
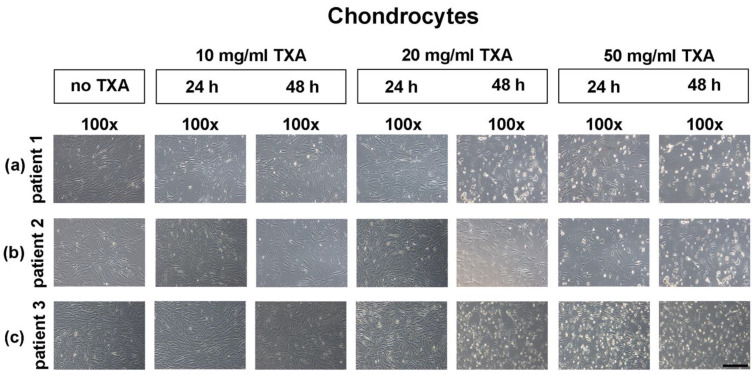
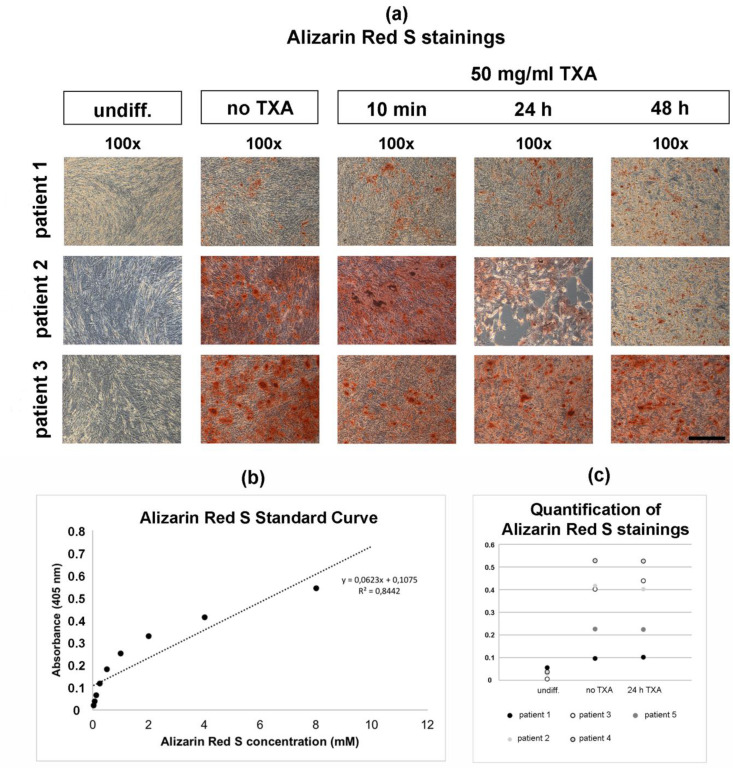
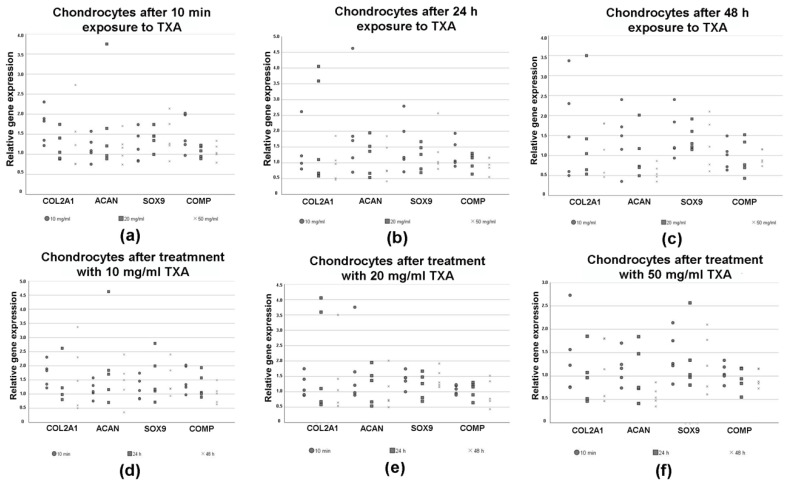
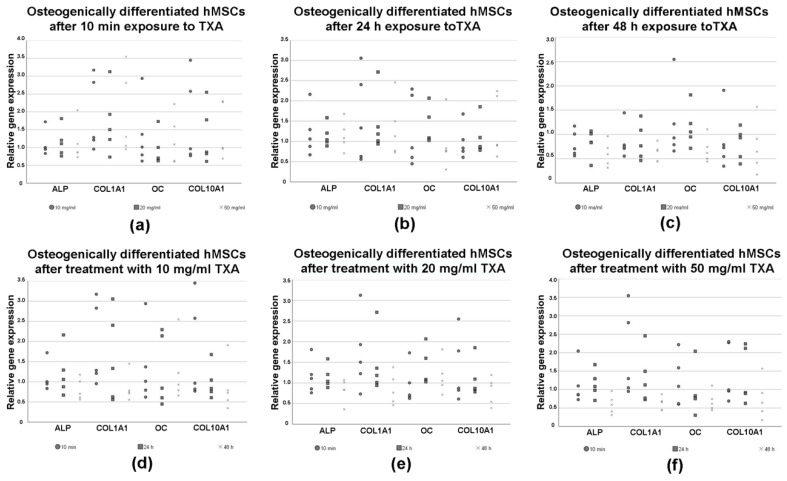
The topical application of tranexamic acid (TXA) helps to prevent post-operative blood loss in total joint replacements. Despite these findings, the effects on articular and periarticular tissues remain unclear. Therefore, this in vitro study examined the effects of varying exposure times and concentrations of TXA on proliferation rates, gene expression and differentiation capacity of chondrocytes and human mesenchymal stromal cells (hMSCs), which underwent osteogenic differentiation. Chondrocytes and hMSCs were isolated and multiplied in monolayer cell cultures. Osteogenic differentiation of hMSCs was induced for 21 days using a differentiation medium containing specific growth factors. Cell proliferation was analyzed using ATP assays. Effects of TXA on cell morphology were examined via light microscopy and histological staining, while expression levels of tissue-specific genes were measured using semiquantitative RT-PCR. After treatment with 50 mg/mL of TXA, a decrease in cell proliferation rates was observed. Furthermore, treatment with concentrations of 20 mg/mL of TXA for at least 48 h led to a visible detachment of chondrocytes. TXA treatment with 50 mg/mL for at least 24 h led to a decrease in the expression of specific marker genes in chondrocytes and osteogenically differentiated hMSCs. No significant effects were observed for concentrations beyond 20 mg/mL of TXA combined with exposure times of less than 24 h. This might therefore represent a safe limit for topical application in vivo. Further research regarding in vivo conditions and effects on hMSC functionality are necessary to fully determine the effects of TXA on articular and periarticular tissues.

Keywords: chondrocytes; differentiation capacity; hMSCs; osteoarthritis; toxicity; tranexamic acid.


Conflict of interest statement

The authors declare no conflict of interest.

Figures

Figure 1
Figure 1
ATP assay of chondrocytes cultured in monolayers after treatment with 0 mg/mL, 10 mg/mL, 20 mg/mL and 50 mg/mL of tranexamic acid for varying exposure times. Chondrocytes from five different donors were seeded in cell culture flasks, incubated in cell culture medium and grown to confluency. After reaching confluency, cells were exposed to 0 mg/mL (no TXA), 10 mg/mL, 20 mg/mL or 50 mg/mL of TXA. The exposure time varied from 10 min to 24 h to 48 h. Chondrocyte proliferation was evaluated using the ATP assay. Each dot represents a single value from all five examined donor samples after treatment with different concentrations of TXA for indicated exposure times. * Significant difference (p < 0.05) compared to control samples. TXA, tranexamic acid; min, minutes; d, days; h, hours.
Figure 2
Figure 2
ATP assay of mesenchymal stromal cells following osteogenic differentiation and treatment with 50 mg/mL tranexamic acid for varying exposure times. Osteogenic differentiation was induced in primary hMSCs harvested from five different donors using an osteogenic differentiation medium for 21 d. Undifferentiated control samples (undiff.) were maintained for comparison. After 21 d of osteogenesis, MSCs were exposed to 0 mg/mL (no TXA), 10 mg/mL, 20 mg/mL or 50 mg/m of TXA. Cells were exposed to TXA for 10 min, 24 h or 48 h. Cell proliferation was evaluated using the ATP assay. Each dot represents a single value from all five examined donor samples after treatment with different concentrations of TXA for indicated exposure times. * Significant difference (p < 0.05) compared to control samples. hMSCs, human mesenchymal stromal cells; TXA, tranexamic acid; min, minutes; d, days; h, hours.
Figure 3
Figure 3
Microscopical analysis of chondrocyte growth in monolayer cultures after treatment with different concentrations of tranexamic acid for varying exposure times. Chondrocytes were harvested from the hyaline hip cartilage of three separate patients that underwent total hip arthroplasty. Cells were seeded in cell culture flasks, incubated in cell culture medium and grown to confluency. After reaching confluency, controls were maintained (no TXA), while other cells were exposed to 10 mg/mL, 20 mg/mL or 50 mg/mL of TXA. The exposure time varied from 24 h to 48 h. Representative samples from three different donors were captured directly after treatment with TXA at low (100×; black bar = 200 μm) magnification. TXA, tranexamic acid; min, minutes; d, days; h, hours.
Figure 4
Figure 4
Histological analysis (a) of osteogenesis in mesenchymal stromal cells after 21 days in monolayer cell culture and treatment with 50 mg/mL tranexamic acid for varying exposure times. Primary hMSCs were harvested from the bone marrow reaming of three separate patients that underwent total hip arthroplasty. Osteogenic differentiation was induced in hMSCs using an osteogenic differentiation medium for 21 days. Undifferentiated control samples (undiff.) were maintained for comparison. After 21 days of osteogenesis, hMSCs were exposed to no (no TXA), or 50 mg/mL of TXA. Cells were exposed to TXA for 10 min (min), 24 h (24 h) or 48 h (48 h). Alizarin Red S staining was performed to detect extracellular calcium deposits shown as red stainings. Representative samples from three different donors were captured at low (100x; black bar = 200 μm) magnification. The Alizarin Red S standard curve was calculated with the quantification assay of Alizarin Red S stainings (b). Quantitative measurements of Alizarin Red S stainings (c) were performed in undifferentiated control samples (undiff.), differentiated hMSCs (no TXA), as well as differentiated hMSCs after treatment with 50 mg/mL of TXA for 24 h (24 h TXA). Results were pictured as dot plots. hMSCs, human mesenchymal stromal cells; TXA, tranexamic acid; min, minutes; d, days; h, hours.
Figure 5
Figure 5
Relative changes in the expression of chondrogenic marker genes pictured as dot plots as measured by semiquantitative RT-PCR in chondrocytes after treatment with 0 mg/mL (no TXA), 10 mg/mL, 20 mg/mL and 50 mg/mL of tranexamic acid for varying exposure times. Chondrocytes were isolated from the hyaline hip cartilage of five patients that underwent total hip arthroplasty. Cells were incubated in cell culture medium and grown to confluency. After reaching confluency, cells were exposed to 0 mg/mL (no TXA), 10 mg/mL, 20 mg/mL or 50 mg/mL of TXA. The exposure time varied from 10 min to 24 h to 48 h. Each dot represents changes in the relative expression of the chondrogenic marker genes aggrecan (ACAN), collagen type II alpha 1 chain (COL2A1), sex-determining region Y-box 9 (SOX9) and cartilage oligomeric matrix protein (COMP) in a single donor sample in dependence of the TXA concentrations (ac) and exposure times (df). Eukaryotic elongation factor 1α (EEF1A1) was used as the housekeeping gene and for internal controls. Primer details are illustrated in Table 1. d, days; TXA, tranexamic acid, h, hours; min, minutes.
Figure 6
Figure 6
Relative changes in the expression of osteogenic marker genes pictured as dot plots as measured by semiquantitative RT-PCR in osteogenic differentiated mesenchymal stromal cells after treatment with 0 mg/mL, 10 mg/mL, 20 mg/mL and 50 mg/mL of tranexamic acid for varying exposure times. hMSCs were derived from bone marrow reamings of five patients that underwent total hip arthroplasty. Cells were seeded in cell culture flasks and incubated in osteogenic differentiation medium for 21 d. Undifferentiated cells (undiff.) were maintained for comparison. Following osteogenesis cells were exposed to 0 mg/mL (no TXA), 10 mg/mL, 20 mg/mL or 50 mg/mL of TXA. The exposure time varied from 10 min to 24 h to 48 h. Each dot represents changes in the relative expression of osteogenic marker genes collagen type I alpha 1 chain (COL1A1), collagen type X alpha 1 chain (COLXA1), alkaline phosphatase (ALP) and osteocalcin (OC) in a single donor sample in dependance of the TXA concentrations (ac) and exposure times (df) are pictured, respectively. Eukaryotic elongation factor 1α (EEF1A1) was used as the housekeeping gene and for internal controls. Primer details are illustrated in Table 1. d, days; hMSCs, human mesenchymal stromal cells; TXA, tranexamic acid, h, hours; min, minutes.

Similar articles

Cited by

References

    1. Fernandes A.C. Health at a Glance 2019. OECD Publishing; Paris, France: 2019. OECD Indicators.
    1. Carling M.S., Jeppsson A., Eriksson B.I., Brisby H. Transfusions and blood loss in total hip and knee arthroplasty: A prospective observational study. J. Orthop Surg Res. 2015;10:48. doi: 10.1186/s13018-015-0188-6. - DOI - PMC - PubMed
    1. McLean M., McCall K., Smith I.D.M., Blyth M., Kitson S.M., Crowe L.A.N., Leach W.J., Rooney B.P., Spencer S.J., Mullen M., et al. Tranexamic acid toxicity in human periarticular tissues. Bone Joint Res. 2019;8:11–18. doi: 10.1302/2046-3758.81.BJR-2018-0181.R1. - DOI - PMC - PubMed
    1. Raut S., Mertes S.C., Muniz-Terrera G., Khanduja V. Factors associated with prolonged length of stay following a total knee replacement in patients aged over 75. Int. Orthop. 2012;36:1601–1608. doi: 10.1007/s00264-012-1538-1. - DOI - PMC - PubMed
    1. Zhang H., Chen J., Chen F., Que W. The effect of tranexamic acid on blood loss and use of blood products in total knee arthroplasty: A meta-analysis. Knee Surg. Sports Traumatol. Arthrosc. Off. J. ESSKA. 2012;20:1742–1752. doi: 10.1007/s00167-011-1754-z. - DOI - PubMed

LinkOut - more resources