. 2020 Nov 28;21(23):9068.
doi: 10.3390/ijms21239068.

Function and Regulation of the Pyruvate Transporter CstA in Escherichia coli

Affiliations

Function and Regulation of the Pyruvate Transporter CstA in Escherichia coli

Ana Gasperotti et al. Int J Mol Sci. .

Abstract

Pyruvate is a central metabolite that connects many metabolic pathways in living organisms. To meet the cellular pyruvate requirements, the enterobacterium Escherichia coli has at least three pyruvate uptake systems-the H+/pyruvate symporter BtsT, and two thus far less well-characterized transporters, YhjX and CstA. BtsT and CstA belong to the putative carbon starvation (CstA) family (transporter classification TC# 2.A.114). We have created an E. coli mutant that cannot grow on pyruvate as the sole carbon source and used it to characterize CstA as a pyruvate transporter. Transport studies in intact cells confirmed that CstA is a highly specific pyruvate transporter with moderate affinity and is energized by a proton gradient. When cells of a reporter strain were cultured in complex medium, cstA expression was maximal only in stationary phase. A DNA affinity-capture assay combined with mass spectrometry and an in-vivo reporter assay identified Fis as a repressor of cstA expression, in addition to the known activator cAMP-CRP. The functional characterization and regulation of this second pyruvate uptake system provides valuable information for understanding the complexity of pyruvate sensing and uptake in E. coli.

Keywords: catabolite repression; global regulator Fis; pyruvate uptake; secondary transporter; stationary phase.


Conflict of interest statement

The authors declare no conflict of interest.

Figures

Figure 1
Figure 1
Growth of E. coli MG1655 and the triple mutant (3Δ) in media containing different C-sources. Cells of E. coli MG1655 (dark circles), the triple mutant (white circles), or the triple mutant complemented with pBAD24-cstA6H (pink circles) were grown in the indicated media at 37 °C under constant agitation. Samples were taken and OD600 was measured at different time points. (A) LB medium. (B) M9 minimal medium with 40 mM glucose. (C) M9 minimal medium with 40 mM succinate. (D) M9 minimal medium with 40 mM pyruvate. wt: Wild-type strain, 3∆: Triple mutant, 3∆ p-cstA: Triple mutant complemented with pBAD24-cstA6H. The graphs show the means and standard deviations of three independent replicates.
Figure 2
Figure 2
Phenotypic characterization of the 3∆ mutant. (A) Chemotaxis. The plug-in-pond assay was utilized to test chemotaxis towards pyruvate and glucose. Agar plugs containing 50 mM pyruvate (P) and glucose (G), respectively, were placed in a petri dish and covered with a suspension of cells in soft agar (0.25%, w/v). Plates were left to solidify and then incubated at 37 °C for 3 h. The pictures are representative of three independent assays. (B) Pyruvate overflow and uptake. E. coli MG1655 (wt, black circles), the 3∆ mutant (white circles) and the 3∆ mutant complemented with pBAD24-cstA6H (pink circles) were grown in LB medium at 37 °C, and samples were taken every 20 min. OD600 was measured and samples were centrifuged to collect the supernatant. Pyruvate concentrations in the supernatants were determined and values were plotted against OD600. Wt: Wild-type strain, 3∆: Triple mutant, 3∆ p-cstA: Triple mutant complemented with pBAD24-cstA6H. The graph shows the means and standard deviations of three independent replicates.
Figure 3
Figure 3
Characterization of pyruvate uptake mediated by CstA in intact cells. (A) Time course of pyruvate uptake by E. coli strains. Rates of [14C]pyruvate uptake were measured at a final pyruvate concentration of 10 µM at 15 °C in E. coli MG1655 (black circles), the triple mutant (3∆, white circles), and the triple mutant complemented with pBAD24-cstA6H (3∆ p-cstA, pink circles). (B) The Km value was determined by quantification of the initial rate of pyruvate uptake by CstA in the presence of increasing concentrations of pyruvate. The values were corrected by subtracting the diffusion rates (i.e., uptake rate measured for the 3∆ mutant). The best-fit curve was determined by nonlinear regression using the Michaelis–Menten equation. (C) Substrate specificity. The effect of the different substrates on pyruvate uptake was measured by simultaneously adding 1 mM substrate and 10 µM [14C]pyruvate. (D) Effects of the indicated protonophores and ionophores on pyruvate uptake by CstA. Cells were preincubated at room temperature with the inhibitors for 30 min before adding 10 µM [14C]pyruvate. Control: Transport activity in Tris/MES buffer. Control (val): Transport activity in phosphate buffer, used to assess valinomycin effect (see Methods). All experiments were performed in triplicate; the error bars indicate the standard deviations of the mean. One-way ANOVA (multiple comparisons) was performed using GraphPad Prism, comparing each treatment to the control. Significant differences: **** p < 0.0001, *** p < 0.001.
Figure 4
Figure 4
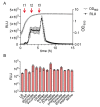
Activation of the cstA promoter under various growth conditions. The promoter region of cstA (300 bp upstream the gene) was cloned into a reporter plasmid containing the luxCDABE operon of P. luminescens. E. coli MG1655 cells were transformed with this plasmid and grown at 37 °C in the indicated media. Luminescence levels and OD600 was measured over time. (A) Expression pattern of cstA. Luminescence normalized to an optical density (OD600) of 1 (RLU) and growth of cells in LB medium over time. The arrows indicate the time points (t1, t2 and t3) at which samples were collected for DNA affinity-capture assay. (B) Expression pattern of cstA in cells grown in M9 minimal medium supplemented with 40 mM of the indicated C-sources. The maximal luciferase activity normalized to an optical density (OD600) of 1 (RLU) served as the measure for cstA expression. The histogram shows the maximal levels of cstA expression recorded in each case. All experiments were performed in triplicate, and the error bars indicate the standard deviations of the mean. CAA, casamino acids.
Figure 5
Figure 5
(A) Promoter activities of cstA and btsT in E. coli mutants. A luciferase-based reporter assay was used to monitor the promoter activities of cstA and btsT in the indicated E. coli mutants. All strains were transformed with the plasmid pBBR1-cstAprom-lux or pBBR1-btsTprom-lux. Bacteria were cultivated in LB medium under aerobic conditions, and the growth and activity of the reporter were continuously monitored. The maximal luciferase activity normalized to an optical density (OD600) of 1 (RLU) served as the measure for cstA or btsT (formerly yjiY) promoter activity. All experiments were performed in triplicate, and the error bars indicate the standard deviations of the mean. One-way ANOVA (multiple comparisons) was performed using GraphPad Prism comparing each mutant to the wt, significant differences (**** p < 0.0001) were found for Δcrp (for both reporter genes) and Δfis. (B) Analysis of the promoter region of cstA. Fragments of the nucleotide sequence of the cstA upstream region (positions −200 to −120) within which the binding motifs for CRP and Fis were identified. The CRP binding site (bold letters) corresponds to the sequence previously published [23]. For Fis, the motif G-7N-6N-5N-4R-3N-2N-1N0N1N2Y3N4N5N6C7, based on Shao et al. [35], was used. Two possible binding sites with the specific characteristics where found (Fis1 and Fis2), both of which are close to the CRP binding site.

Similar articles

Cited by

References

    1. Ahn S.J., Deep K., Turner M.E., Ishkov I., Waters A., Hagen S.J., Rice K.C. Characterization of LrgAB as a stationary phase-specific pyruvate uptake system in Streptococcus mutans. BMC Microbiol. 2019;19:1–15. doi: 10.1186/s12866-019-1600-x. - DOI - PMC - PubMed
    1. Steiner B.D., Eberly A.R., Hurst M.N., Zhang E.W., Green H.D., Behr S., Jung K., Hadjifrangiskou M. Evidence of cross-regulation in two closely related pyruvate-sensing systems in uropathogenic Escherichia coli. J. Membr. Biol. 2018;251:65–74. doi: 10.1007/s00232-018-0014-2. - DOI - PMC - PubMed
    1. Tuntufye H.N., Lebeer S., Gwakisa P.S., Goddeeris B.M. Identification of avian pathogenic Escherichia coli genes that are induced in vivo during infection in chickens. Appl. Environ. Microbiol. 2012;78:3343–3351. doi: 10.1128/AEM.07677-11. - DOI - PMC - PubMed
    1. Schär J., Stoll R., Schauer K., Loeffler D.I.M., Eylert E., Joseph B., Eisenreich W., Fuchs T.M., Goebel W. Pyruvate carboxylase plays a crucial role in carbon metabolism of extra and intracellularly replicating Listeria monocytogenes. J. Bacteriol. 2010;192:1774–1784. doi: 10.1128/JB.01132-09. - DOI - PMC - PubMed
    1. Harper L., Balasubramanian D., Ohneck E.A., Sause W.E., Chapman J., Mejia-Sosa B., Lhakhang T., Heguy A., Tsirigos A., Ueberheide B., et al. Staphylococcus aureus responds to the central metabolite pyruvate to regulate virulence. mBio. 2018;9:1–17. doi: 10.1128/mBio.02272-17. - DOI - PMC - PubMed

LinkOut - more resources