

Prevalence of COVID-19 Diagnostic Output with Chest Computed Tomography: A Systematic Review and Meta-Analysis
- PMID: 33260639
- PMCID: PMC7759864
- DOI: 10.3390/diagnostics10121023
Prevalence of COVID-19 Diagnostic Output with Chest Computed Tomography: A Systematic Review and Meta-Analysis
Abstract
Background: The pooled prevalence of chest computed tomography (CT) abnormalities and other detailed analysis related to patients' biodata like gender and different age groups have not been previously described for patients with coronavirus disease 2019 (COVID-19), thus necessitating this study. Objectives: To perform a meta-analysis to evaluate the diagnostic performance of chest CT, common CT morphological abnormalities, disease prevalence, biodata information, and gender prevalence of patients.
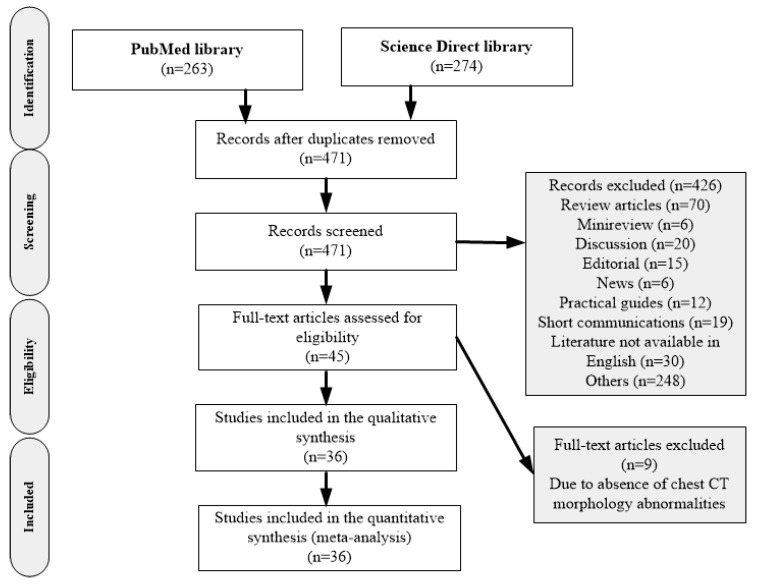
Methods: Studies were identified by searching PubMed and Science Direct libraries from 1 January 2020 to 30 April 2020. Pooled CT positive rate of COVID-19 and RT-PCR, CT-imaging features, history of exposure, and biodata information were estimated using the quality effect (QE) model.
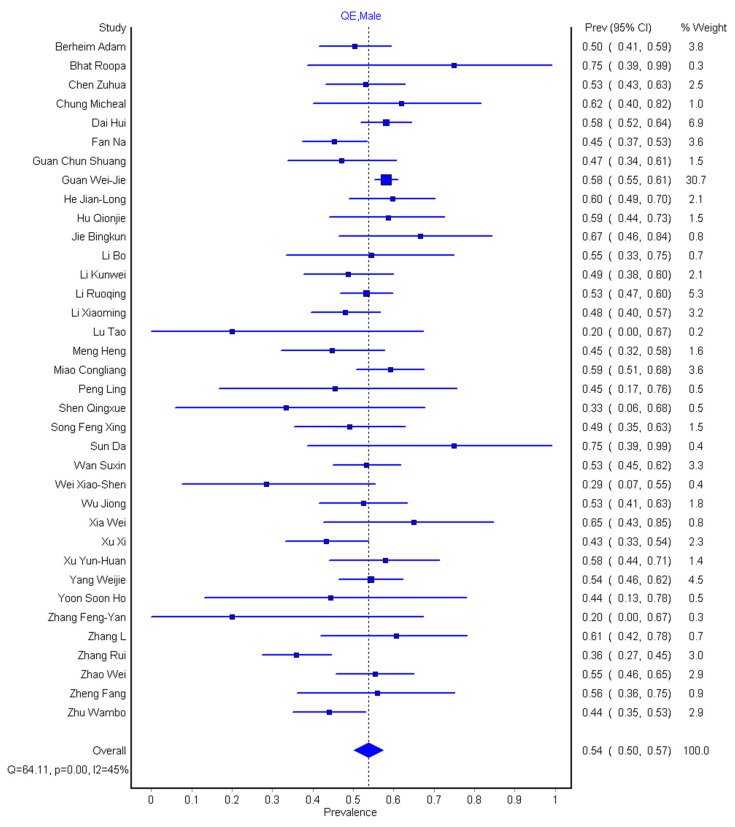
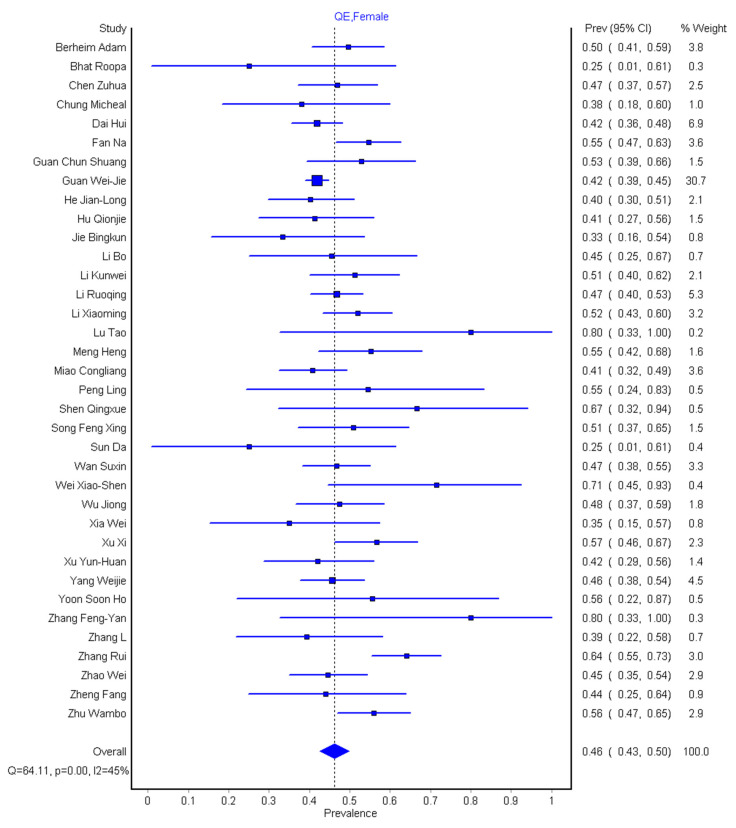
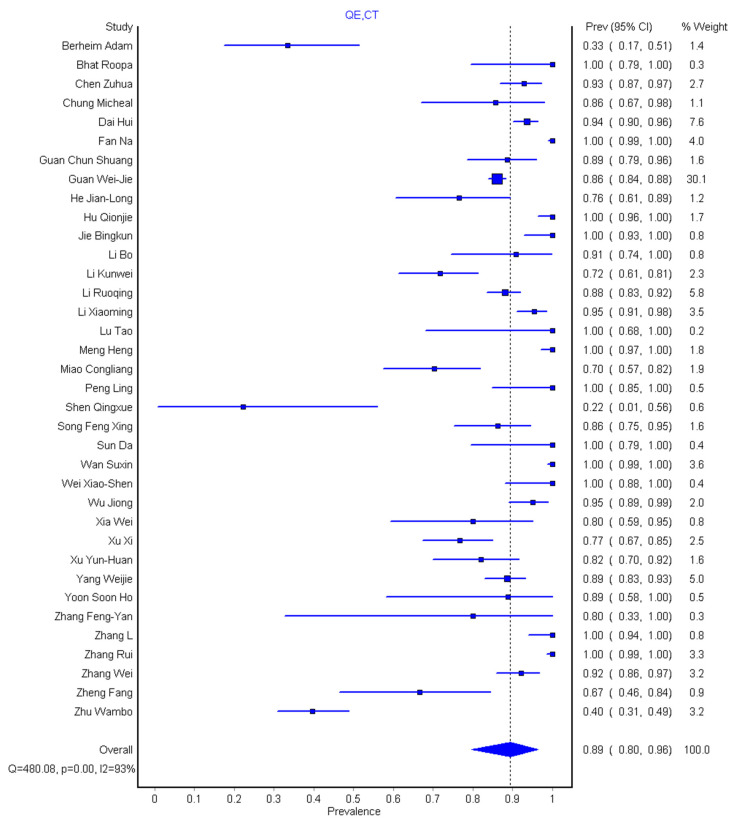
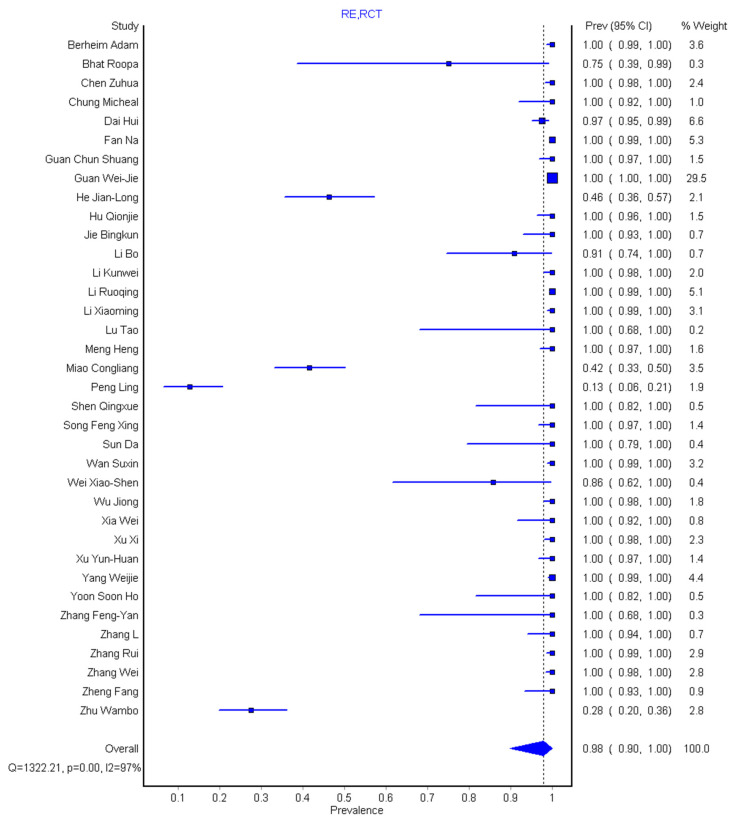
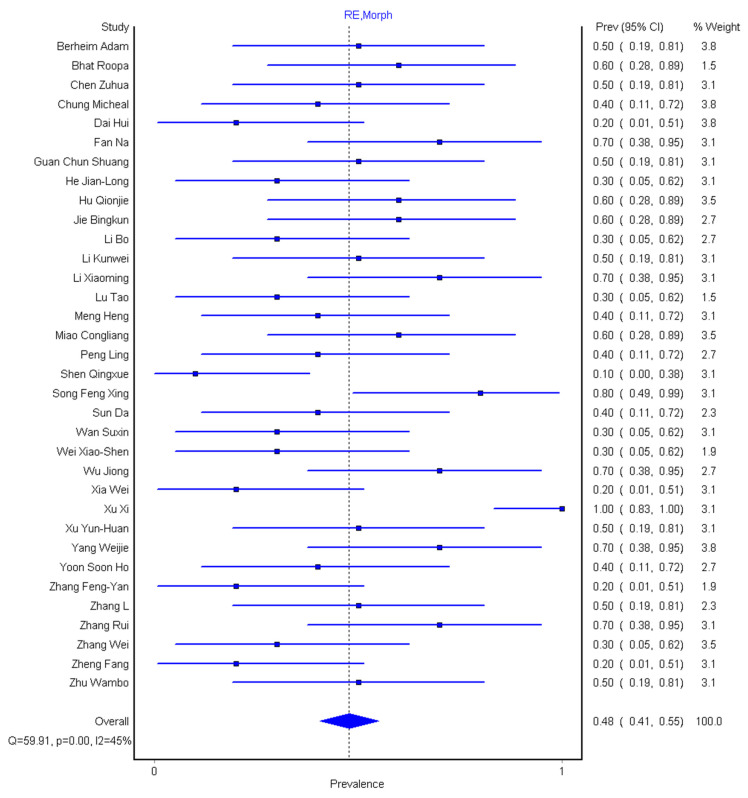
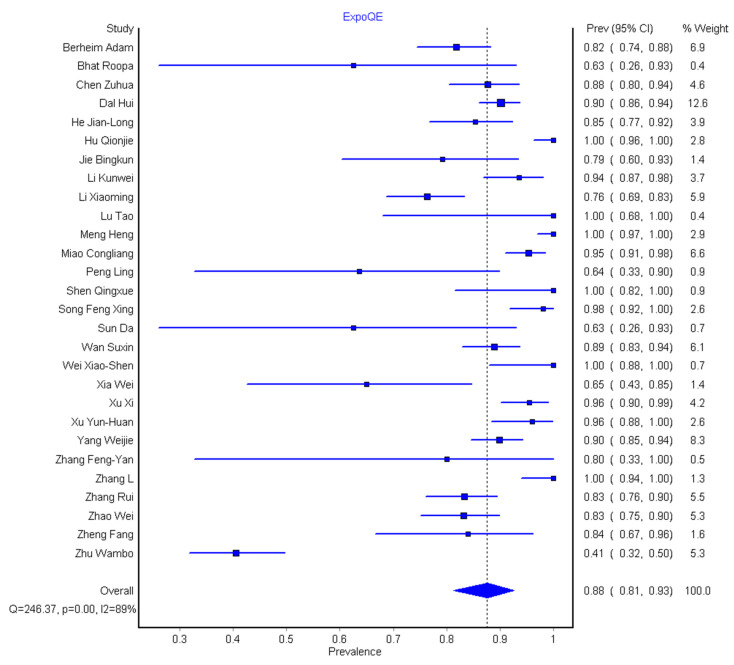
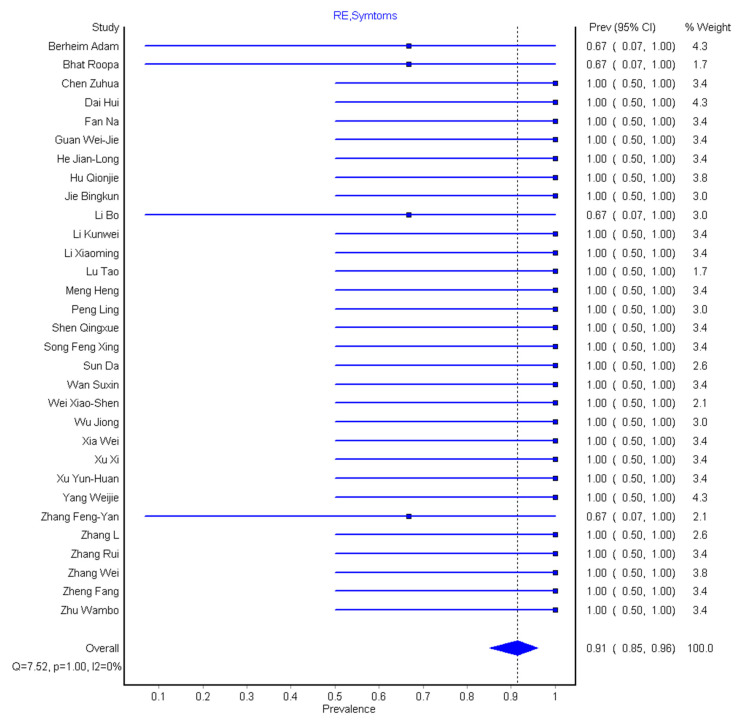
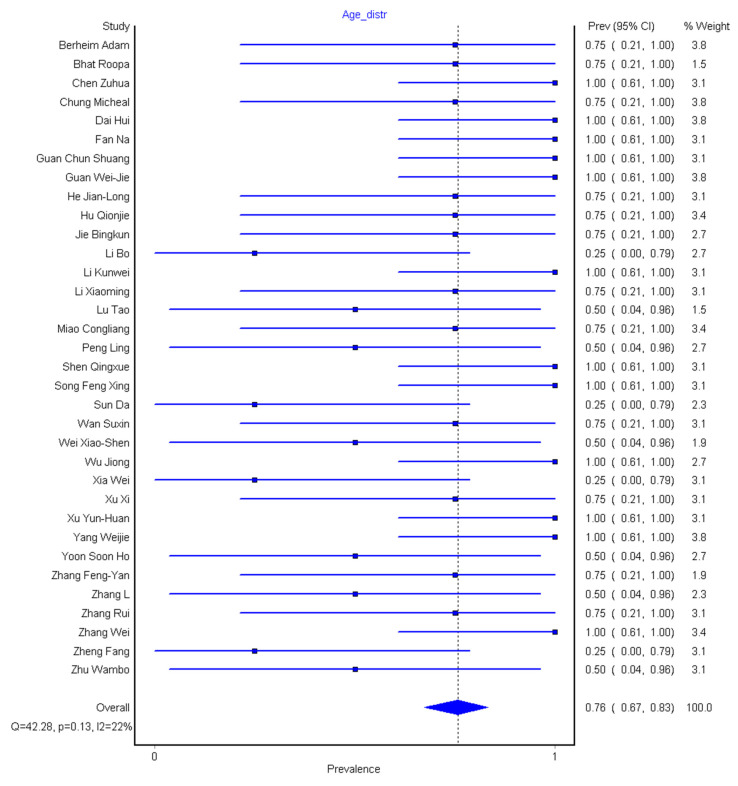
Results: Out of 36 studies included, the sensitivity was 89% (95% CI: 80-96%) and 98% (95% CI: 90-100%) for chest CT and reverse transcription-polymerase chain reaction (RT-PCR), respectively. The pooled prevalence across lesion distribution were 72% (95% CI: 62-80%), 92% (95% CI: 84-97%) for lung lobe, 88% (95% CI: 81-93%) for patients with history of exposure, and 91% (95% CI: 85-96%) for patients with all categories of symptoms. Seventy-six percent (95% CI: 67-83%) had age distribution across four age groups, while the pooled prevalence was higher in the male with 54% (95% CI: 50-57%) and 46% (95% CI: 43-50%) in the female.
Conclusions: The sensitivity of RT-PCR was higher than chest CT, and disease prevalence appears relatively higher in the elderly and males than children and females, respectively.
Keywords: COVID-19; age distribution; computed tomography; meta-analysis; prevalence.
Conflict of interest statement
The authors declare no competing financial interest or personal relationships that could have appeared to influence the work reported in this paper.
Figures
Similar articles
-
Diagnostic Performance of CT and Reverse Transcriptase Polymerase Chain Reaction for Coronavirus Disease 2019: A Meta-Analysis.Radiology. 2020 Sep;296(3):E145-E155. doi: 10.1148/radiol.2020201343. Epub 2020 Apr 17. Radiology. 2020. PMID: 32301646 Free PMC article.
-
Thoracic imaging tests for the diagnosis of COVID-19.Cochrane Database Syst Rev. 2020 Nov 26;11:CD013639. doi: 10.1002/14651858.CD013639.pub3. Cochrane Database Syst Rev. 2020. Update in: Cochrane Database Syst Rev. 2021 Mar 16;3:CD013639. doi: 10.1002/14651858.CD013639.pub4. PMID: 33242342 Updated.
-
Thoracic imaging tests for the diagnosis of COVID-19.Cochrane Database Syst Rev. 2020 Sep 30;9:CD013639. doi: 10.1002/14651858.CD013639.pub2. Cochrane Database Syst Rev. 2020. Update in: Cochrane Database Syst Rev. 2020 Nov 26;11:CD013639. doi: 10.1002/14651858.CD013639.pub3. PMID: 32997361 Updated.
-
Chest computed tomography for the diagnosis of patients with coronavirus disease 2019 (COVID-19): a rapid review and meta-analysis.Ann Transl Med. 2020 May;8(10):622. doi: 10.21037/atm-20-3311. Ann Transl Med. 2020. PMID: 32566559 Free PMC article.
-
The Limited Sensitivity of Chest Computed Tomography Relative to Reverse Transcription Polymerase Chain Reaction for Severe Acute Respiratory Syndrome Coronavirus-2 Infection: A Systematic Review on COVID-19 Diagnostics.Invest Radiol. 2020 Dec;55(12):754-761. doi: 10.1097/RLI.0000000000000700. Invest Radiol. 2020. PMID: 32554983 Free PMC article.
Cited by
-
CT-Based Risk Stratification for Intensive Care Need and Survival in COVID-19 Patients-A Simple Solution.Diagnostics (Basel). 2021 Sep 4;11(9):1616. doi: 10.3390/diagnostics11091616. Diagnostics (Basel). 2021. PMID: 34573957 Free PMC article.
-
Diagnostic Test Accuracy of Deep Learning Detection of COVID-19: A Systematic Review and Meta-Analysis.Acad Radiol. 2021 Nov;28(11):1507-1523. doi: 10.1016/j.acra.2021.08.008. Epub 2021 Sep 17. Acad Radiol. 2021. PMID: 34649779 Free PMC article.
References
-
- World Health Organization (WHO) Coronavirus Disease (COVID-19) Pandemic. World Health Organization; Geneva, Switzerland: [(accessed on 5 August 2020)]. Available online: https://www.who.int/emergencies/diseases/novel-coronavirus-2019.
Publication types
LinkOut - more resources
Full Text Sources
Miscellaneous
