. 2020 Nov 28;10(12):920.
doi: 10.3390/brainsci10120920.

Speech-Brain Frequency Entrainment of Dyslexia with and without Phonological Deficits

Affiliations

Speech-Brain Frequency Entrainment of Dyslexia with and without Phonological Deficits

Juliana Dushanova et al. Brain Sci. .

Abstract

Developmental dyslexia is a cognitive disorder characterized by difficulties in linguistic processing. Our purpose is to distinguish subtypes of developmental dyslexia by the level of speech-EEG frequency entrainment (δ: 1-4; β: 12.5-22.5; γ1: 25-35; and γ2: 35-80 Hz) in word/pseudoword auditory discrimination. Depending on the type of disabilities, dyslexics can divide into two subtypes-with less pronounced phonological deficits (NoPhoDys-visual dyslexia) and with more pronounced ones (PhoDys-phonological dyslexia). For correctly recognized stimuli, the δ-entrainment is significantly worse in dyslexic children compared to controls at a level of speech prosody and syllabic analysis. Controls and NoPhoDys show a stronger δ-entrainment in the left-hemispheric auditory cortex (AC), anterior temporal lobe (ATL), frontal, and motor cortices than PhoDys. Dyslexic subgroups concerning normolexics have a deficit of δ-entrainment in the left ATL, inferior frontal gyrus (IFG), and the right AC. PhoDys has higher δ-entrainment in the posterior part of adjacent STS regions than NoPhoDys. Insufficient low-frequency β changes over the IFG, the inferior parietal lobe of PhoDys compared to NoPhoDys correspond to their worse phonological short-term memory. Left-dominant 30 Hz-entrainment for normolexics to phonemic frequencies characterizes the right AC, adjacent regions to superior temporal sulcus of dyslexics. The pronounced 40 Hz-entrainment in PhoDys than the other groups suggest a hearing "reassembly" and a poor phonological working memory. Shifting up to higher-frequency γ-entrainment in the AC of NoPhoDys can lead to verbal memory deficits. Different patterns of cortical reorganization based on the left or right hemisphere lead to differential dyslexic profiles.

Keywords: auditory cortex; developmental dyslexia; frequency oscillations; inferior frontal cortex.


Conflict of interest statement

The authors declare no conflict of interest.

Figures
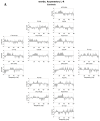
Figure 1
Figure 1
Hemispheric asymmetry of speech–brain entrainment for (A) controls, (B) NoPhoDys, and (C) PhoDys when word listening (left-right hemisphere). Points indicate statistically significant differences (nonparametric bootstrap, p < 0.05). The speech–brain entrainment on respective left hemispheric areas is represented in the upper panel of the plots and right hemispheric areas—in the lower panel of the plots.
Figure 1
Figure 1
Hemispheric asymmetry of speech–brain entrainment for (A) controls, (B) NoPhoDys, and (C) PhoDys when word listening (left-right hemisphere). Points indicate statistically significant differences (nonparametric bootstrap, p < 0.05). The speech–brain entrainment on respective left hemispheric areas is represented in the upper panel of the plots and right hemispheric areas—in the lower panel of the plots.
Figure 2
Figure 2
Hemispheric presentation of the group difference between controls and NoPhoDys for the word listening condition. The speech–brain entrainment on respective areas of controls is represented on the upper panel of plots and for dyslexics—on the lower panel of plots. Points indicate significant differences between the two groups (Kruskal–Wallis nonparametric test (KW test), bootstrap, p < 0.05).
Figure 3
Figure 3
Hemispheric presentation of group difference between controls and PhoDys for the word listening condition. Same format as Figure 2.
Figure 4
Figure 4
Hemispheric presentation of group difference between NoPhoDys and PhoDys for the word listening condition. The speech–brain entrainment on respective areas of NoPhoDys is represented on the upper panel of plots and for PhoDys—on the lower panel of plots. Same format as Figure 2.

References

    1. Vellutino F.R., Fletcher J.M., Snowling M.J., Scanlon D.M. Specific reading disability (dyslexia): What have we learned in the past four decades? J. Child Psychol. Psychiatry. 2004;45:2–40. doi: 10.1046/j.0021-9630.2003.00305.x. - DOI - PubMed
    1. Van Ermingen-Marbach M., Grande M., Pape-Neumann J., Sass K., Heim S. Distinct neural signatures of cognitive subtypes of dyslexia with and without phonological deficits. NeuroImage Clin. 2013;2:477–490. doi: 10.1016/j.nicl.2013.03.010. - DOI - PMC - PubMed
    1. Coltheart M., Rastle K., Perry C., Langdon R., Ziegler J.C. DRC: A dual route cascaded model of visual word recognition and reading aloud. Psychol. Rev. 2001;108:204–256. doi: 10.1037/0033-295X.108.1.204. - DOI - PubMed
    1. Castles A., Coltheart M. Varieties of developmental dyslexia. Cognition. 1993;47:149–180. doi: 10.1016/0010-0277(93)90003-E. - DOI - PubMed
    1. Funnell E. Phonological processes in reading: New evidence from acquired dyslexia. Br. J. Psychol. 1983;74:159–180. doi: 10.1111/j.2044-8295.1983.tb01851.x. - DOI - PubMed

LinkOut - more resources