. 2020 Nov 27;10(12):2228.
doi: 10.3390/ani10122228.

Transcriptome Sequencing and Comparative Analysis of Amphoteric ESCs and PGCs in Chicken (Gallus gallus)

Affiliations

Transcriptome Sequencing and Comparative Analysis of Amphoteric ESCs and PGCs in Chicken (Gallus gallus)

Kai Jin et al. Animals (Basel). .

Abstract

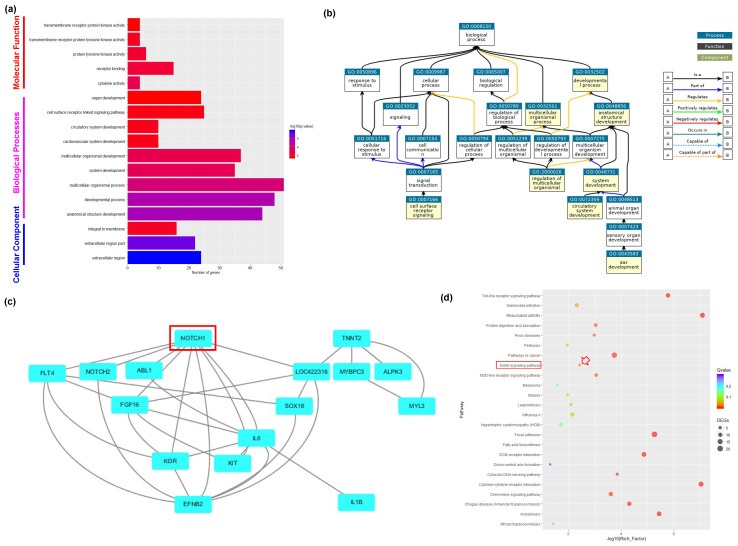
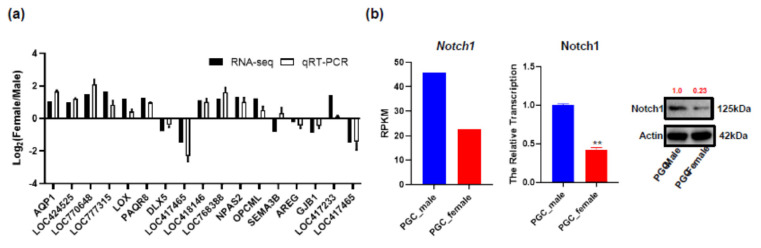
Chicken (Gallus gallus) pluripotent embryonic stem cells (ESCs) and primordial germ cells (PGCs) can be broadly applied in the research of developmental and embryonic biology, but the difference between amphoteric ESCs and PGCs is still elusive. This study determined the sex of collected samples by identifying specific sex markers via polymerase chain reaction (PCR) and fluorescence activated cell sorter (FACS). RNA-seq was utilized to investigate the transcriptomic profile of amphoteric ESCs and PGCs in chicken. The results showed no significant differentially expressed genes (DEGs) in amphoteric ESCs and 227 DEGs exhibited in amphoteric PGCs. Moreover, those 227 DEGs were mainly enriched in 17 gene ontology (GO) terms and 27 pathways according to Kyoto Encyclopedia of Genes and Genomes (KEGG) analysis. Furthermore, qRT-PCR was performed to verify RNA-seq results, and the results demonstrated that Notch1 was highly expressed in male PGCs. In summary, our results provided a knowledge base of chicken amphoteric ESCs and PGCs, which is helpful for future research in relevant biological processes.

Keywords: amphoteric ESCs; amphoteric PGCs; chicken (Gallus gallus); differentially expressed genes; transcriptome analysis.


Conflict of interest statement

The authors declare no conflict of interest.

Figures

Figure 1
Figure 1
Experimental design and confirmation of amphoteric ESCs and PGCs in chicken. (a) Tissue collection of the amphoteric blastoderm (for ESCs) and gonads (for PGCs); (b) experimental design of RNA-seq analysis (left) and amphoteric ESCs and PGCs confirmation by PCR (right-top), morphology (right medium, the red arrow points to typical ESCs clones, and the black arrow points to emblematic PGCs mass), and fluorescence activated cell sorter (FACS) (right bottom).
Figure 2
Figure 2
Transcriptome characterization of amphoteric ESCs and PGCs in chicken. (a) Heatmap showing differentially expressed genes (DEGs) in amphoteric ESCs and PGCs. Blue represents weakly expressed genes, and red represents highly expressed genes; (b) principal component analysis for eight samples. The first two principal components are displayed on the graph; (c) volcano plot where the x-axis represents the level of differential expression and the y-axis shows significant differences in expression as negative log values. The horizontal line is the threshold of corrected FDR < 0.001(−log10(FDR) > 3). In ovaries, downregulated genes are indicated by green dots, upregulated genes in ovaries are indicated by red dots, and other genes are indicated by blue dots.
Figure 3
Figure 3
Enrichment analysis of DEGs in amphoteric PGCs in chicken. (a) Significant GO terms in amphoteric PGCs; (b) the directed acyclic graph (DAG) of biological processes (BP) GO term in amphoteric PGCs; (c) prediction of protein–protein interaction (PPI) relationship of DEGs in amphoteric PGCs; (d) the KEGG enrichment analysis of the DEGs in amphoteric PGCs. The red arrow points to the Notch signal.
Figure 4
Figure 4
Validation of transcriptome data by real-time qRT-PCR and Notch1 specific expression in male PGCs. (a) Expression comparisons of selected genes detected by RNA-Seq and qRT-PCR between amphoteric ESCs and PGCs. The y-axis shows log2 (fold differences) determined by RNA-Seq and qRT-PCR. The experiments were repeated three times and provided consistent results. The mean values and error bars were obtained from three biological and three technical replicates; (b) the expression of Notch1 in amphoteric PGCs: the RPKM values of RNA-seq result (left), the expression level of RNA (RT-qPCR, medium) and protein (Western blot, right) results of amphoteric PGCs. All experiments were repeated three times and provided consistent results. The mean values and error bars were obtained from three biological and three technical replicates. The red number in Western Blot presents normalized intensity. **: means differ significantly (p ≤ 0.05)

Similar articles

Cited by

References

    1. Johnsson M., Henriksen R., Höglund A., Fogelholm J., Jensen P., Wright D. Genetical genomics of growth in a chicken model. BMC Genomics. 2018;19:72. doi: 10.1186/s12864-018-4441-3. - DOI - PMC - PubMed
    1. Nowak-Sliwinska P., Segura T., Iruela-Arispe M.L. The chicken chorioallantoic membrane model in biology, medicine and bioengineering. Angiogenesis. 2014;17:779–804. doi: 10.1007/s10456-014-9440-7. - DOI - PMC - PubMed
    1. Martowicz A., Kern J., Gunsilius E., Untergasser G. Establishment of a human multiple myeloma xenograft model in the chicken to study tumor growth, invasion and angiogenesis. J. Vis. Exp. 2015:e52665. doi: 10.3791/52665. - DOI - PMC - PubMed
    1. Coleman C.M. Chicken embryo as a model for regenerative medicine. Birth Defects Res. C. Embryo Today. 2008;84:245–256. doi: 10.1002/bdrc.20133. - DOI - PubMed
    1. Sun C., Wang Y., Jin K., Song J., Zuo Q., Zhang Y., Chen G., Li B. Study on immortal conditions of chicken embryonic stem cells. J. Cell. Biochem. 2008 doi: 10.1002/jcb.27173. - DOI - PubMed

LinkOut - more resources