Review
. 2020 Nov 27;25(23):5576.
doi: 10.3390/molecules25235576.

Cyclodextrin-Based Contrast Agents for Medical Imaging

Affiliations
Review

Cyclodextrin-Based Contrast Agents for Medical Imaging

Yurii Shepelytskyi et al. Molecules. .

Abstract

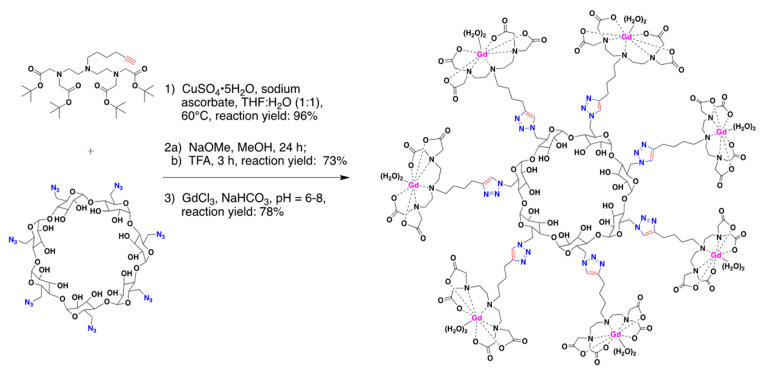
Cyclodextrins (CDs) are naturally occurring cyclic oligosaccharides consisting of multiple glucose subunits. CDs are widely used in host-guest chemistry and biochemistry due to their structural advantages, biocompatibility, and ability to form inclusion complexes. Recently, CDs have become of high interest in the field of medical imaging as a potential scaffold for the development of a large variety of the contrast agents suitable for magnetic resonance imaging, ultrasound imaging, photoacoustic imaging, positron emission tomography, single photon emission computed tomography, and computed tomography. The aim of this review is to summarize and highlight the achievements in the field of cyclodextrin-based contrast agents for medical imaging.

Keywords: CT; MRI; PAI; PET; SPECT; contrast agents; medical imaging; α-cyclodextrin; β-cyclodextrin; γ-cyclodextrin.


Conflict of interest statement

The authors declare no conflict of interest.

Figures

Figure 1
Figure 1
Chemical structure of (a) α-cyclodextrin, (b) β-cyclodextrin, and (c) γ-cyclodextrin.
Figure 2
Figure 2
(a) Molecular structure of Mn(II)-TPP and bridged bis(permethyl-β-CD)s polymer. (b) Representative 2D coronal T1-weighted MR images of the mice at 2, 5, 10, 20, and 25 min after intravenous injection of Mn(II)-TPP/bridged β-CD magnetic resonance imaging (MRI) contrast agents at 0.03 mmol of Mn/kg [63]. The images are reprinted with permission from publisher [63].
Figure 3
Figure 3
Magnetic resonance molecular imaging with cRGD-POSS-βCD-(DOTA-Gd)-Cy5 in mice bearing 4T1-Luc2-CFP tumor xenografts. The representative 2D axial fat-suppressed T1-weighted spin-echo MRI images before and at 5, 15, and 30 min post-injection of ProHance (a), cRAD-POSS-bCD-(DOTA-Gd)-Cy5 (b), and cRGD-POSS-bCD-(DOTA-Gd)-Cy5 (c) at 0.1 mmol-Gd/kg. The injection of cRGD-POSS-βCD-(DOTA-Gd)-Cy5 creates superior signal enhancement in tumor region. The images are reprinted with permission from publisher [67]. (d) Molecular structure of the developed cRGD-POSS-βCD-(DOTA-Gd)-Cy5 contrast agent.
Figure 4
Figure 4
Multivalent β-CD “Click cluster”, containing seven paramagnetic chelating groups, each with two water exchange sites linked via triazole-based linkers. The β-CD “Click cluster” was synthesized from per-azido-β-CD precursor and conjugated using the well-established Huigsen cycloaddition reaction. Figure adapted from Bryson et al. with permission from publisher [35].
Figure 5
Figure 5
Representative T1 weighted multislice image of the mice heart after 0.1 mM Gd/kg injection of G2/MOP–DTPA–Gd contrast (a) and Magnevist (b). The superior contrast-to-noise ratio was observed from the heart after the G2/MOP–DTPA–Gd injection. The images (a) and (b) are reprinted with permission from publisher [24]. (c) The molecular structure of the developed G2/MOP-DTPA-Gd CD-based contrast agent.
Figure 6
Figure 6
(a) T1 weighted 3D maximum intensity projection images of Balb/c mice. Mice were injected with Gd(III)-DO3A-HPCD (top row) or Gd(III) -DO3A-HPCD/Pluronic polirotaxane (bottom row) at a 0.03 mM-Gd/kg dose. Contrast agent distribution is shown in the images for pre injection and 5, 15, and 30 min after injection in to the tail vein with Gd3+ complexes. Images have been re-printed with permission from publisher [73]. (b) Molecular structure of the Gd(III)-DO3A-HPCD/Pluronic polirotaxane developed by Zhou et al.
Figure 7
Figure 7
In vitro experiment at 14T demonstrating the potential application of β-CD as a contrast agent for hyperpolarized (HP) 13C MRI. (a) Proton gradient echo image demonstrating the position of phantoms with a different concentration of β-CD (0–10 mM). The HP 13C imaging was performed after the administration of 2.5 mM HP [1-13C] benzoic acid. It can be seen that the MRI signal decreases with β-CD concentration. (b) Relative MRI 13C signal dependence on β-CD concentration [86]. The images are reprinted with permission from publisher [86].
Figure 8
Figure 8
(a) Schematic representation of how CD-based ternary complexes are formed in the presence of HP 129Xe. The guest is threaded through the hydrophobic cavity of cyclodextrin and HP 129Xe is introduced. Detection via HyperCEST is obtained in order to determine if HP 129Xe is bound in the cavity of CD. The images are reprinted with permission from publisher [95]. (b) The developed cyclodextrin-based pseudorotaxane used for in vitro HyperCEST detection [95].
Figure 9
Figure 9
(a) High-resolution PA signal originated from upconversional NPs (UCNPs) in cyclohexane (black curve), distilled water (green curve), and α-CD/UCNPs (red curve) in water. The excitation was conducted using 980 nm nanosecond pulsed laser. (b) Photo-acoustic imaging (PAI) of tissue-mimicking phantom containing chambers filled with α-CD/UCN in water (green arrow) and distilled water (white arrow) [49]. The images are reprinted with permission from the publisher [49].
Figure 10
Figure 10
Timeline of the injection protocol employed for (a) pre-targeted, (b) SNP control (64Cu-DHP⊂SNPs), and (c) free radiolabeled reporter (64Cu-Tz) studies. Representative in vivo microPET/CT images of the mice (n = 4/group) subjected to the three studies at 24 h p.i. Labels T, L, K, and B refer to the tumor, liver, kidney, and bladder, respectively. Dashed lines correspond to the transverse cross-section through the center of each tumor mass, whose image is shown in the right panel [99]. The images are reprinted with permission from publisher [99]. (d) The chemical structure of the tumor targeting imaging probe developed by Hou et al. [99].
Figure 11
Figure 11
In vivo 3D volume-rendered (A,B) and maximum intensity projections in axial (C,D) and coronal (E,F) view CT images of the tumor-bearing mouse obtained pre- (A,C,E) and post- (B,D,F) injection of Ir-Gd-α-CD-DyNPs contrast agent [53]. The images are reprinted with permission from the publisher [53]. The position of the tumor was marked by red circles. The chemical structure of the developed CT contrast agent is shown in (G).

References

    1. Stella V.J., He Q. Cyclodextrins. Toxicol. Pathol. 2008;36:30–42. doi: 10.1177/0192623307310945. - DOI - PubMed
    1. Jansook P., Ogawa N., Loftsson T. Cyclodextrins: Structure, physicochemical properties and pharmaceutical applications. Int. J. Pharm. 2017;535:272–284. doi: 10.1016/j.ijpharm.2017.11.018. - DOI - PubMed
    1. Del Valle E.M.M. Cyclodextrins and their uses: A review. Process. Biochem. 2004;39:1033–1046. doi: 10.1016/S0032-9592(03)00258-9. - DOI
    1. Lai W.-F. Cyclodextrins in non-viral gene delivery. Biomaterials. 2014;35:401–411. doi: 10.1016/j.biomaterials.2013.09.061. - DOI - PMC - PubMed
    1. Irie T., Uekama K. Pharmaceutical Applications of Cyclodextrins. III. Toxicological Issues and Safety Evaluation. J. Pharm. Sci. 1997;86:147–162. doi: 10.1021/js960213f. - DOI - PubMed