. 2020 Dec 1;13(1):164.
doi: 10.1186/s13041-020-00704-3.

Altered striatal dopamine levels in Parkinson's disease VPS35 D620N mutant transgenic aged mice

Affiliations

Altered striatal dopamine levels in Parkinson's disease VPS35 D620N mutant transgenic aged mice

Sarivin Vanan et al. Mol Brain. .

Abstract

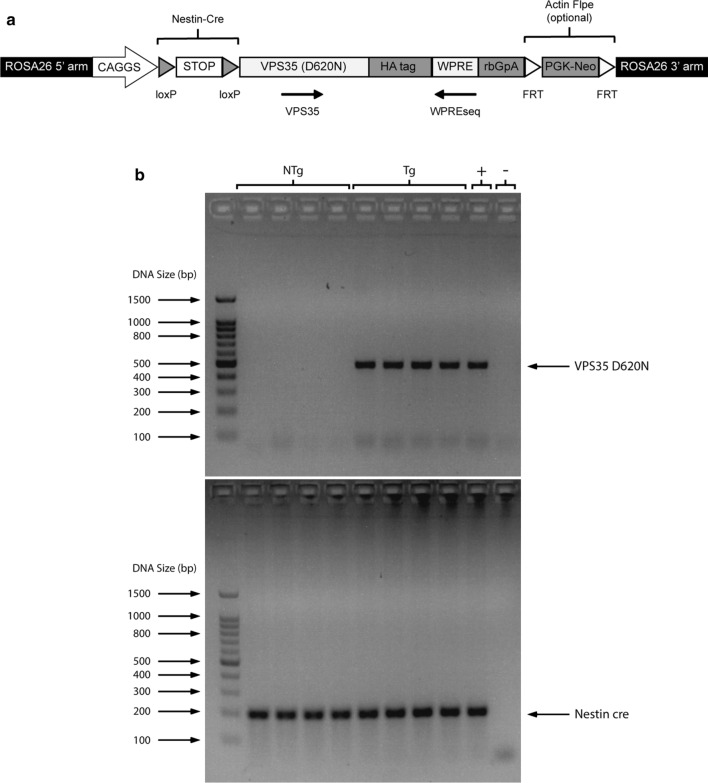
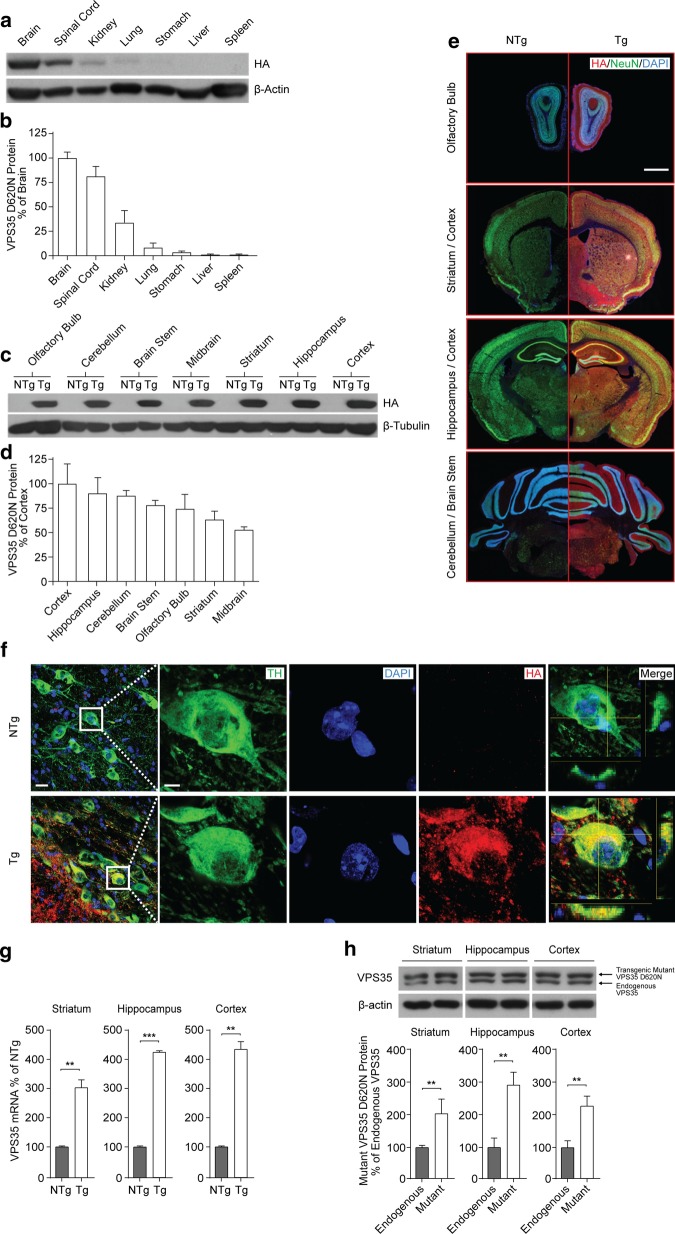
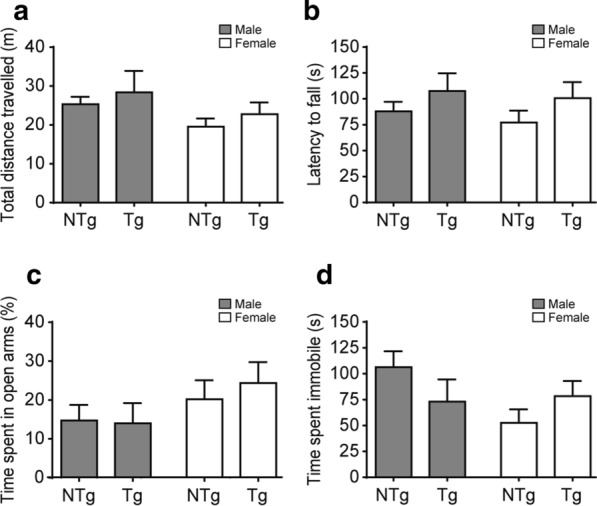
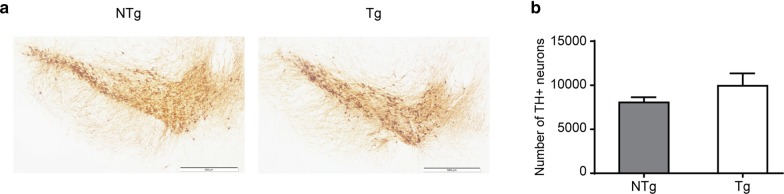
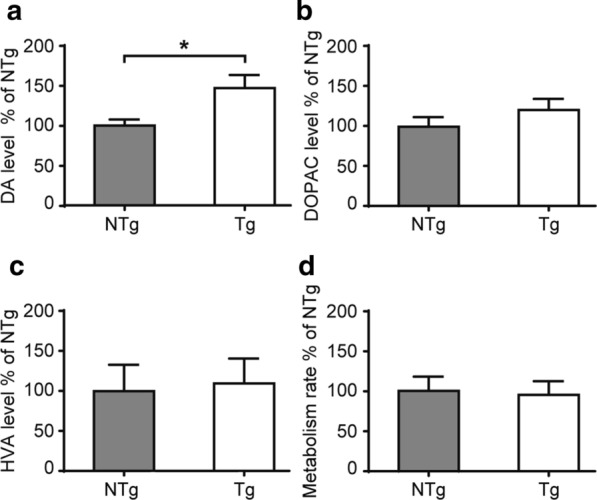
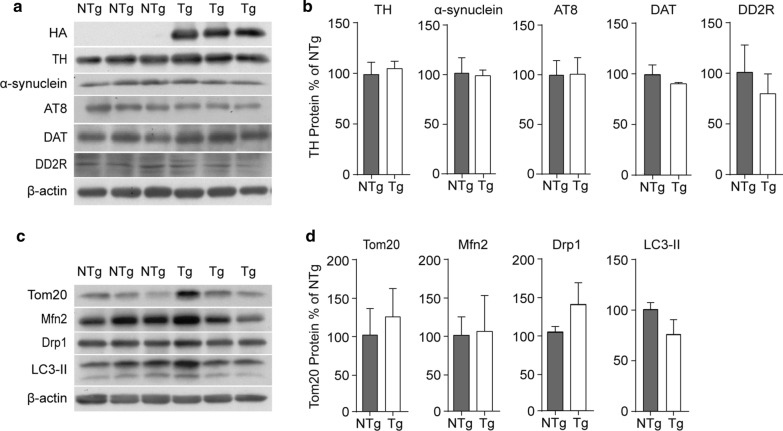
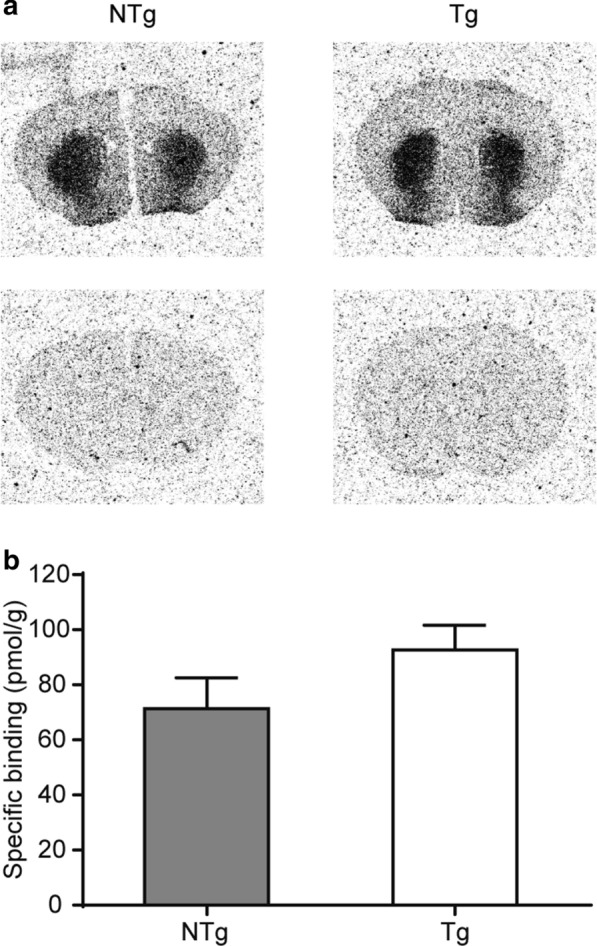
Vacuolar protein sorting 35 (VPS35) is a major component of the retromer complex that mediates the retrograde transport of cargo proteins from endosomes to the trans-Golgi network. Mutations such as D620N in the VPS35 gene have been identified in patients with autosomal dominant Parkinson's disease (PD). However, it remains poorly understood whether and how VPS35 deficiency or mutation contributes to PD pathogenesis; specifically, the studies that have examined VPS35 thus far have differed in results and methodologies. We generated a VPS35 D620N mouse model using a Rosa26-based transgene expression platform to allow expression in a spatial manner, so as to better address these discrepancies. Here, aged (20-months-old) mice were first subjected to behavioral tests. Subsequently, DAB staining analysis of substantia nigra (SN) dopaminergic neurons with the marker for tyrosine hydroxylase (TH) was performed. Next, HPLC was used to determine dopamine levels, along with levels of its two metabolites, 3,4-dihydroxyphenylacetic acid (DOPAC) and homovanillic acid (HVA), in the striatum. Western blotting was also performed to study the levels of key proteins associated with PD. Lastly, autoradiography (ARG) evaluation of [3H]FE-PE2I binding to the striatal dopamine transporter DAT was carried out. We found that VPS35 D620N Tg mice displayed a significantly higher dopamine level than NTg counterparts. All results were then compared with that of current VPS35 studies to shed light on the disease pathogenesis. Our model allows future studies to explicitly control spatial expression of the transgene which would generate a more reliable PD phenotype.

Keywords: Behavioral assay; Parkinson’s disease; Striatal dopamine; Transgenic mice; VPS35 D620N.


Conflict of interest statement

The authors declare that they have no competing interests.

Figures

Fig. 1
Fig. 1
Generation of VPS35 D620N Tg mice. a Construct design. The construct designed for VPS35 D620N mouse generation is inserted into the mouse Rosa26 locus under the control of an exogenous CAGGS promoter. A transcriptional termination signal sequence (flanked by two loxP sites) is present between the promoter and transgene coding sequence. Therefore, Cre recombinase is required to derepress the transgene via the excision of the transcriptional termination signal sequence. HA sequence was inserted. b PCR testing for VPS35 D620N. VPS35 D620N Tg mice and the positive control display a band at 525 bp, while NTg mice and the negative control do not. All mice are Nestin cre positive and display a band at 200 bp
Fig. 2
Fig. 2
Characterization of 20-months-old VPS35 D620N Tg mice. a VPS35 D620N is highly expressed in the CNS. Western blot analysis showed VPS35 D620N is abundantly expressed in the brain, spinal cord and, to a lesser extent, in the kidney, lung and stomach. No expression is observed in the liver or spleen. β-actin is included as a loading control. HA is used to detect VPS35 D620N. b Quantification of HA (VPS35 D620N). Expression levels are relative to brain. c VPS35 D620N expression in the various brain regions. From the western blot analysis, VPS35 D620N is determined to be expressed in the olfactory bulb, cerebellum, brainstem, midbrain, striatum, hippocampus, and cortex of Tg mice, while no expression is observed in NTg mouse brains. β-tubulin is included as a loading control. d Quantification of HA (VPS35 D620N). Expression levels are relative to cortex (most abundant). e Immunofluorescence analysis of NTg and Tg mouse brains. Red staining indicates HA (VPS35 D620N), green indicates NeuN, and blue indicates DAPI. VPS35 D620N is abundantly found in Tg mouse brains, specifically in the olfactory bulb, striatum, cortex, hippocampus, cerebellum, and brainstem, but is largely absent in NTg mouse brains. ×4 magnification. Scale bar 1 mm. f IHC analysis of TH and HA (VPS35 D620N) in dopaminergic neurons from SN. Green staining indicates TH, blue indicates DAPI, and red indicates HA (VPS35 D620N). There is an absence of HA (VPS35 D620N) in NTg mice, while TH and HA (VPS35 D620N) are colocalized in dopaminergic neurons from Tg mice. Column 1: ×60 magnification. Scale bar 20 μm. Columns 2–5: ×60 magnification. ×5 zoom. Scale bar 5 μm. g Evaluation of transgenic mutant VPS35 D620N and endogenous VPS35. QPCR analysis. VPS35 mRNA was extracted from the striatum, hippocampus and cortex of 20-months-old NTg and Tg mice, and quantified (normalized against NTg group). There was a significant increase in VPS35 mRNA in the Tg mice (n = 3) than in age-matched NTg counterparts (n = 3), across the striatum (P = 0.0067), hippocampus (P = 0.00029) and cortex (P = 0.00054); **p < 0.01, ***p < 0.001, Student’s t-test. h Western blot analysis. VPS35 protein from the striatum, hippocampus and cortex of 20-months-old Tg mice was analyzed. There were two VPS35 bands present for all Tg mice: endogenous VPS35 (lower band) and transgenic mutant VPS35 D620N (upper band). There was a significant increase in transgenic mutant VPS35 D620N compared to endogenous VPS35 across the striatum (P = 0.0014), hippocampus (P = 0.0012) and cortex (P = 0.0031); n = 6. **p < 0.01, Student’s t-test
Fig. 3
Fig. 3
Behavior analysis of 20-months-old VPS35 D620N Tg mice. a Open field test. The open field test measures levels of overall movement. There was no significant difference observed in the total distance travelled (m) (mean ± SEM) among all 4 groups: NTg Male (n = 14), Tg Male (n = 7), NTg Female (n = 12), and Tg Female (n = 12); two-way ANOVA with Bonferroni post hoc test. (NTg Male—Tg Male: P = 0.998, NTg Male—NTg Female: P = 0.390, Tg Male—Tg Female: P = 0.988, NTg Female—Tg Female: P = 0.517). b Rotarod test. The rotarod test assesses motor coordination ability. There was no significant difference observed in the latency to fall from the rotarod (s) (mean ± SEM) among all 4 groups: NTg male (n = 14), Tg male (n = 7), NTg Female (n = 12), and Tg Female (n = 14). (NTg male—Tg male: P = 0.975, NTg male—NTg Female: P = 0.708, Tg male—Tg Female: P = 0.991, NTg Female—Tg Female: P = 0.637). c Elevated plus maze. The elevated plus maze tests for anxiety. There was no significant difference observed in the percentage of time spent in the open arms (mean ± SEM), among all 4 groups: NTg male (n = 15), Tg male (n = 4), NTg Female (n = 10), and Tg Female (n = 13). (NTg male—Tg male: P = 0.999, NTg male—NTg female: P = 0.849, Tg male—Tg female: P = 0.693, NTg female—Tg female: P = 0.931). d Tail suspension test. The TST is a test for depression. There was no significant difference observed in the time spent immobile (s) (mean ± SEM), among all 4 groups: NTg male (n = 15), Tg male (n = 7), NTg female (n = 12), and Tg female (n = 13). (NTg male—Tg male: P = 0.542, NTg male—NTg female: P = 0.063, Tg male—Tg female: P = 0.997, NTg female—Tg female: P = 0.632)
Fig. 4
Fig. 4
Histology and stereological quantification of TH neurons in the substantia nigra (SN). a Representative images of TH-positive neurons in the NTg (left) and Tg (right) SN from 22-months-old mice. Anti-TH antibody was used for staining. ×10 magnification. Scale bar 500 µm. b Stereological counting of TH-positive neurons in the NTg and Tg mouse SN (mean ± SEM). 7 brain sections from each mouse were used for the unbiased stereological analysis. ×63 magnification. No significant difference (P = 0.136) in the number of TH-positive neurons in the SN was observed between NTg mice (n = 5) and Tg controls (n = 5); Student’s t-test
Fig. 5
Fig. 5
HPLC analysis of DA and its metabolites in the striatum of 22-months-old mice. a HPLC analysis of DA levels in the striatum normalized to the NTg group (mean ± SEM). DA levels were significantly (P = 0.028) higher in Tg mice (n = 7) than in age-matched NTg counterparts (n = 9); *p < 0.05, Student’s t-test. b HPLC analysis of DOPAC levels in the striatum normalized to the NTg group (mean ± SEM). DOPAC is a DA metabolite. No significant difference (P = 0.410) was observed in DOPAC levels between NTg (n = 9) and Tg mice (n = 7). c HPLC analysis of HVA levels in the striatum normalized to the NTg group (mean ± SEM). HVA is another metabolite of DA. No significant difference (P = 0.701) was observed in HVA levels between NTg (n = 5) and Tg mice (n = 6). d Metabolism rate normalized to the NTg group (mean ± SEM). The (DOPAC + HVA)/DA ratio is used as an indicator of the rate of DA turnover. There was no significant difference (P = 0.712) observed between NTg (n = 9) and Tg mice (n = 7). Student’s t-test
Fig. 6
Fig. 6
Western blot analysis of PD related proteins in the striatum. a Striatal samples from 22-months-old NTg mice (n = 3) and Tg mice (n = 3) were tested for a variety of PD associated proteins: TH, α-synuclein, Phosphor-Tau (AT8), DAT and DD2R by Western blot. β-actin was used as a loading control. b Quantification analysis of proteins detected (mean ± SEM). There was no significant difference in the relative expression of TH (P = 0.500), α-synuclein (P = 0.886), AT8 (P = 0.831), DAT (P = 0.407) and DD2R (P = 0.532). Student’s t-test. c Striatal samples were tested for the mitochondrial proteins Tom20, Mfn2 (Mitofusin-2), and Drp1, and the autophagy-related protein LC3-II by Western blot. β-actin was used as a loading control. d Quantification analysis of proteins detected (mean ± SEM). There was no significant difference in the relative expression of Tom20 (P = 0.662), Mfn2 (P = 0.927), Drp1 (P = 0.283) and LC3-II (P = 0.210). n = 3. Student’s t-test
Fig. 7
Fig. 7
ARG evaluation of [3H]FE-PE2I binding to DAT in the striatum. a DAT binding in striatum. [3H]FE-PE2I binds to DAT with high potency. This binding is inhibited by the DAT inhibitor GBR12909. Thus, in vitro ARG using radiolabeled analogues of PE2I provides detailed qualitative evidence of the binding to DAT. Here, ARG is performed on striatal sections of 22-months-old NTg and Tg mice. Images show total binding of the radiolabeled tracer [3H]FE-PE2I (upper panel), and nonspecific binding in adjacent brain sections that were co-incubated in the presence of GBR12909 (lower panel). b Quantitative analysis of the radioactivity level in the striatum of DAT binding (pmol/g) between NTg and Tg mice (mean ± SEM). There was no significant difference (P = 0.216) in striatal DAT binding between NTg and Tg mice. n = 3. Student’s t-test

Similar articles

Cited by

References

    1. DeMaagd G, Philip A. Parkinson's disease and its management: part 1: disease entity, risk factors, pathophysiology, clinical presentation, and diagnosis. P T. 2015;40(8):504–532. - PMC - PubMed
    1. Rizzo G, Copetti M, Arcuti S, Martino D, Fontana A, Logroscino G. Accuracy of clinical diagnosis of Parkinson disease: a systematic review and meta-analysis. Neurology. 2016;86(6):566–576. doi: 10.1212/WNL.0000000000002350. - DOI - PubMed
    1. Reichmann H, Brandt MD, Klingelhoefer L. The nonmotor features of Parkinson's disease: pathophysiology and management advances. Curr Opin Neurol. 2016;29(4):467–473. doi: 10.1097/WCO.0000000000000348. - DOI - PubMed
    1. Williams ET, Moore DJ. Deciphering the role of VPS35 in Parkinson's disease. J Neurosci Res. 2018;96(8):1339–1340. doi: 10.1002/jnr.24262. - DOI - PMC - PubMed
    1. Wang HS, Toh J, Ho P, Tio M, Zhao Y, Tan EK. In vivo evidence of pathogenicity of VPS35 mutations in the Drosophila. Mol Brain. 2014;7:73. doi: 10.1186/s13041-014-0073-y. - DOI - PMC - PubMed

Publication types

Substances