

Intrafamilial Exposure to SARS-CoV-2 Associated with Cellular Immune Response without Seroconversion, France
- PMID: 33261718
- PMCID: PMC7774579
- DOI: 10.3201/eid2701.203611
Intrafamilial Exposure to SARS-CoV-2 Associated with Cellular Immune Response without Seroconversion, France
Abstract
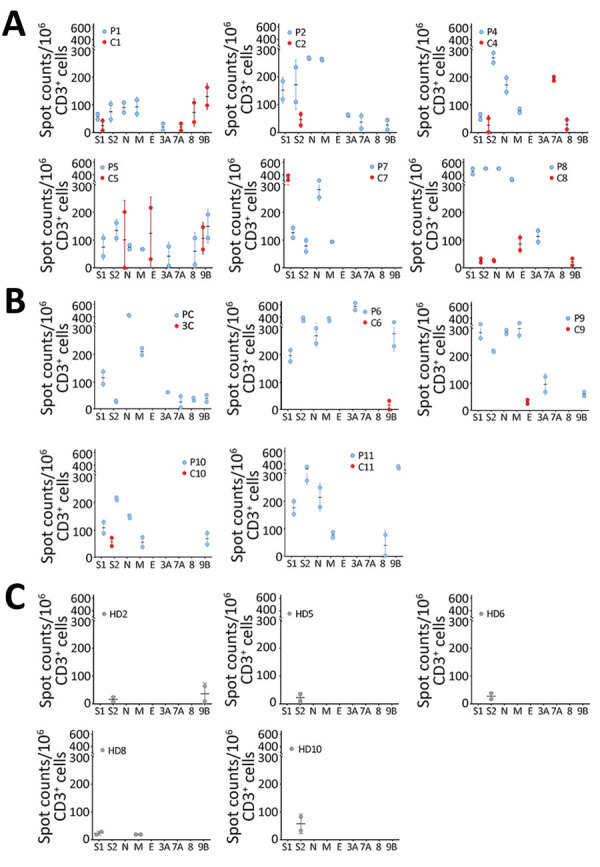
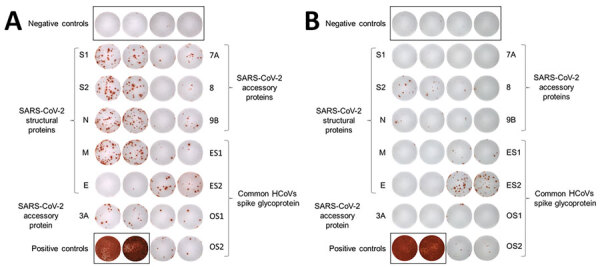
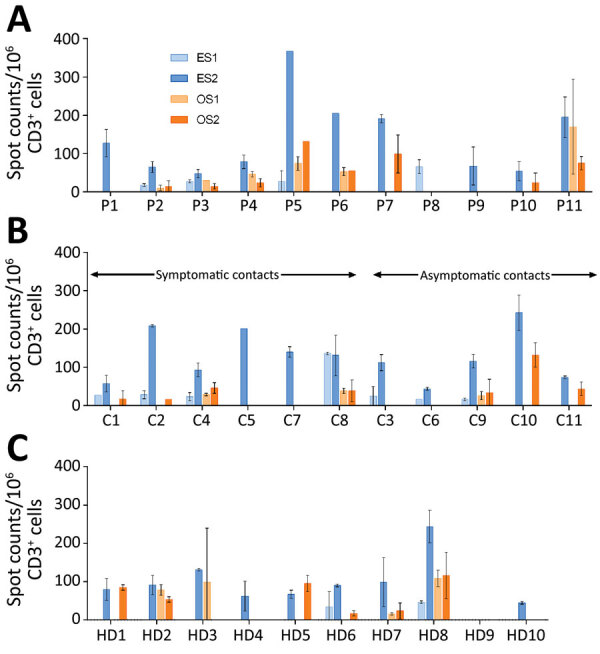
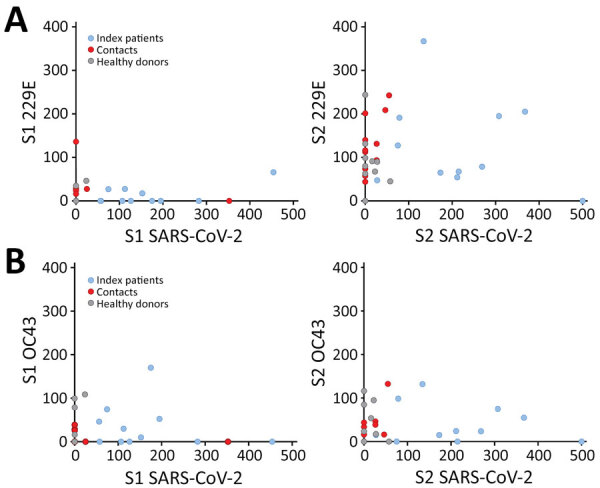
We investigated severe acute respiratory syndrome coronavirus 2 (SARS-CoV-2)-specific antibodies and T-cell responses against SARS-CoV-2 and human coronavirus (HCoV) 229E and OC43 in 11 SARS-CoV-2 serodiscordant couples in Strausbourg, France, in which 1 partner had evidence of mild coronavirus disease (COVID-19) and in 10 unexposed healthy controls. Patients with confirmed COVID-19 were considered index patients and their partners close contacts. All index patients displayed positive SARS-CoV-2-specific antibody and T-cell responses that lasted up to 102 days after symptom onset. All contacts remained seronegative for SARS-CoV-2; however, 6 reported COVID-19 symptoms within a median of 7 days after their partners, and 4 of those showed a positive SARS-CoV-2-specific T-cell response against 3 or 4 SARS-CoV-2 antigens that lasted up to 93 days after symptom onset. The 11 couples and controls displayed positive T-cell responses against HCoV-229E or HCoV-OC43. These data suggest that exposure to SARS-CoV-2 can induce virus-specific T-cell responses without seroconversion.
Trial registration: ClinicalTrials.gov NCT04405726.
Keywords: COVID-19; IgA; IgG; IgM; RT-PCR; SARS-CoV-2; antibodies; coronavirus disease; coronavirus symptoms; household exposure; interferon; intrafamilial contacts; serologic testing; severe acute respiratory syndrome coronavirus 2; viral-specific T-cell response.
Figures
Similar articles
-
Human Milk Antibodies Against S1 and S2 Subunits from SARS-CoV-2, HCoV-OC43, and HCoV-229E in Mothers with A Confirmed COVID-19 PCR, Viral SYMPTOMS, and Unexposed Mothers.Int J Mol Sci. 2021 Feb 9;22(4):1749. doi: 10.3390/ijms22041749. Int J Mol Sci. 2021. PMID: 33572480 Free PMC article.
-
Prospective Assessment of SARS-CoV-2 Seroconversion (PASS) study: an observational cohort study of SARS-CoV-2 infection and vaccination in healthcare workers.BMC Infect Dis. 2021 Jun 9;21(1):544. doi: 10.1186/s12879-021-06233-1. BMC Infect Dis. 2021. PMID: 34107889 Free PMC article.
-
Cellular Immunity in COVID-19 Convalescents with PCR-Confirmed Infection but with Undetectable SARS-CoV-2-Specific IgG.Emerg Infect Dis. 2021 Jan;27(1). doi: 10.3201/2701.203772. Epub 2020 Oct 15. Emerg Infect Dis. 2021. PMID: 33058753
-
[SARS-CoV-2 and Microbiological Diagnostic Dynamics in COVID-19 Pandemic].Mikrobiyol Bul. 2020 Jul;54(3):497-509. doi: 10.5578/mb.69839. Mikrobiyol Bul. 2020. PMID: 32755524 Review. Turkish.
-
Review of risk of COVID-19 in cancer patients and their cohabitants.Int J Infect Dis. 2021 Apr;105:15-20. doi: 10.1016/j.ijid.2021.01.072. Epub 2021 Feb 5. Int J Infect Dis. 2021. PMID: 33556611 Free PMC article. Review.
Cited by
-
Limited cross-species transmission and absence of mutations associated with SARS-CoV-2 adaptation in cats: A case study of infection in a small household setting.Transbound Emerg Dis. 2022 May;69(3):1606-1616. doi: 10.1111/tbed.14132. Epub 2021 May 16. Transbound Emerg Dis. 2022. PMID: 33908152 Free PMC article.
-
Robust T Cell Response Toward Spike, Membrane, and Nucleocapsid SARS-CoV-2 Proteins Is Not Associated with Recovery in Critical COVID-19 Patients.Cell Rep Med. 2020 Sep 22;1(6):100092. doi: 10.1016/j.xcrm.2020.100092. Epub 2020 Aug 29. Cell Rep Med. 2020. PMID: 32904468 Free PMC article.
-
Microarray-Based Analyses of Rhinovirus Species-Specific Antibody Responses in Exacerbated Pediatric Asthma in a German Pediatric Cohort.Viruses. 2022 Aug 24;14(9):1857. doi: 10.3390/v14091857. Viruses. 2022. PMID: 36146664 Free PMC article.
-
Machine-Learning-Assisted Analysis of TCR Profiling Data Unveils Cross-Reactivity between SARS-CoV-2 and a Wide Spectrum of Pathogens and Other Diseases.Biology (Basel). 2022 Oct 19;11(10):1531. doi: 10.3390/biology11101531. Biology (Basel). 2022. PMID: 36290433 Free PMC article.
-
Long-term humoral and cellular immunity after primary SARS-CoV-2 infection: a 20-month longitudinal study.BMC Immunol. 2023 Nov 16;24(1):45. doi: 10.1186/s12865-023-00583-y. BMC Immunol. 2023. PMID: 37974069 Free PMC article.
References
MeSH terms
Substances
Associated data
LinkOut - more resources
Full Text Sources
Other Literature Sources
Medical
Miscellaneous
