. 2020 Dec 1;5(6):e01127-20.
doi: 10.1128/mSystems.01127-20.

PerSort Facilitates Characterization and Elimination of Persister Subpopulation in Mycobacteria

Affiliations

PerSort Facilitates Characterization and Elimination of Persister Subpopulation in Mycobacteria

Vivek Srinivas et al. mSystems. .

Abstract

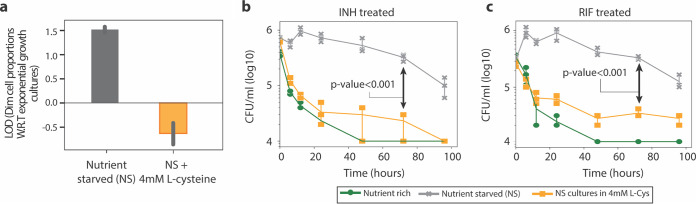
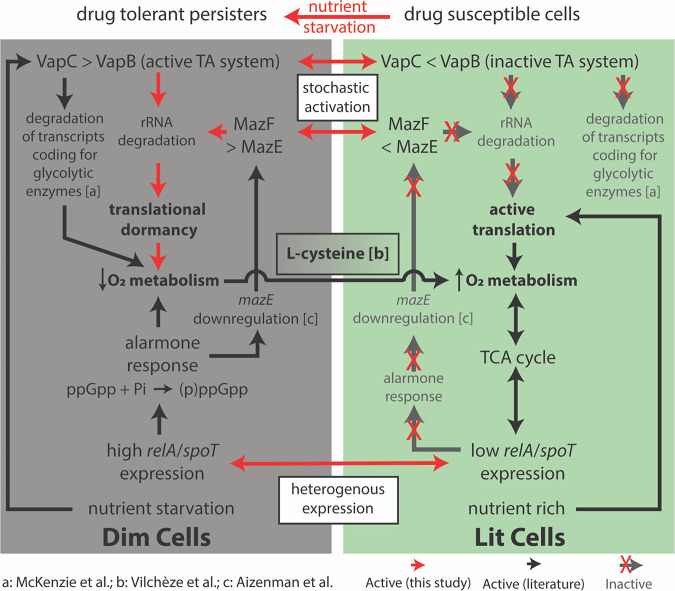
Mycobacterium tuberculosis (MTB) generates phenotypic diversity to persist and survive the harsh conditions encountered during infection. MTB avoids immune effectors and antibacterial killing by entering into distinct physiological states. The surviving cells, persisters, are a major barrier to the timely and relapse-free treatment of tuberculosis (TB). We present for the first time, PerSort, a method to isolate and characterize persisters in the absence of antibiotic or other pressure. We demonstrate the value of PerSort to isolate translationally dormant cells that preexisted in small numbers within Mycobacterium species cultures growing under optimal conditions but that dramatically increased in proportion under stress conditions. The translationally dormant subpopulation exhibited multidrug tolerance and regrowth properties consistent with those of persister cells. Furthermore, PerSort enabled single-cell transcriptional profiling that provided evidence that the translationally dormant persisters were generated through a variety of mechanisms, including vapC30, mazF, and relA/spoT overexpression. Finally, we demonstrate that notwithstanding the varied mechanisms by which the persister cells were generated, they converge on a similar low-oxygen metabolic state that was reversed through activation of respiration to rapidly eliminate persisters fostered under host-relevant stress conditions. We conclude that PerSort provides a new tool to study MTB persisters, enabling targeted strategies to improve and shorten the treatment of TB.IMPORTANCE Mycobacterium tuberculosis (MTB) persists and survives antibiotic treatments by generating phenotypically heterogeneous drug-tolerant subpopulations. The surviving cells, persisters, are a major barrier to the relapse-free treatment of tuberculosis (TB), which is already killing >1.8 million people every year and becoming deadlier with the emergence of multidrug-resistant strains. This study describes PerSort, a cell sorting method to isolate and characterize, without antibiotic treatment, translationally dormant persisters that preexist in small numbers within Mycobacterium cultures. Characterization of this subpopulation has discovered multiple mechanisms by which mycobacterial persisters emerge and unveiled the physiological basis for their dormant and multidrug-tolerant physiological state. This analysis has discovered that activating oxygen respiratory physiology using l-cysteine eliminates preexisting persister subpopulations, potentiating rapid antibiotic killing of mycobacteria under host-relevant stress. PerSort serves as a new tool to study MTB persisters for enabling targeted strategies to improve and shorten the treatment of TB.

Keywords: Mycobacterium; antibiotic tolerance; nutrient starvation; persisters; phenotypic heterogeneity.


Figures

FIG 1
FIG 1
Time-kill curves and growth characteristics of M. smegmatis from nutrient-rich and nutrient-starved conditions. (a and b) Time-kill curves of MSM cultures grown in nutrient-rich (NR) or nutrient-starved (NS) conditions treated with 5× MIC isoniazid (INH) (a) or 5× MIC rifampicin (RIF) (b). The solid lines indicate experimentally observed time-kill curves. The dashed and dotted lines distinguish the slopes of the susceptible and tolerant subpopulations, respectively. Data points are from three experimental replicates; error bars were calculated by measuring standard deviation between replicates. The limit of quantification for reporting growth was 103 CFU/ml. (c) ScanLag analysis showing time of appearance (TOA) of cultures grown in NR and NS conditions. Error bars within the violin plot are standard deviations with a confidence interval of 0.9. The dashed lines indicate the mean TOA from cultures grown in NR or NS conditions. Mean CFU/ml at 72 h and TOA between NS and NR conditions were compared with Student’s t test.
FIG 2
FIG 2
PerSort isolation and characterization of subpopulations from anhydrotetracycline (ATc)-induced MSM-mEos2 cultures. (a, top) Population structure of ATc-induced (500 ng/ml) MSM-mEos2 cells from single-cell gates, represented by mEos2 fluorescence on the x axis and propidium iodide (PI) (5 μl/ml) fluorescence on the y axis. Polygons indicate the gates for nonculturable cells [PI(+)], dim cells, and lit cells with the proportion of cells in that particular gate. (Bottom) Cumulative distribution of mEos2 florescence intensity in MSM-mEos2 cells, dashed lines indicate boundaries of sort gates for dim, lit, and unselected PI(-) cells. (b) Cultivability of PerSorted dim, lit, and PI(-) cells from ATc-induced MSM-mEos2 cultures. The percent cultivable cells was calculated from the number of CFU from 200 sorted cells. Experiments were performed in triplicates, and error bars represent the standard deviation between replicates. Significance of cultivability difference between dim, lit, and nonculturable subpopulations was calculated with Student’s t test. (c) ScanLag analysis of dim, unselected PI(-), and lit cells from PerSorted MSM-mEos2 cultures induced with ATc (500 ng/ml). The dashed lines in the violin plot indicate mean TOA of the sorted subpopulations. Error bars within the violin plot are standard deviations with a confidence interval of 0.9. (d and e) Percent survival of 5× MIC INH or 5× MIC RIF treatment of PerSorted dim and lit cells of MSM-mEos2 cultures induced with ATc (500 ng/ml), compared to percent survival of whole populations (i.e., unsorted) of MSM-mEos2 induced with ATc (500 ng/ml) and grown in nutrient-rich and starved conditions. Experiments were performed in triplicates, and error bars represent the standard deviation between replicates. Significance of survival between dim and lit subpopulations was calculated with Student’s t test.
FIG 3
FIG 3
Regrowth dynamics of PerSorted dim and lit cells and population structure under nutrient-rich versus nutrient-starved conditions. (a) Dim and lit cell proportions in cultures regrown from PerSorted dim and lit populations obtained from ATc-induced MSM-mEos2 cultures. The proportions of cells in each subpopulation were measured from the gating methods described in the legend to Fig. 2a. (b and c) Lag phase and maximum growth rate were calculated from OD600 absorbance measurements of dim and lit cells PerSorted into 7H9 medium. Error bars were calculated by measuring standard deviations in the lag phase and maximum growth rates between dim and lit cells (n = 100,000). Significance of differences between dim and lit subpopulations was calculated with Student’s t test. (d) Population structure of ATc-induced MSM-mEos2 cultures grown in nutrient-rich (green) and nutrient-starved (gray) conditions. (e) A model describing the formation of dim cells under nutrient-rich and nutrient-starved conditions in mycobacterium. The probability of dim cell formation was calculated from their relative proportion in the indicated culture conditions.
FIG 4
FIG 4
Single-cell gene expression and ROS levels from PerSorted single dim and lit cells. (a) Single-cell expression of key persister genes from clusters of dim cells identified from hierarchical clustering. The clusters were defined by their increased expression of specific persister genes. Other cells are single lit cells that do not form gene-specific clusters. The log2 ΔΔCT (or ratio) is shown on the y axis. P values were calculated with Student’s t test between clusters of cells. (b) qRT-PCR measurement of 16S rRNA, 23S rRNA, and phosphoglucoisomerase (PGI) (MSMEG_5541) levels in PerSorted dim and lit cells (n = 300 cells). Error bars were calculated by measuring standard deviations of gene expression. P values were calculated with Student’s t test between the dim and lit cells. (c) Reactive oxygen species (ROS) levels, measured with CellRox, of ATc-induced MSM-mEos2 cultures grown in nutrient-rich conditions and PerSorted into dim and lit subpopulations. ROS was quenched with N-acetyl cysteine and induced with MnTBAP and used as reference controls. Significance of ROS levels between dim and lit subpopulations was calculated by Kolmogorov-Smirnov (K-S) test (K-S statistics of CellRox orange intensity between dim and lit population; K-S max difference, 56.1%, K-S max at intensity, 14.8551, K-S probability, >99.9%). w.r.t, with respect to.
FIG 5
FIG 5
Dim cell proportion and time-kill curves upon l-cysteine addition to nutrient-starved M. smegmatis. (a) Proportion of dim cells in MSM-mEos2 cultures grown in nutrient-starved conditions with or without the addition of 4 mM l-cysteine. Dim cell proportions (log 10) under each condition were calculated with respect to MSM-mEos2 cultures grown in naive conditions. Error bars were calculated by measuring standard deviations in dim cell proportions between 10 PerSort replicates. (b and c) Time-kill curves of MSM cultures grown in nutrient-starved conditions with 4 mM l-cysteine and treated with 5× MIC INH (b) or 5× MIC RIF (c). Time-kill curve data for nutrient-rich and nutrient-starved conditions (no l-cysteine) are from Fig. 1. Data points are averaged from three independent experiments, and error bars represent the standard deviations between replicates. The limit of quantification for reporting growth was 103 CFU/ml. Mean CFU/ml at 72 h between l-cysteine-treated and untreated cultures in nutrient-starved conditions were compared with Student's t test. LOD, log difference; W.R.T, with respect to.
FIG 6
FIG 6
The persister subpopulation converges on a low-O2 metabolic state, which was exploited by addition of l-cysteine to convert the subpopulation to drug-susceptible cells. The diagram depicts the processes driving dim (multidrug-tolerant persisters) and lit (drug-susceptible) cell formation, as discovered through single-cell expression analysis. Evidence from the literature further connects these various mechanisms to the O2 respiratory state of either dim or lit cells. Red arrows indicate connections identified in this study, black arrows are previously determined connections from the literature (references indicated), and white boxes are proposed mechanisms for persister cell formation. The references from the literature indicated in the figure are McKenzie et al. (44), Vilchèze et al. (46), and Aizenman et al. (41).

Similar articles

Cited by

References

    1. Philippi T, Seger J. 1989. Hedging one’s evolutionary bets, revisited. Trends Ecol Evol 4:41–44. doi:10.1016/0169-5347(89)90138-9. - DOI - PubMed
    1. Tuberculosis Coalition for Technical Assistance. 2006. International Standards for Tuberculosis Care (ISTC). Tuberculosis Coalition for Technical Assistance, The Hague, Netherlands.
    1. Sarathy JP, Via LE, Weiner D, Blanc L, Boshoff H, Eugenin EA, Barry CE, Dartois VA. 2018. Extreme drug tolerance of Mycobacterium tuberculosis in caseum. Antimicrob Agents Chemother 62:e02266-17. doi:10.1128/AAC.02266-17. - DOI - PMC - PubMed
    1. Chaulk CP, Kazandjian VA. 1998. Directly observed therapy for treatment completion of pulmonary tuberculosis: consensus statement of the Public Health Tuberculosis Guidelines Panel. JAMA 279:943–948. doi:10.1001/jama.279.12.943. - DOI - PubMed
    1. Manina G, Dhar N, McKinney JD. 2015. Stress and host immunity amplify Mycobacterium tuberculosis phenotypic heterogeneity and induce nongrowing metabolically active forms. Cell Host Microbe 17:32–46. doi:10.1016/j.chom.2014.11.016. - DOI - PubMed