. 2020 Dec 1;11(6):e02675-20.
doi: 10.1128/mBio.02675-20.

Production of Noncapped Genomic RNAs Is Critical to Sindbis Virus Disease and Pathogenicity

Affiliations

Production of Noncapped Genomic RNAs Is Critical to Sindbis Virus Disease and Pathogenicity

Autumn T LaPointe et al. mBio. .

Abstract

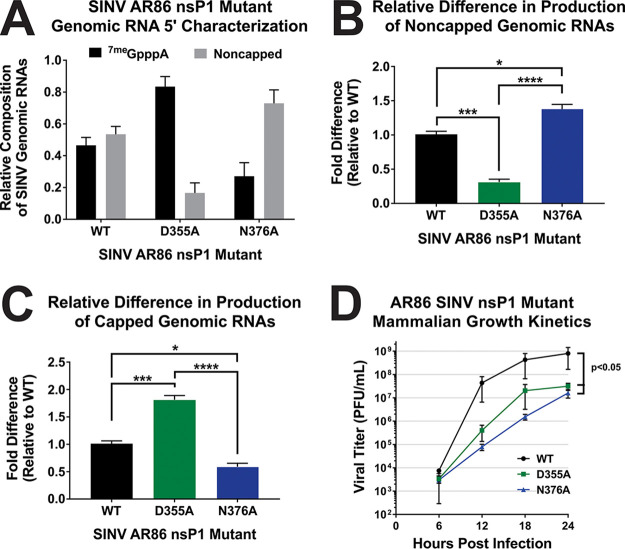
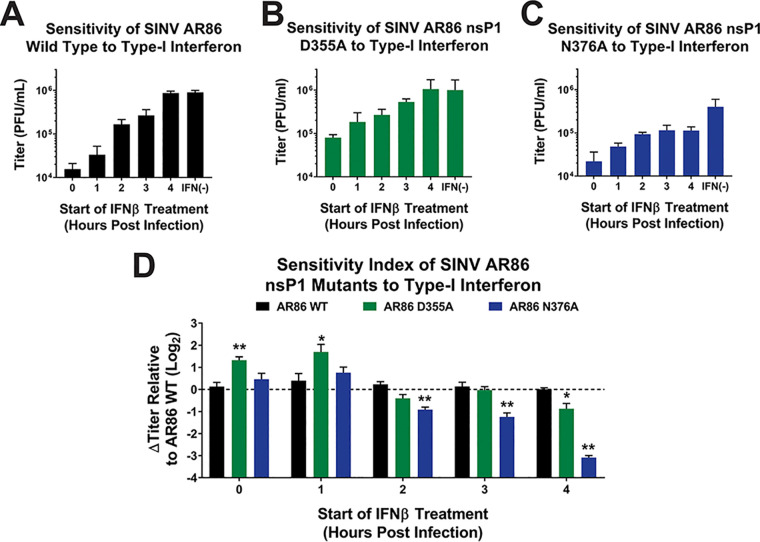
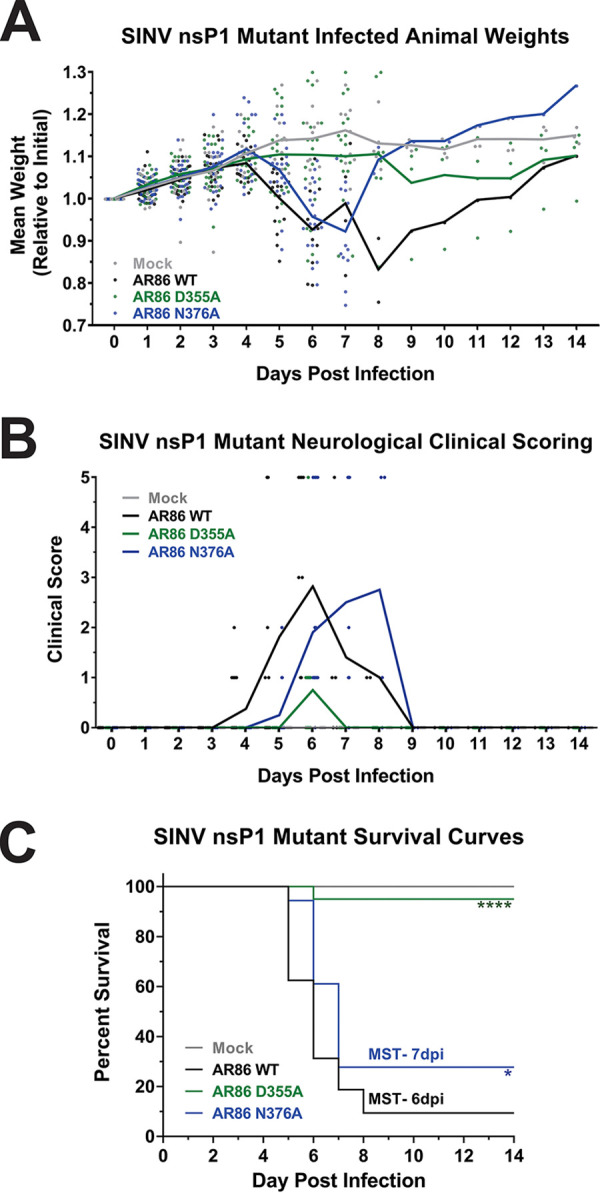
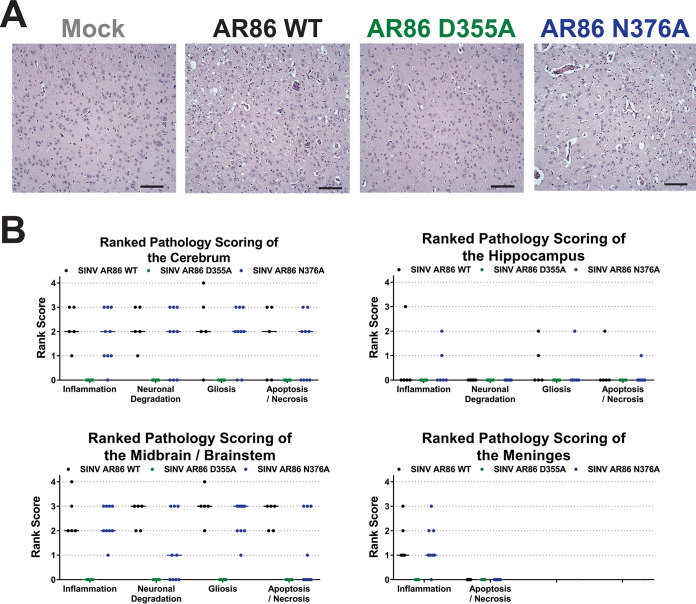
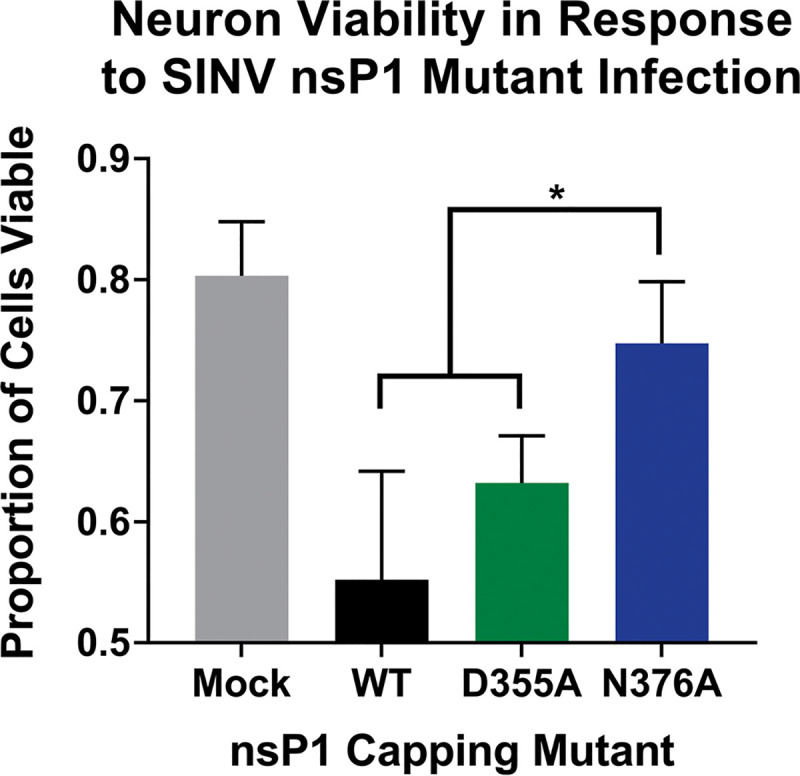
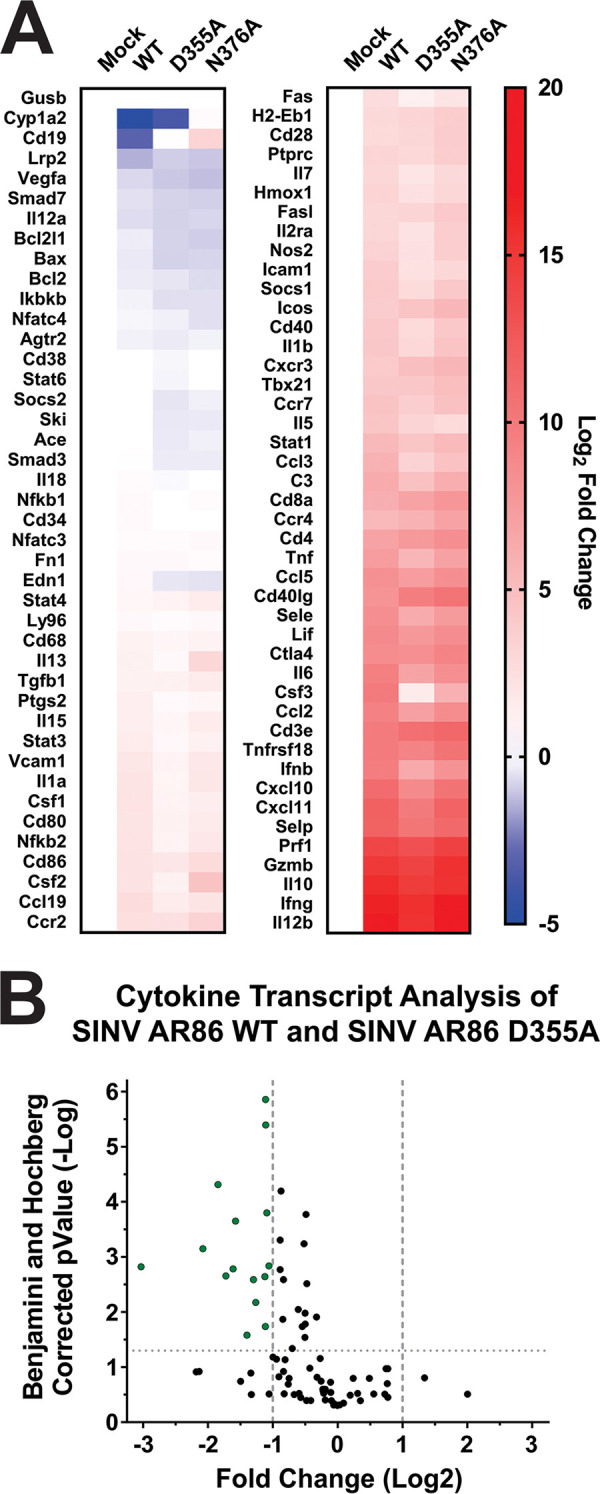
Alphaviruses are positive-sense RNA viruses that utilize a 5' cap structure to facilitate translation of viral proteins and to protect the viral RNA genome. Nonetheless, significant quantities of viral genomic RNAs that lack a canonical 5' cap structure are produced during alphaviral replication and packaged into viral particles. However, the role/impact of the noncapped genomic RNA (ncgRNA) during alphaviral infection in vivo has yet to be characterized. To determine the importance of the ncgRNA in vivo, the previously described D355A and N376A nsP1 mutations, which increase or decrease nsP1 capping activity, respectively, were incorporated into the neurovirulent AR86 strain of Sindbis virus to enable characterization of the impact of altered capping efficiency in a murine model of infection. Mice infected with the N376A nsP1 mutant exhibited slightly decreased rates of mortality and delayed weight loss and neurological symptoms, although levels of inflammation in the brain were similar to those of wild-type infection. Although the D355A mutation resulted in decreased antiviral gene expression and increased resistance to interferon in vitro, mice infected with the D355A mutant showed significantly reduced mortality and morbidity compared to mice infected with wild-type virus. Interestingly, expression of proinflammatory cytokines was found to be significantly decreased in mice infected with the D355A mutant, suggesting that capping efficiency and the production of ncgRNA are vital to eliciting pathogenic levels of inflammation. Collectively, these data indicate that the ncgRNA have important roles during alphaviral infection and suggest a novel mechanism by which noncapped viral RNAs aid in viral pathogenesis.IMPORTANCE Mosquito-transmitted alphaviruses have been the cause of widespread outbreaks of disease that can range from mild illness to lethal encephalitis or severe polyarthritis. There are currently no safe and effective vaccines or therapeutics with which to prevent or treat alphaviral disease, highlighting the need to better understand alphaviral pathogenesis to develop novel antiviral strategies. This report reveals production of noncapped genomic RNAs (ncgRNAs) to be a novel determinant of alphaviral virulence and offers insight into the importance of inflammation to pathogenesis. Taken together, the findings reported here suggest that the ncgRNAs contribute to alphaviral pathogenesis through the sensing of the ncgRNAs during alphaviral infection and are necessary for the development of severe disease.

Keywords: RNA virus; alphavirus; capping; nsP1; viral pathogenesis.


Figures

FIG 1
FIG 1
Point mutations in nsP1 of AR86 SINV result in changes in capping efficiency and negatively impact infection in mammalian cells. (A) Quantitative assessment of SINV RNAs produced during infection of BHK-21 cells with either wild-type (WT) SINV or either of the nsP1 mutants at an MOI of 5 PFU/cell. RNA was collected at 16 hpi and treated as described in Materials and Methods. Graphs depict the relative quantities of noncapped (B) or capped (C) genomic RNAs produced during infection of BHK-21 cells with wild-type SINV or either of the nsP1 mutants at 16 hpi. (D) One-step growth kinetics of the individual capping mutants and the parental wild-type SINV in BHK-21 cells infected at an MOI of 5 PFU/cell. All the quantitative data shown represent means of results from three independent biological replicates, with error bars representing standard deviations of the means. Statistical significance was determined by analysis of the area under the curve. *, P < 0.05; **, P < 0.01; ***, P < 0.001; ****, P < 0.0001.
FIG 2
FIG 2
Increasing capping efficiency increases translation of SINV AR86 nonstructural polyprotein. (A) BHK-21 cells were infected with either wild-type SINV or one of the nsP1 capping mutants at an MOI of 5 PFU/cell. Abundance of nsP2 was then assessed at 8 hpi by Western blotting. ▴, Nonstructural polyprotein band. ■, p23 polyprotein intermediate band (as determined by molecular weight). ●, Fully processed nsP2 band. Actin is shown as the loading control. (B to D) Densitometric quantification of fully processed nsP2 protein (B), nonstructural polyprotein (C), and total nsP2 signal (D) normalized to actin levels at 8 hpi. All the quantitative data shown represent means of results from three independent biological replicates, with error bars representing standard deviations of the means. Statistical significance was determined using Student's t test.
FIG 3
FIG 3
Altering capping efficiency does not impact AR86 SINV vRNA synthesis. BHK-21 cells were infected with either wild-type SINV or one of the nsP1 capping mutants at an MOI of 5 PFU/cell. Absolute quantities of the genomic, subgenomic, and minus-strand vRNAs produced at 4 (A), 8 (B), and 16 (C) hpi were determined by qRT-PCR. All the quantitative data shown represent means of results from three independent biological replicates, with error bars representing standard deviations of the means. Statistical significance was determined using Student's t test.
FIG 4
FIG 4
Production of type I interferon and ISGs in response to SINV nsP1 capping mutants. L929 cells were infected at an MOI of 10 PFU/cell with either wild-type SINV or an individual capping mutant. Cell lysates were collected at 6, 8, 16, and 24 hpi, and transcript expression levels for IFN-β (A) and the selected ISGs (B to E) were determined by qRT-PCR for their respective times postinfection. Data were normalized to GAPDH and nsP1 and calculated relative to uninfected controls. All the quantitative data shown represent means of results from three independent biological replicates, with error bars representing standard deviations of the means. Statistical significance was determined by Student's t test.
FIG 5
FIG 5
Analysis of SINV sensitivity to type I interferon. L929 cells were infected with either wild-type SINV or an individual capping mutant at an MOI of 10 PFU/cell. At the indicated times postinfection, 20 IU of recombinant type I IFN was added to the growth medium, and the cells were incubated for a period of 24 h. (A to C) Viral titers were quantified via plaque assay. (D) The relative sensitivity of the viruses was determined by comparing their growth to that of untreated controls. All the quantitative data shown represent means of results from three independent biological replicates, with error bars representing standard deviations of the means. Statistical significance was determined by Student's t test. *, P < 0.05. **, P < 0.01.
FIG 6
FIG 6
Increased vRNA capping efficiency reduces SINV AR86 mortality and pathogenesis. Four-week-old male and female C57BL/6J mice were either mock infected or infected with 1,000 PFU of SINV AR86 wild type, D355A, or N376A via rear footpad subcutaneous inoculation. Each data point represents a single animal from either experimental replicate. The experimentally infected mice were assessed over a 14-day period. (A) Animals were weighed twice daily. Weights are shown relative to initial weight after being infected. (B) Mice were scored based on a 1 to 5 scale for neurological response. (C) Kaplan-Meier analysis indicates the WT median survival time (MST) at ∼6.4 days and the N376A mutant MST at ∼7 days. The P values indicated were determined by the log rank test. *, P < 0.05; ****, P < 0.0001. Data shown were pooled from 2 independent experiments.
FIG 7
FIG 7
Increased capping efficiency leads to decreased pathology in the brain. (A) Representative H&E-stained sagittal sections of the midbrain (×20 magnification) from mock-, wild-type-, or capping mutant-infected mice at 7 dpi or at the time at which endpoint criteria were met. The brains of SINV wild-type- and N376A-infected mice show large amounts of perivascular cuffing, immune infiltration, and cell death not present in the mock- and D355A-infected mice. Scale bar, 0.1 mm. (B) Ranked pathology scoring of indicated sections of the brain from infected mice. Data points indicate scoring for each experimental animal, representing at least 5 biological replicates.
FIG 8
FIG 8
Viral replication is largely unaffected by altered capping in vivo. (A to C) Tissues were harvested at the indicated times postinfection, and viral titer was determined via plaque assay. (D) Viral genomes were measured by qRT-PCR. The data points indicate the individual titers for each experimental animal, and the mean values shown are the geometric means of at least four biological replicates from two independent experiments, with the error bars representing the geometric standard deviations of the means. ▲, Mice that met endpoint criteria prior to day 7. Statistical significance was determined using Student's t test.
FIG 9
FIG 9
Neuron viability increased with decreased capping efficiency. SK-N-BE(2) neurons were infected at an MOI of 30 PFU/cell with either wild-type SINV or an individual capping mutant. Cell viability was determined at 24 hpi using ethidium bromide/acridine orange staining and is represented as the proportion of viable cells out of total cells counted. A minimum of 100 total cells per well were counted using ImageJ. All the quantitative data shown represent means of results from three independent biological replicates, with error bars representing standard deviations of the means. Statistical significance was determined by Student's t test.
FIG 10
FIG 10
Increased viral capping efficiency results in reduced expression of proinflammatory genes in the brain. (A) Cytokine transcript levels in the brain at 7 dpi were measured by qRT-PCR. Data were normalized to GAPDH and calculated relative to uninfected controls. (B) Volcano plot showing the fold change in transcript expression between wild-type SINV and the D355A mutant. Green points are transcripts that have greater than a 2-fold change in expression and are significant according to the Benjamini and Hochberg-corrected P value. (C) Cytokines and chemokines whose expression was significantly increased compared to that of uninfected controls and exhibited a significant difference in expression between wild-type SINV and the D355A mutant was greater than 2-fold. All the quantitative data shown represent means of results from at least three independent biological replicates, with center lines representing the median, plus signs representing the mean, boxes representing the interquartile range, error bars representing standard deviation of the means, and filled circles representing outliers, as determined by Tukey’s method. Statistical significance was determined by Student's t test.
FIG 10
FIG 10
Increased viral capping efficiency results in reduced expression of proinflammatory genes in the brain. (A) Cytokine transcript levels in the brain at 7 dpi were measured by qRT-PCR. Data were normalized to GAPDH and calculated relative to uninfected controls. (B) Volcano plot showing the fold change in transcript expression between wild-type SINV and the D355A mutant. Green points are transcripts that have greater than a 2-fold change in expression and are significant according to the Benjamini and Hochberg-corrected P value. (C) Cytokines and chemokines whose expression was significantly increased compared to that of uninfected controls and exhibited a significant difference in expression between wild-type SINV and the D355A mutant was greater than 2-fold. All the quantitative data shown represent means of results from at least three independent biological replicates, with center lines representing the median, plus signs representing the mean, boxes representing the interquartile range, error bars representing standard deviation of the means, and filled circles representing outliers, as determined by Tukey’s method. Statistical significance was determined by Student's t test.

References

    1. Sissoko D, Malvy D, Ezzedine K, Renault P, Moscetti F, Ledrans M, Pierre V. 2009. Post-epidemic Chikungunya disease on Reunion Island: course of rheumatic manifestations and associated factors over a 15-month period. PLoS Negl Trop Dis 3:e389. doi:10.1371/journal.pntd.0000389. - DOI - PMC - PubMed
    1. Schwartz O, Albert ML. 2010. Biology and pathogenesis of chikungunya virus. Nat Rev Microbiol 8:491–500. doi:10.1038/nrmicro2368. - DOI - PubMed
    1. Calisher CH. 1994. Medically important arboviruses of the United States and Canada. Clin Microbiol Rev 7:89–116. doi:10.1128/cmr.7.1.89. - DOI - PMC - PubMed
    1. de la Monte S, Castro F, Bonilla NJ, Gaskin de Urdaneta A, Hutchins GM. 1985. The systemic pathology of Venezuelan equine encephalitis virus infection in humans. Am J Trop Med Hyg 34:194–202. doi:10.4269/ajtmh.1985.34.194. - DOI - PubMed
    1. Simpson DA, Davis NL, Lin SC, Russell D, Johnston RE. 1996. Complete nucleotide sequence and full-length cDNA clone of S.A.AR86 a South African alphavirus related to Sindbis. Virology 222:464–469. doi:10.1006/viro.1996.0445. - DOI - PubMed

Publication types

MeSH terms

LinkOut - more resources